Races in Germantown, Maryland (MD) Detailed Stats
Data:
Races - White alone (%)
Races - White alone (% change since 2000)
Races - Black alone (%)
Races - Black alone (% change since 2000)
Races - American Indian alone (%)
Races - American Indian alone (% change since 2000)
Races - Asian alone (%)
Races - Asian alone (% change since 2000)
Races - Hispanic (%)
Races - Hispanic (% change since 2000)
Races - Native Hawaiian and Other Pacific Islander alone (%)
Races - Native Hawaiian and Other Pacific Islander alone (% change since 2000)
Races - Two or more races(%)
Races - Two or more races(% change since 2000)
Races - Other race alone (%)
Races - Other race alone (% change since 2000)
Racial diversity
Place of birth - Born in state of residence (%)
Place of birth - Born in state of residence (%) - White
Place of birth - Born in state of residence (%) - Black or African American
Place of birth - Born in state of residence (%) - Asian
Place of birth - Born in state of residence (%) - Hispanic or Latino
Place of birth - Born in state of residence (%) - American Indian and Alaska Native
Place of birth - Born in state of residence (%) - Multirace
Place of birth - Born in state of residence (%) - Other Race
Place of birth - Born in other state (%)
Place of birth - Born in other state (%) - White
Place of birth - Born in other state (%) - Black or African American
Place of birth - Born in other state (%) - Asian
Place of birth - Born in other state (%) - Hispanic or Latino
Place of birth - Born in other state (%) - American Indian and Alaska Native
Place of birth - Born in other state (%) - Multirace
Place of birth - Born in other state (%) - Other Race
Place of birth - Native, outside of US (%)
Place of birth - Native, outside of US (%) - White
Place of birth - Native, outside of US (%) - Black or African American
Place of birth - Native, outside of US (%) - Asian
Place of birth - Native, outside of US (%) - Hispanic or Latino
Place of birth - Native, outside of US (%) - American Indian and Alaska Native
Place of birth - Native, outside of US (%) - Multirace
Place of birth - Native, outside of US (%) - Other Race
Place of birth - Foreign born (%)
Place of birth - Foreign born (%) - White
Place of birth - Foreign born (%) - Black or African American
Place of birth - Foreign born (%) - Asian
Place of birth - Foreign born (%) - Hispanic or Latino
Place of birth - Foreign born (%) - American Indian and Alaska Native
Place of birth - Foreign born (%) - Multirace
Place of birth - Foreign born (%) - Other Race
Residents speaking English at home (%)
Residents speaking English at home - Born in the United States (%)
Residents speaking English at home - Native, born elsewhere (%)
Residents speaking English at home - Foreign born (%)
Residents speaking Spanish at home (%)
Residents speaking Spanish at home - Born in the United States (%)
Residents speaking Spanish at home - Native, born elsewhere (%)
Residents speaking Spanish at home - Foreign born (%)
Residents speaking other language at home (%)
Residents speaking other language at home - Born in the United States (%)
Residents speaking other language at home - Native, born elsewhere (%)
Residents speaking other language at home - Foreign born (%)
Marital status - Never married (%)
Marital status - Now married (%)
Marital status - Separated (%)
Marital status - Widowed (%)
Marital status - Divorced (%)
Ancestries Reported - Arab (%)
Ancestries Reported - Czech (%)
Ancestries Reported - Danish (%)
Ancestries Reported - Dutch (%)
Ancestries Reported - English (%)
Ancestries Reported - French (%)
Ancestries Reported - French Canadian (%)
Ancestries Reported - German (%)
Ancestries Reported - Greek (%)
Ancestries Reported - Hungarian (%)
Ancestries Reported - Irish (%)
Ancestries Reported - Italian (%)
Ancestries Reported - Lithuanian (%)
Ancestries Reported - Norwegian (%)
Ancestries Reported - Polish (%)
Ancestries Reported - Portuguese (%)
Ancestries Reported - Russian (%)
Ancestries Reported - Scotch-Irish (%)
Ancestries Reported - Scottish (%)
Ancestries Reported - Slovak (%)
Ancestries Reported - Subsaharan African (%)
Ancestries Reported - Swedish (%)
Ancestries Reported - Swiss (%)
Ancestries Reported - Ukrainian (%)
Ancestries Reported - United States (%)
Ancestries Reported - Welsh (%)
Ancestries Reported - West Indian (%)
Ancestries Reported - Other (%)
Geographical mobility - Same house 1 year ago (%)
Geographical mobility - Same house 1 year ago (%) - White
Geographical mobility - Same house 1 year ago (%) - Black or African American
Geographical mobility - Same house 1 year ago (%) - Asian
Geographical mobility - Same house 1 year ago (%) - Hispanic or Latino
Geographical mobility - Same house 1 year ago (%) - American Indian and Alaska Native
Geographical mobility - Same house 1 year ago (%) - Multirace
Geographical mobility - Same house 1 year ago (%) - Other Race
Geographical mobility - Moved within same county (%)
Geographical mobility - Moved within same county (%) - White
Geographical mobility - Moved within same county (%) - Black or African American
Geographical mobility - Moved within same county (%) - Asian
Geographical mobility - Moved within same county (%) - Hispanic or Latino
Geographical mobility - Moved within same county (%) - American Indian and Alaska Native
Geographical mobility - Moved within same county (%) - Multirace
Geographical mobility - Moved within same county (%) - Other Race
Geographical mobility - Moved from different county within same state (%)
Geographical mobility - Moved from different county within same state (%) - White
Geographical mobility - Moved from different county within same state (%) - Black or African American
Geographical mobility - Moved from different county within same state (%) - Asian
Geographical mobility - Moved from different county within same state (%) - Hispanic or Latino
Geographical mobility - Moved from different county within same state (%) - American Indian and Alaska Native
Geographical mobility - Moved from different county within same state (%) - Multirace
Geographical mobility - Moved from different county within same state (%) - Other Race
Geographical mobility - Moved from different state (%)
Geographical mobility - Moved from different state (%) - White
Geographical mobility - Moved from different state (%) - Black or African American
Geographical mobility - Moved from different state (%) - Asian
Geographical mobility - Moved from different state (%) - Hispanic or Latino
Geographical mobility - Moved from different state (%) - American Indian and Alaska Native
Geographical mobility - Moved from different state (%) - Multirace
Geographical mobility - Moved from different state (%) - Other Race
Geographical mobility - Moved from abroad (%)
Geographical mobility - Moved from abroad (%) - White
Geographical mobility - Moved from abroad (%) - Black or African American
Geographical mobility - Moved from abroad (%) - Asian
Geographical mobility - Moved from abroad (%) - Hispanic or Latino
Geographical mobility - Moved from abroad (%) - American Indian and Alaska Native
Geographical mobility - Moved from abroad (%) - Multirace
Geographical mobility - Moved from abroad (%) - Other Race
Place of birth for the foreign-born population - Ireland (%)
Place of birth for the foreign-born population - Denmark (%)
Place of birth for the foreign-born population - Norway (%)
Place of birth for the foreign-born population - Sweden (%)
Place of birth for the foreign-born population - United Kingdom (%)
Place of birth for the foreign-born population - England (%)
Place of birth for the foreign-born population - Scotland (%)
Place of birth for the foreign-born population - Other Northern Europe (%)
Place of birth for the foreign-born population - Austria (%)
Place of birth for the foreign-born population - Belgium (%)
Place of birth for the foreign-born population - France (%)
Place of birth for the foreign-born population - Germany (%)
Place of birth for the foreign-born population - Netherlands (%)
Place of birth for the foreign-born population - Switzerland (%)
Place of birth for the foreign-born population - Other Western Europe (%)
Place of birth for the foreign-born population - Greece (%)
Place of birth for the foreign-born population - Italy (%)
Place of birth for the foreign-born population - Portugal (%)
Place of birth for the foreign-born population - Spain (%)
Place of birth for the foreign-born population - Other Southern Europe (%)
Place of birth for the foreign-born population - Albania (%)
Place of birth for the foreign-born population - Belarus (%)
Place of birth for the foreign-born population - Bosnia and Herzegovina (%)
Place of birth for the foreign-born population - Bulgaria (%)
Place of birth for the foreign-born population - Croatia (%)
Place of birth for the foreign-born population - Czechoslovakia (%)
Place of birth for the foreign-born population - Hungary (%)
Place of birth for the foreign-born population - Latvia (%)
Place of birth for the foreign-born population - Lithuania (%)
Place of birth for the foreign-born population - North Macedonia (Macedonia) (%)
Place of birth for the foreign-born population - Moldova (%)
Place of birth for the foreign-born population - Poland (%)
Place of birth for the foreign-born population - Romania (%)
Place of birth for the foreign-born population - Russia (%)
Place of birth for the foreign-born population - Serbia (%)
Place of birth for the foreign-born population - Ukraine (%)
Place of birth for the foreign-born population - Other Eastern Europe (%)
Place of birth for the foreign-born population - China (%)
Place of birth for the foreign-born population - Hong Kong (%)
Place of birth for the foreign-born population - Taiwan (%)
Place of birth for the foreign-born population - Japan (%)
Place of birth for the foreign-born population - Korea (%)
Place of birth for the foreign-born population - Other Eastern Asia (%)
Place of birth for the foreign-born population - Afghanistan (%)
Place of birth for the foreign-born population - Bangladesh (%)
Place of birth for the foreign-born population - India (%)
Place of birth for the foreign-born population - Iran (%)
Place of birth for the foreign-born population - Kazakhstan (%)
Place of birth for the foreign-born population - Nepal (%)
Place of birth for the foreign-born population - Pakistan (%)
Place of birth for the foreign-born population - Sri Lanka (%)
Place of birth for the foreign-born population - Uzbekistan (%)
Place of birth for the foreign-born population - Other South Central Asia (%)
Place of birth for the foreign-born population - Burma (%)
Place of birth for the foreign-born population - Cambodia (%)
Place of birth for the foreign-born population - Indonesia (%)
Place of birth for the foreign-born population - Laos (%)
Place of birth for the foreign-born population - Malaysia (%)
Place of birth for the foreign-born population - Philippines (%)
Place of birth for the foreign-born population - Singapore (%)
Place of birth for the foreign-born population - Thailand (%)
Place of birth for the foreign-born population - Vietnam (%)
Place of birth for the foreign-born population - Other South Eastern Asia (%)
Place of birth for the foreign-born population - Armenia (%)
Place of birth for the foreign-born population - Iraq (%)
Place of birth for the foreign-born population - Israel (%)
Place of birth for the foreign-born population - Jordan (%)
Place of birth for the foreign-born population - Kuwait (%)
Place of birth for the foreign-born population - Lebanon (%)
Place of birth for the foreign-born population - Saudi Arabia (%)
Place of birth for the foreign-born population - Syria (%)
Place of birth for the foreign-born population - Turkey (%)
Place of birth for the foreign-born population - Yemen (%)
Place of birth for the foreign-born population - Other Western Asia (%)
Place of birth for the foreign-born population - Eritrea (%)
Place of birth for the foreign-born population - Ethiopia (%)
Place of birth for the foreign-born population - Kenya (%)
Place of birth for the foreign-born population - Somalia (%)
Place of birth for the foreign-born population - Uganda (%)
Place of birth for the foreign-born population - Zimbabwe (%)
Place of birth for the foreign-born population - Other Eastern Africa (%)
Place of birth for the foreign-born population - Cameroon (%)
Place of birth for the foreign-born population - Congo (%)
Place of birth for the foreign-born population - Democratic Republic of Congo (Zaire) (%)
Place of birth for the foreign-born population - Other Middle Africa (%)
Place of birth for the foreign-born population - Egypt (%)
Place of birth for the foreign-born population - Morocco (%)
Place of birth for the foreign-born population - Sudan (%)
Place of birth for the foreign-born population - Other Northern Africa (%)
Place of birth for the foreign-born population - South Africa (%)
Place of birth for the foreign-born population - Other Southern Africa (%)
Place of birth for the foreign-born population - Cabo Verde (%)
Place of birth for the foreign-born population - Ghana (%)
Place of birth for the foreign-born population - Liberia (%)
Place of birth for the foreign-born population - Nigeria (%)
Place of birth for the foreign-born population - Senegal (%)
Place of birth for the foreign-born population - Sierra Leone (%)
Place of birth for the foreign-born population - Other Western Africa (%)
Place of birth for the foreign-born population - Australia (%)
Place of birth for the foreign-born population - New Zealand (%)
Place of birth for the foreign-born population - Fiji (%)
Place of birth for the foreign-born population - Micronesia (%)
Place of birth for the foreign-born population - Bahamas (%)
Place of birth for the foreign-born population - Barbados (%)
Place of birth for the foreign-born population - Cuba (%)
Place of birth for the foreign-born population - Dominica (%)
Place of birth for the foreign-born population - Dominican Republic (%)
Place of birth for the foreign-born population - Grenada (%)
Place of birth for the foreign-born population - Haiti (%)
Place of birth for the foreign-born population - Jamaica (%)
Place of birth for the foreign-born population - St. Vincent and the Grenadines (%)
Place of birth for the foreign-born population - Trinidad and Tobago (%)
Place of birth for the foreign-born population - West Indies (%)
Place of birth for the foreign-born population - Other Caribbean (%)
Place of birth for the foreign-born population - Belize (%)
Place of birth for the foreign-born population - Costa Rica (%)
Place of birth for the foreign-born population - El Salvador (%)
Place of birth for the foreign-born population - Guatemala (%)
Place of birth for the foreign-born population - Honduras (%)
Place of birth for the foreign-born population - Mexico (%)
Place of birth for the foreign-born population - Nicaragua (%)
Place of birth for the foreign-born population - Panama (%)
Place of birth for the foreign-born population - Other Central America (%)
Place of birth for the foreign-born population - Argentina (%)
Place of birth for the foreign-born population - Bolivia (%)
Place of birth for the foreign-born population - Brazil (%)
Place of birth for the foreign-born population - Chile (%)
Place of birth for the foreign-born population - Colombia (%)
Place of birth for the foreign-born population - Ecuador (%)
Place of birth for the foreign-born population - Guyana (%)
Place of birth for the foreign-born population - Peru (%)
Place of birth for the foreign-born population - Uruguay (%)
Place of birth for the foreign-born population - Venezuela (%)
Place of birth for the foreign-born population - Other South America (%)
Place of birth for the foreign-born population - Canada (%)
Place of birth for the foreign-born population - Other Northern America (%)
Place of birth for the foreign-born population - Other (%)
Latest news about races in Germantown, MD collected exclusively by city-data.com from local newspapers, TV, and radio stations
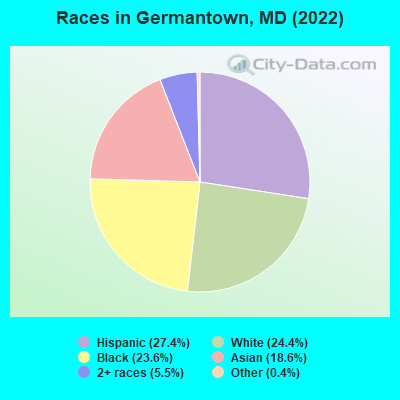
According to 2022 data, the most numerous races in Germantown, MD are White alone (22,764 residents), Black alone (22,004 residents), and Hispanic (25,566 residents). 52.6% of Germantown residents speak English at home. 39.0% of Germantown, MD residents are foreign-born (16.6% born in Asia, 12.9% born in Latin America, 6.0% born in Africa), which is 59.0% greater than the foreign-born rate of 16.0% across the entire state of Maryland.
Race distribution in Germantown
2000 2022
31,855 57.5% White alone 10,411 18.8% Black alone 5,660 10.2% Hispanic 5,440 9.8% Asian alone 1,696 3.1% Two or more races 178 0.3% Other race alone 147 0.3% American Indian alone 32 0.06% Native Hawaiian and Other
25,566 27.4% Hispanic 22,764 24.4% White alone 22,004 23.6% Black alone 17,333 18.6% Asian alone 5,097 5.5% Two or more races 352 0.4% Other race alone 87 0.09% American Indian alone
2000 2022
3,286,547 62.1% White alone 1,464,735 27.7% Black alone 227,916 4.3% Hispanic 209,738 4.0% Asian alone 82,946 1.6% Two or more races 13,312 0.3% American Indian alone 9,379 0.2% Other race alone 1,913 0.04% Native Hawaiian and Other
2,906,492 47.1% White alone 1,800,914 29.2% Black alone 705,842 11.4% Hispanic 401,818 6.5% Asian alone 291,317 4.7% Two or more races 46,930 0.8% Other race alone 8,930 0.1% American Indian alone 2,417 0.04% Native Hawaiian and Other
Income and house value in Germantown Median household income in 2022 $107,843 White non-Hispanic householders$101,628 Black householders$163,056 American Indian and Alaska Native householders$138,826 Asian householders$76,071 Some other race householders$104,050 Two or more races householders$90,832 Hispanic or Latino race householdersMedian 2022 house value $438,583 White Non-Hispanic householders$405,082 Black or African American householders$499,437 American Indian or Alaska Native householders $479,152 Asian householders$408,463 Some other race householders$447,803 Two or more races householders$423,215 Hispanic or Latino householders
Median age by race in Germantown
40.3 Median age for White residents40.6 39.7 40.8 Median age for Black or African American residents38.9 42.9 32.2 Median age for American Indian / Alaska Native residents32.1 37.1 43.2 Median age for Asian residents43.3 43.2 -666,666,666.0 Median age for Native Hawaiian / Pacific Islander residents-666,666,666.0 -666,666,666.0 32.7 Median age for Other race residents29.7 33.6 25.2 Median age for Two or more races residents22.1 35.7 41.6 Median age for White alone residents41.6 41.3 32.8 Median age for Hispanic or Latino residents32.2 34.6
Owner/renter occupied households by race in Germantown
House owners and renters - White residents 7,834 65.8% Owner occupied4,080 34.2% Renter occupiedHouse owners and renters - Black or African American residents 5,076 54.1% Owner occupied4,308 45.9% Renter occupiedHouse owners and renters - American Indian / Alaska Native residents 8 13.0% Owner occupied54 87.0% Renter occupiedHouse owners and renters - Asian residents 4,841 80.5% Owner occupied1,174 19.5% Renter occupiedHouse owners and renters - Other race residents 2,206 53.6% Owner occupied1,906 46.4% Renter occupiedHouse owners and renters - Two or more races residents 2,028 73.4% Owner occupied736 26.6% Renter occupiedHouse owners and renters - White alone residents 7,588 66.2% Owner occupied3,877 33.8% Renter occupiedHouse owners and renters - Hispanic or Latino residents 4,246 62.4% Owner occupied2,563 37.6% Renter occupied
Language usage in Germantown
English speakers - Total 52.6% of residents of Germantown speak English at home.
22.8% of residents speak Spanish at home 11,333 56.1% Speak English very well8,878 43.9% Speak English less than very well24.6% of residents speak other language at home 13,659 62.8% Speak English very well8,085 37.2% Speak English less than very well
English speakers - Born in the United States 84.1% of residents of Germantown speak English at home.
10.5% of residents speak Spanish at home 1,925 79.0% Speak English very well513 21.0% Speak English less than very well5.3% of residents speak other language at home 1,234 100.0% Speak English very well
English speakers - Native, born elsewhere 43.3% of residents of Germantown speak English at home.
48.5% of residents speak Spanish at home 763 56.3% Speak English very well592 43.7% Speak English less than very well8.2% of residents speak other language at home 123 53.7% Speak English very well106 46.3% Speak English less than very well
English speakers - Foreign-born 16.0% of residents of Germantown speak English at home.
33.9% of residents speak Spanish at home 5,040 42.9% Speak English very well6,704 57.1% Speak English less than very well50.2% of residents speak other language at home 9,970 57.3% Speak English very well7,433 42.7% Speak English less than very well
White (Caucasian) - Speak only English Native:
89.8% (18,642)Foreign-born:
9.0% (352)
White (Caucasian) - Speak another language Native:
10.2% (2,122)Foreign-born:
91.0% (3,548)
Black or African American - Speak only English Native:
95.3% (15,198)Foreign-born:
37.7% (2,444)
Black or African American - Speak another language Native:
4.7% (747)Foreign-born:
62.3% (4,035)
American Indian / Alaska Native - Speak only English Native:
39.0% (29)Foreign-born:
13.5% (18)
American Indian / Alaska Native - Speak another language Native:
58.2% (43)Foreign-born:
92.7% (124)
Asian - Speak only English Native:
39.0% (1,586)Foreign-born:
13.0% (1,612)
Asian - Speak another language Native:
61.0% (2,480)Foreign-born:
87.0% (10,803)
Other race - Speak only English Native:
25.1% (1,412)Foreign-born:
3.7% (250)
Other race - Speak another language Native:
74.9% (4,204)Foreign-born:
96.3% (6,473)
Two or more races - Speak only English Native:
56.7% (4,172)Foreign-born:
18.9% (881)
Two or more races - Speak another language Native:
43.3% (3,180)Foreign-born:
81.1% (3,773)
White alone - Speak only English Native:
92.9% (18,109)Foreign-born:
14.0% (352)
White alone - Speak another language Native:
7.1% (1,392)Foreign-born:
86.0% (2,161)
Hispanic or Latino - Speak only English Native:
29.3% (3,462)Foreign-born:
5.8% (719)
Hispanic or Latino - Speak another language Native:
70.7% (8,341)Foreign-born:
94.2% (11,744)
Foreign-born residents in Germantown 35,040 residents are foreign born (16.6% Asia , 12.9% Latin America , 6.0% Africa ).
This city:
39.0%Maryland:
15.7%
Marital status for residents in Germantown Marital status - White (Caucasian) population 15 years and over
Males 45.7% Never married47.2% Now married3.8% Separated0.0% Widowed3.3% DivorcedFemales 33.1% Never married44.9% Now married4.5% Separated2.6% Widowed14.8% DivorcedWomen who gave birth in the past 12 months Now married:
100.0% (326)Unmarried:
0.0% (0)
Women who did not give birth in the past 12 months Now married:
46.8% (3,002)Unmarried:
53.2% (3,414)
Marital status - Black or African American population 15 years and over
Males 38.8% Never married41.7% Now married0.0% Separated4.0% Widowed15.6% DivorcedFemales 46.5% Never married31.1% Now married0.9% Separated5.8% Widowed15.7% DivorcedWomen who gave birth in the past 12 months Now married:
77.2% (257)Unmarried:
22.8% (76)
Women who did not give birth in the past 12 months Now married:
32.6% (1,923)Unmarried:
67.4% (3,974)
Marital status - American Indian / Alaska Native population 15 years and over
Males 31.5% Never married44.6% Now married0.0% Separated23.9% Widowed0.0% DivorcedFemales 41.8% Never married58.2% Now married0.0% Separated0.0% Widowed0.0% DivorcedWomen who did not give birth in the past 12 months Now married:
41.4% (18)Unmarried:
58.6% (25)
Marital status - Asian population 15 years and over
Males 23.6% Never married66.3% Now married0.8% Separated1.0% Widowed8.2% DivorcedFemales 23.4% Never married62.6% Now married1.3% Separated6.9% Widowed5.9% DivorcedWomen who gave birth in the past 12 months Now married:
100.0% (113)Unmarried:
0.0% (0)
Women who did not give birth in the past 12 months Now married:
58.9% (2,383)Unmarried:
41.1% (1,663)
Marital status - Other race population 15 years and over
Males 47.0% Never married37.7% Now married5.8% Separated2.5% Widowed7.0% DivorcedFemales 37.3% Never married36.5% Now married0.6% Separated5.9% Widowed19.7% DivorcedWomen who gave birth in the past 12 months Now married:
0.0% (0)Unmarried:
100.0% (25)
Women who did not give birth in the past 12 months Now married:
35.1% (1,089)Unmarried:
64.9% (2,016)
Marital status - Two or more races population 15 years and over
Males 30.4% Never married54.1% Now married6.7% Separated0.0% Widowed8.8% DivorcedFemales 30.8% Never married42.9% Now married13.7% Separated4.1% Widowed8.5% DivorcedWomen who gave birth in the past 12 months Now married:
16.8% (27)Unmarried:
83.2% (134)
Women who did not give birth in the past 12 months Now married:
51.3% (1,783)Unmarried:
48.7% (1,692)
Marital status - White alone, not Hispanic / Latino population 15 years and over
Males 43.0% Never married48.9% Now married4.3% Separated0.0% Widowed3.8% DivorcedFemales 32.3% Never married44.3% Now married4.8% Separated2.8% Widowed15.8% DivorcedWomen who gave birth in the past 12 months Now married:
100.0% (326)Unmarried:
0.0% (0)
Women who did not give birth in the past 12 months Now married:
46.7% (2,711)Unmarried:
53.3% (3,092)
Marital status - Hispanic or Latino population 15 years and over
Males 48.0% Never married38.6% Now married4.5% Separated1.4% Widowed7.5% DivorcedFemales 41.2% Never married36.9% Now married5.3% Separated4.1% Widowed12.5% DivorcedWomen who gave birth in the past 12 months Now married:
52.2% (94)Unmarried:
47.8% (86)
Women who did not give birth in the past 12 months Now married:
43.6% (2,949)Unmarried:
56.4% (3,815)
Ancestries in Germantown
1,929 3.3% African1,245 2.2% German1,151 2.0% Irish1,146 2.0% English1,131 2.0% Ghanaian1,017 1.8% Jamaican916 1.6% American914 1.6% European866 1.5% Italian859 1.5% Nigerian832 1.4% Iranian780 1.4% Albanian510 0.9% Ethiopian403 0.7% Russian352 0.6% Polish332 0.6% West Indian323 0.6% British229 0.4% Brazilian180 0.3% Haitian173 0.3% Kenyan166 0.3% Sierra Leonean164 0.3% Scottish139 0.2% French134 0.2% Trinidadian and Tobagonian131 0.2% Eastern European129 0.2% Lebanese124 0.2% Northern European113 0.2% Ukrainian107 0.2% Czechoslovakian107 0.2% Greek106 0.2% Austrian92 0.2% Egyptian82 0.1% Hungarian74 0.1% Palestinian65 0.1% Slovak62 0.1% British West Indian62 0.1% Scandinavian59 0.1% Cajun50 0.09% Swedish49 0.09% Yugoslavian49 0.09% Pennsylvania German44 0.08% French Canadian43 0.07% Serbian40 0.07% Welsh39 0.07% Guyanese37 0.06% Czech30 0.05% Romanian27 0.05% Syrian25 0.04% Bulgarian24 0.04% Dutch23 0.04% Finnish23 0.04% Barbadian21 0.04% Zimbabwean19 0.03% Assyrian19 0.03% Turkish18 0.03% Senegalese18 0.03% Scotch-Irish17 0.03% Iraqi12 0.02% Arab12 0.02% Australian11 0.02% Armenian10 0.02% Slovene9 0.02% Lithuanian8 0.01% Norwegian8 0.01% Portuguese8 0.01% Ugandan6 0.01% Afghan4 0.01% Israeli
Geographical mobility in Germantown Same house 1 year ago 22,036 87.3% White (Caucasian)20,241 89.8% Black or African American185 77.8% American Indian / Alaska Native15,611 90.0% Asian7,641 85.4% Other race12,262 92.5% Two or more races20,355 90.4% White alone, not Hispanic / Latino20,728 81.5% Hispanic or LatinoMoved within same county 2,378 9.4% White / Caucasian1,218 5.4% Black or African American43 18.1% American Indian / Alaska Native913 5.3% Asian815 9.1% Other race655 4.9% Two or more races1,398 6.2% White alone, not Hispanic / Latino2,875 11.3% Hispanic or LatinoMoved within same state 378 1.5% White / Caucasian201 0.9% Black or African American10 4.2% American Indian / Alaska Native191 2.1% Other race93 0.7% Two or more races187 0.8% White alone, not Hispanic / Latino1,109 4.4% Hispanic or LatinoMoved from different state 449 1.8% White / Caucasian304 1.3% Black or African American33 0.2% Asian42 0.5% Other race114 0.9% Two or more races580 2.6% White alone, not Hispanic / Latino149 0.6% Hispanic or LatinoMoved from abroad 502 2.2% Black or African American786 4.5% Asian202 2.3% Other race105 0.8% Two or more races24 0.1% White alone, not Hispanic / Latino580 2.3% Hispanic or Latino
Children Nativity (place of birth) in Germantown
Children under 6 years - Living with two parents Both parents native 1,215 100.0% NativeBoth parents foreign-born 1,745 80.0% Native437 20.0% Foreign-bornOne native, one foreign-born parent 388 100.0% NativeChildren under 6 years - Living with one parent Native parent 541 100.0% NativeForeign-born parent 725 100.0% NativeChildren 6 to 17 years - Living with two parents Both parents native 2,421 100.0% NativeBoth parents foreign-born 3,683 66.5% Native1,852 33.5% Foreign-bornOne native, one foreign-born parent 678 100.0% NativeChildren 6 to 17 years - Living with one parent Native parent 3,927 100.0% NativeForeign-born parent 1,694 52.9% Native1,507 47.1% Foreign-born
Place of birth for residents in Germantown 15,508 Asia12,200 Americas12,097 Latin America6,602 South Central Asia5,636 Africa5,566 Central America5,462 Eastern Asia4,705 South America4,399 China3,941 Western Africa2,637 South Eastern Asia1,826 Caribbean1,575 Europe823 Eastern Africa807 Eastern Europe753 Western Asia672 Middle Africa314 Southern Europe256 Western Europe179 Northern Europe127 Northern Africa118 Oceania118 Australia and New Zealand Subregion102 Northern America3,629 India3,430 China3,077 El Salvador1,726 Peru1,214 Pakistan1,124 Philippines1,069 Ghana1,001 Jamaica915 Bolivia882 Korea780 Vietnam717 Honduras697 Guatemala621 Hong Kong616 Mexico572 Nepal568 Iran564 Cameroon545 Nigeria492 Togo452 Brazil412 Colombia382 Bangladesh376 Senegal347 Taiwan342 Ivory Coast339 Nicaragua330 Ecuador300 Liberia290 Guyana288 Iraq281 Burma (Myanmar)266 Spain242 Chile242 Ethiopia220 Trinidad and Tobago217 Kenya209 Russia209 Haiti188 Argentina179 Japan177 Eritrea176 Germany156 Dominican Republic141 Sierra Leone132 Laos132 United Kingdom123 Sri Lanka123 Thailand116 Panama105 Lebanon104 Ukraine102 Canada100 Georgia91 Cuba88 United Arab Emirates85 Indonesia84 Uganda84 Australia73 Czechoslovakia72 Democratic Republic of Congo (Zaire)68 Tanzania67 Albania66 Malaysia61 St. Vincent and the Grenadines61 Sudan58 Kazakhstan51 Azerbaijan48 Bosnia and Herzegovina48 Venezuela48 West Indies46 England45 Netherlands40 Jordan39 Algeria35 Congo34 New Zealand33 Cambodia27 Egypt25 Israel25 Italy24 Barbados22 Bulgaria22 France21 Portugal20 Belarus19 Uzbekistan18 Syria14 Uruguay13 Kuwait12 Zimbabwe11 Austria10 Turkey9 Singapore8 Saudi Arabia7 Romania6 Afghanistan
Grandparents responsible for own grandchildren in Germantown
Grandparents (30 to 59 years) White / Caucasian 7 4.2% Responsible for grandchildren171 95.8% Not responsible for grandchildrenBlack or African American 11 7.1% Responsible for grandchildren139 92.9% Not responsible for grandchildrenAsian 26 100.0% Not responsible for grandchildrenOther race 54 100.0% Not responsible for grandchildrenTwo or more races 15 100.0% Not responsible for grandchildrenWhite alone, not Hispanic / Latino 8 4.3% Responsible for grandchildren169 95.7% Not responsible for grandchildrenHispanic or Latino 122 100.0% Not responsible for grandchildrenGrandparents (60 years and over) White / Caucasian 130 41.3% Responsible for grandchildren184 58.7% Not responsible for grandchildrenBlack or African American 42 17.2% Responsible for grandchildren202 82.8% Not responsible for grandchildrenAsian 51 11.0% Responsible for grandchildren414 89.0% Not responsible for grandchildrenOther race 15 10.3% Responsible for grandchildren129 89.7% Not responsible for grandchildrenTwo or more races 305 100.0% Not responsible for grandchildrenWhite alone, not Hispanic / Latino 65 45.9% Responsible for grandchildren77 54.1% Not responsible for grandchildrenHispanic or Latino 108 26.7% Responsible for grandchildren297 73.3% Not responsible for grandchildren