Races in Gardner, Massachusetts (MA) Detailed Stats
Data:
Races - White alone (%)
Races - White alone (% change since 2000)
Races - Black alone (%)
Races - Black alone (% change since 2000)
Races - American Indian alone (%)
Races - American Indian alone (% change since 2000)
Races - Asian alone (%)
Races - Asian alone (% change since 2000)
Races - Hispanic (%)
Races - Hispanic (% change since 2000)
Races - Native Hawaiian and Other Pacific Islander alone (%)
Races - Native Hawaiian and Other Pacific Islander alone (% change since 2000)
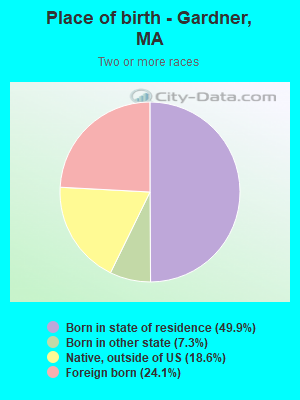
Races - Two or more races(%)
Races - Two or more races(% change since 2000)
Races - Other race alone (%)
Races - Other race alone (% change since 2000)
Racial diversity
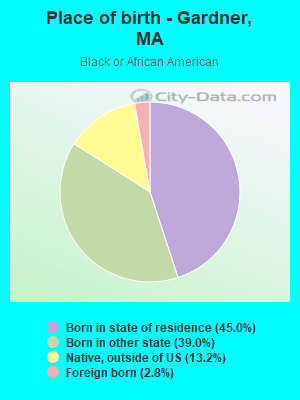
Place of birth - Born in state of residence (%)
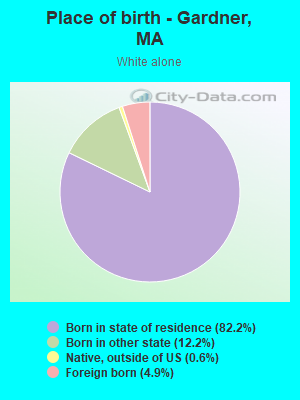
Place of birth - Born in state of residence (%) - White
Place of birth - Born in state of residence (%) - Black or African American
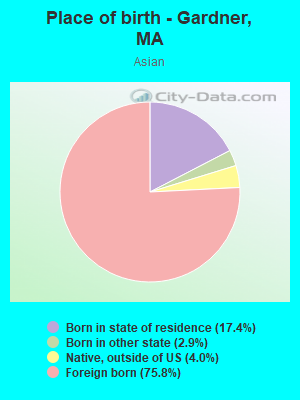
Place of birth - Born in state of residence (%) - Asian
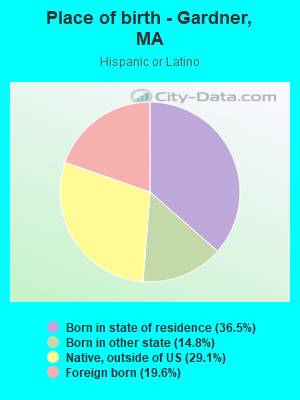
Place of birth - Born in state of residence (%) - Hispanic or Latino
Place of birth - Born in state of residence (%) - American Indian and Alaska Native
Place of birth - Born in state of residence (%) - Multirace
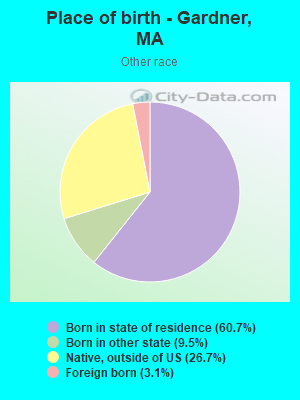
Place of birth - Born in state of residence (%) - Other Race
Place of birth - Born in other state (%)
Place of birth - Born in other state (%) - White
Place of birth - Born in other state (%) - Black or African American
Place of birth - Born in other state (%) - Asian
Place of birth - Born in other state (%) - Hispanic or Latino
Place of birth - Born in other state (%) - American Indian and Alaska Native
Place of birth - Born in other state (%) - Multirace
Place of birth - Born in other state (%) - Other Race
Place of birth - Native, outside of US (%)
Place of birth - Native, outside of US (%) - White
Place of birth - Native, outside of US (%) - Black or African American
Place of birth - Native, outside of US (%) - Asian
Place of birth - Native, outside of US (%) - Hispanic or Latino
Place of birth - Native, outside of US (%) - American Indian and Alaska Native
Place of birth - Native, outside of US (%) - Multirace
Place of birth - Native, outside of US (%) - Other Race
Place of birth - Foreign born (%)
Place of birth - Foreign born (%) - White
Place of birth - Foreign born (%) - Black or African American
Place of birth - Foreign born (%) - Asian
Place of birth - Foreign born (%) - Hispanic or Latino
Place of birth - Foreign born (%) - American Indian and Alaska Native
Place of birth - Foreign born (%) - Multirace
Place of birth - Foreign born (%) - Other Race
Residents speaking English at home (%)
Residents speaking English at home - Born in the United States (%)
Residents speaking English at home - Native, born elsewhere (%)
Residents speaking English at home - Foreign born (%)
Residents speaking Spanish at home (%)
Residents speaking Spanish at home - Born in the United States (%)
Residents speaking Spanish at home - Native, born elsewhere (%)
Residents speaking Spanish at home - Foreign born (%)
Residents speaking other language at home (%)
Residents speaking other language at home - Born in the United States (%)
Residents speaking other language at home - Native, born elsewhere (%)
Residents speaking other language at home - Foreign born (%)
Marital status - Never married (%)
Marital status - Now married (%)
Marital status - Separated (%)
Marital status - Widowed (%)
Marital status - Divorced (%)
Ancestries Reported - Arab (%)
Ancestries Reported - Czech (%)
Ancestries Reported - Danish (%)
Ancestries Reported - Dutch (%)
Ancestries Reported - English (%)
Ancestries Reported - French (%)
Ancestries Reported - French Canadian (%)
Ancestries Reported - German (%)
Ancestries Reported - Greek (%)
Ancestries Reported - Hungarian (%)
Ancestries Reported - Irish (%)
Ancestries Reported - Italian (%)
Ancestries Reported - Lithuanian (%)
Ancestries Reported - Norwegian (%)
Ancestries Reported - Polish (%)
Ancestries Reported - Portuguese (%)
Ancestries Reported - Russian (%)
Ancestries Reported - Scotch-Irish (%)
Ancestries Reported - Scottish (%)
Ancestries Reported - Slovak (%)
Ancestries Reported - Subsaharan African (%)
Ancestries Reported - Swedish (%)
Ancestries Reported - Swiss (%)
Ancestries Reported - Ukrainian (%)
Ancestries Reported - United States (%)
Ancestries Reported - Welsh (%)
Ancestries Reported - West Indian (%)
Ancestries Reported - Other (%)
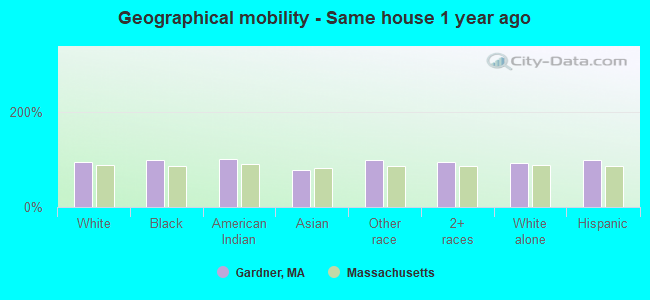
Geographical mobility - Same house 1 year ago (%)
Geographical mobility - Same house 1 year ago (%) - White
Geographical mobility - Same house 1 year ago (%) - Black or African American
Geographical mobility - Same house 1 year ago (%) - Asian
Geographical mobility - Same house 1 year ago (%) - Hispanic or Latino
Geographical mobility - Same house 1 year ago (%) - American Indian and Alaska Native
Geographical mobility - Same house 1 year ago (%) - Multirace
Geographical mobility - Same house 1 year ago (%) - Other Race
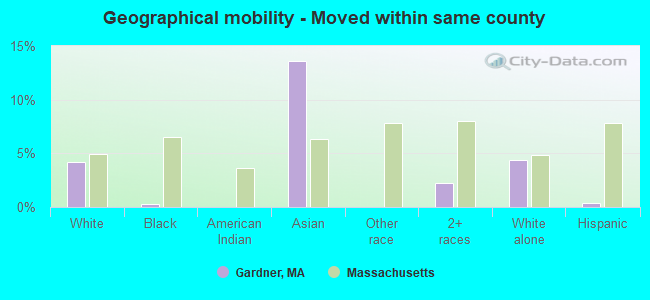
Geographical mobility - Moved within same county (%)
Geographical mobility - Moved within same county (%) - White
Geographical mobility - Moved within same county (%) - Black or African American
Geographical mobility - Moved within same county (%) - Asian
Geographical mobility - Moved within same county (%) - Hispanic or Latino
Geographical mobility - Moved within same county (%) - American Indian and Alaska Native
Geographical mobility - Moved within same county (%) - Multirace
Geographical mobility - Moved within same county (%) - Other Race
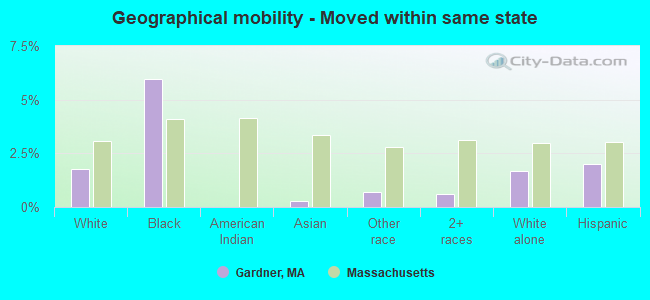
Geographical mobility - Moved from different county within same state (%)
Geographical mobility - Moved from different county within same state (%) - White
Geographical mobility - Moved from different county within same state (%) - Black or African American
Geographical mobility - Moved from different county within same state (%) - Asian
Geographical mobility - Moved from different county within same state (%) - Hispanic or Latino
Geographical mobility - Moved from different county within same state (%) - American Indian and Alaska Native
Geographical mobility - Moved from different county within same state (%) - Multirace
Geographical mobility - Moved from different county within same state (%) - Other Race
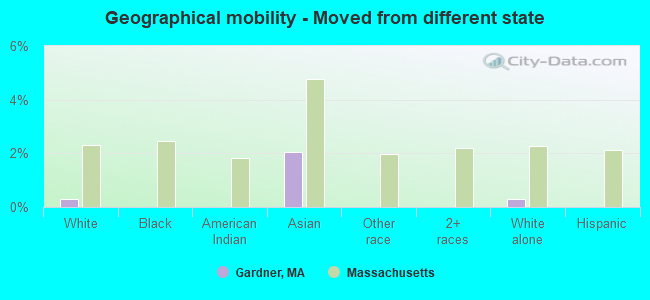
Geographical mobility - Moved from different state (%)
Geographical mobility - Moved from different state (%) - White
Geographical mobility - Moved from different state (%) - Black or African American
Geographical mobility - Moved from different state (%) - Asian
Geographical mobility - Moved from different state (%) - Hispanic or Latino
Geographical mobility - Moved from different state (%) - American Indian and Alaska Native
Geographical mobility - Moved from different state (%) - Multirace
Geographical mobility - Moved from different state (%) - Other Race
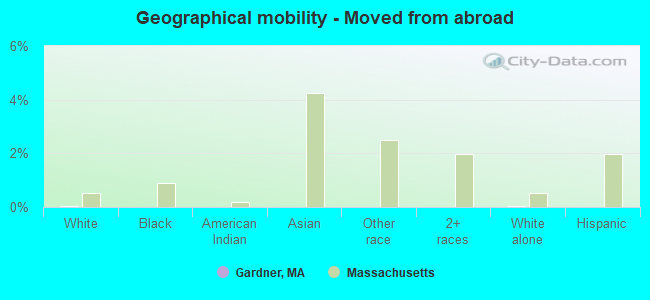
Geographical mobility - Moved from abroad (%)
Geographical mobility - Moved from abroad (%) - White
Geographical mobility - Moved from abroad (%) - Black or African American
Geographical mobility - Moved from abroad (%) - Asian
Geographical mobility - Moved from abroad (%) - Hispanic or Latino
Geographical mobility - Moved from abroad (%) - American Indian and Alaska Native
Geographical mobility - Moved from abroad (%) - Multirace
Geographical mobility - Moved from abroad (%) - Other Race
Place of birth for the foreign-born population - Ireland (%)
Place of birth for the foreign-born population - Denmark (%)
Place of birth for the foreign-born population - Norway (%)
Place of birth for the foreign-born population - Sweden (%)
Place of birth for the foreign-born population - United Kingdom (%)
Place of birth for the foreign-born population - England (%)
Place of birth for the foreign-born population - Scotland (%)
Place of birth for the foreign-born population - Other Northern Europe (%)
Place of birth for the foreign-born population - Austria (%)
Place of birth for the foreign-born population - Belgium (%)
Place of birth for the foreign-born population - France (%)
Place of birth for the foreign-born population - Germany (%)
Place of birth for the foreign-born population - Netherlands (%)
Place of birth for the foreign-born population - Switzerland (%)
Place of birth for the foreign-born population - Other Western Europe (%)
Place of birth for the foreign-born population - Greece (%)
Place of birth for the foreign-born population - Italy (%)
Place of birth for the foreign-born population - Portugal (%)
Place of birth for the foreign-born population - Spain (%)
Place of birth for the foreign-born population - Other Southern Europe (%)
Place of birth for the foreign-born population - Albania (%)
Place of birth for the foreign-born population - Belarus (%)
Place of birth for the foreign-born population - Bosnia and Herzegovina (%)
Place of birth for the foreign-born population - Bulgaria (%)
Place of birth for the foreign-born population - Croatia (%)
Place of birth for the foreign-born population - Czechoslovakia (%)
Place of birth for the foreign-born population - Hungary (%)
Place of birth for the foreign-born population - Latvia (%)
Place of birth for the foreign-born population - Lithuania (%)
Place of birth for the foreign-born population - North Macedonia (Macedonia) (%)
Place of birth for the foreign-born population - Moldova (%)
Place of birth for the foreign-born population - Poland (%)
Place of birth for the foreign-born population - Romania (%)
Place of birth for the foreign-born population - Russia (%)
Place of birth for the foreign-born population - Serbia (%)
Place of birth for the foreign-born population - Ukraine (%)
Place of birth for the foreign-born population - Other Eastern Europe (%)
Place of birth for the foreign-born population - China (%)
Place of birth for the foreign-born population - Hong Kong (%)
Place of birth for the foreign-born population - Taiwan (%)
Place of birth for the foreign-born population - Japan (%)
Place of birth for the foreign-born population - Korea (%)
Place of birth for the foreign-born population - Other Eastern Asia (%)
Place of birth for the foreign-born population - Afghanistan (%)
Place of birth for the foreign-born population - Bangladesh (%)
Place of birth for the foreign-born population - India (%)
Place of birth for the foreign-born population - Iran (%)
Place of birth for the foreign-born population - Kazakhstan (%)
Place of birth for the foreign-born population - Nepal (%)
Place of birth for the foreign-born population - Pakistan (%)
Place of birth for the foreign-born population - Sri Lanka (%)
Place of birth for the foreign-born population - Uzbekistan (%)
Place of birth for the foreign-born population - Other South Central Asia (%)
Place of birth for the foreign-born population - Burma (%)
Place of birth for the foreign-born population - Cambodia (%)
Place of birth for the foreign-born population - Indonesia (%)
Place of birth for the foreign-born population - Laos (%)
Place of birth for the foreign-born population - Malaysia (%)
Place of birth for the foreign-born population - Philippines (%)
Place of birth for the foreign-born population - Singapore (%)
Place of birth for the foreign-born population - Thailand (%)
Place of birth for the foreign-born population - Vietnam (%)
Place of birth for the foreign-born population - Other South Eastern Asia (%)
Place of birth for the foreign-born population - Armenia (%)
Place of birth for the foreign-born population - Iraq (%)
Place of birth for the foreign-born population - Israel (%)
Place of birth for the foreign-born population - Jordan (%)
Place of birth for the foreign-born population - Kuwait (%)
Place of birth for the foreign-born population - Lebanon (%)
Place of birth for the foreign-born population - Saudi Arabia (%)
Place of birth for the foreign-born population - Syria (%)
Place of birth for the foreign-born population - Turkey (%)
Place of birth for the foreign-born population - Yemen (%)
Place of birth for the foreign-born population - Other Western Asia (%)
Place of birth for the foreign-born population - Eritrea (%)
Place of birth for the foreign-born population - Ethiopia (%)
Place of birth for the foreign-born population - Kenya (%)
Place of birth for the foreign-born population - Somalia (%)
Place of birth for the foreign-born population - Uganda (%)
Place of birth for the foreign-born population - Zimbabwe (%)
Place of birth for the foreign-born population - Other Eastern Africa (%)
Place of birth for the foreign-born population - Cameroon (%)
Place of birth for the foreign-born population - Congo (%)
Place of birth for the foreign-born population - Democratic Republic of Congo (Zaire) (%)
Place of birth for the foreign-born population - Other Middle Africa (%)
Place of birth for the foreign-born population - Egypt (%)
Place of birth for the foreign-born population - Morocco (%)
Place of birth for the foreign-born population - Sudan (%)
Place of birth for the foreign-born population - Other Northern Africa (%)
Place of birth for the foreign-born population - South Africa (%)
Place of birth for the foreign-born population - Other Southern Africa (%)
Place of birth for the foreign-born population - Cabo Verde (%)
Place of birth for the foreign-born population - Ghana (%)
Place of birth for the foreign-born population - Liberia (%)
Place of birth for the foreign-born population - Nigeria (%)
Place of birth for the foreign-born population - Senegal (%)
Place of birth for the foreign-born population - Sierra Leone (%)
Place of birth for the foreign-born population - Other Western Africa (%)
Place of birth for the foreign-born population - Australia (%)
Place of birth for the foreign-born population - New Zealand (%)
Place of birth for the foreign-born population - Fiji (%)
Place of birth for the foreign-born population - Micronesia (%)
Place of birth for the foreign-born population - Bahamas (%)
Place of birth for the foreign-born population - Barbados (%)
Place of birth for the foreign-born population - Cuba (%)
Place of birth for the foreign-born population - Dominica (%)
Place of birth for the foreign-born population - Dominican Republic (%)
Place of birth for the foreign-born population - Grenada (%)
Place of birth for the foreign-born population - Haiti (%)
Place of birth for the foreign-born population - Jamaica (%)
Place of birth for the foreign-born population - St. Vincent and the Grenadines (%)
Place of birth for the foreign-born population - Trinidad and Tobago (%)
Place of birth for the foreign-born population - West Indies (%)
Place of birth for the foreign-born population - Other Caribbean (%)
Place of birth for the foreign-born population - Belize (%)
Place of birth for the foreign-born population - Costa Rica (%)
Place of birth for the foreign-born population - El Salvador (%)
Place of birth for the foreign-born population - Guatemala (%)
Place of birth for the foreign-born population - Honduras (%)
Place of birth for the foreign-born population - Mexico (%)
Place of birth for the foreign-born population - Nicaragua (%)
Place of birth for the foreign-born population - Panama (%)
Place of birth for the foreign-born population - Other Central America (%)
Place of birth for the foreign-born population - Argentina (%)
Place of birth for the foreign-born population - Bolivia (%)
Place of birth for the foreign-born population - Brazil (%)
Place of birth for the foreign-born population - Chile (%)
Place of birth for the foreign-born population - Colombia (%)
Place of birth for the foreign-born population - Ecuador (%)
Place of birth for the foreign-born population - Guyana (%)
Place of birth for the foreign-born population - Peru (%)
Place of birth for the foreign-born population - Uruguay (%)
Place of birth for the foreign-born population - Venezuela (%)
Place of birth for the foreign-born population - Other South America (%)
Place of birth for the foreign-born population - Canada (%)
Place of birth for the foreign-born population - Other Northern America (%)
Place of birth for the foreign-born population - Other (%)
Latest news about races in Gardner, MA collected exclusively by city-data.com from local newspapers, TV, and radio stations
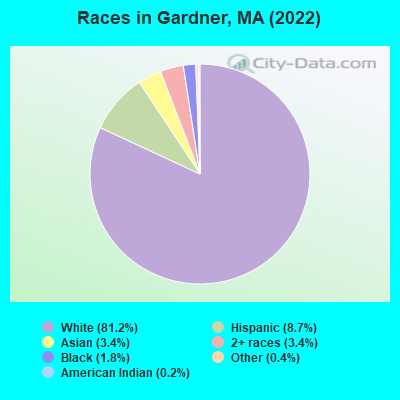
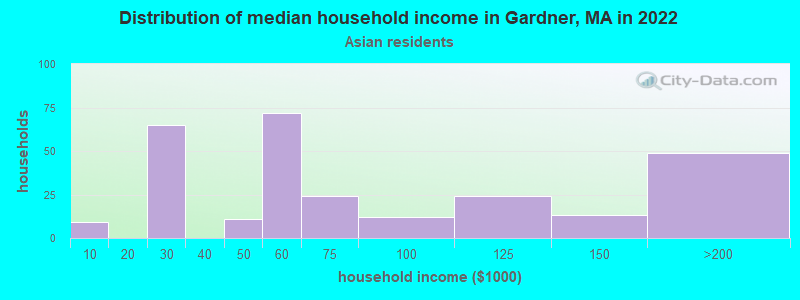
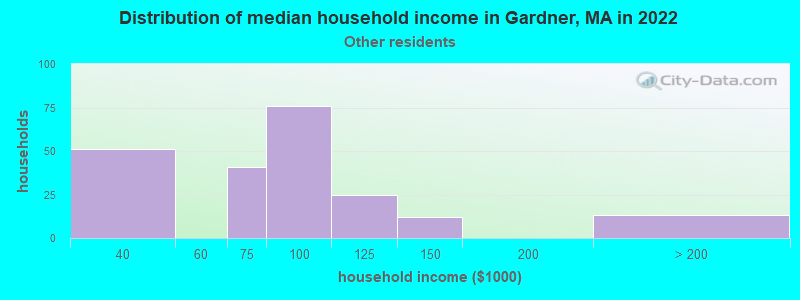
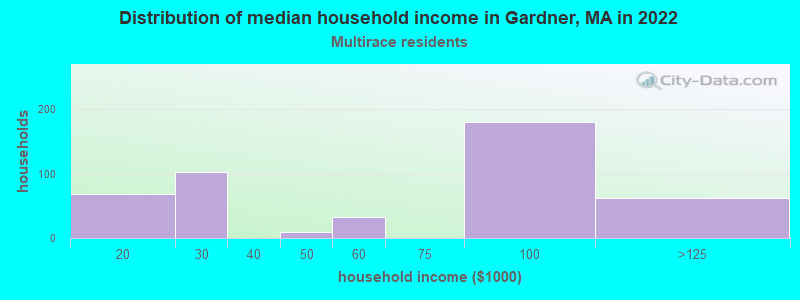
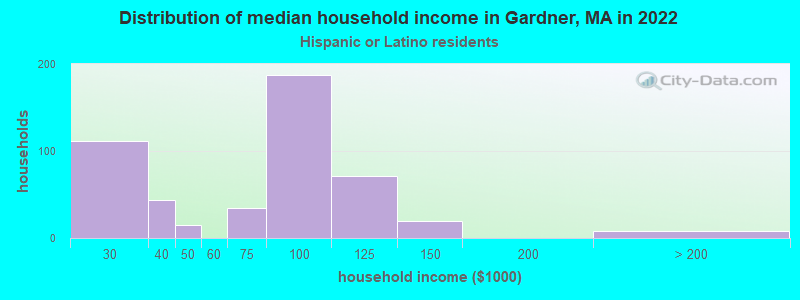
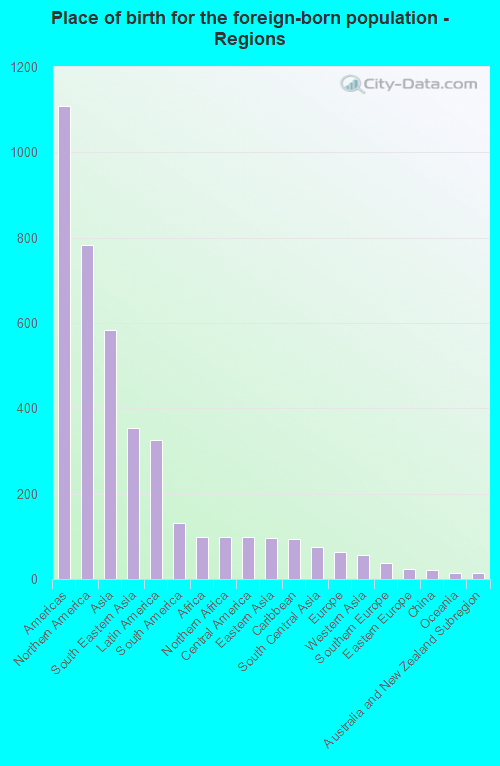
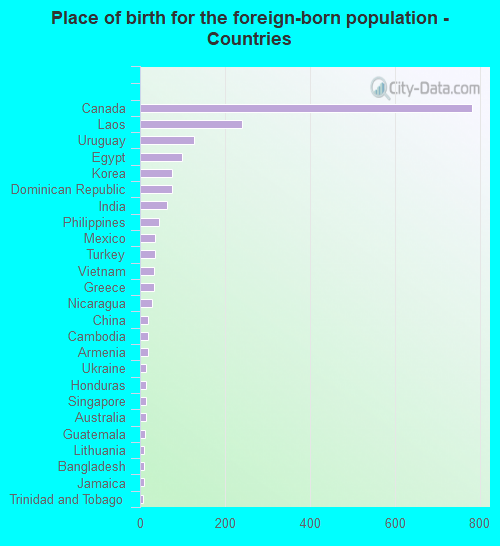
According to 2022 data, the most numerous races in Gardner, MA are White alone (17,205 residents), Hispanic (1,853 residents), and Asian alone (712 residents). 87.4% of Gardner residents speak English at home. 8.8% of Gardner, MA residents are foreign-born (3.6% born in North America, 2.7% born in Asia, 1.5% born in Latin America), which is 104.2% less than the foreign-born rate of 18.0% across the entire state of Massachusetts.
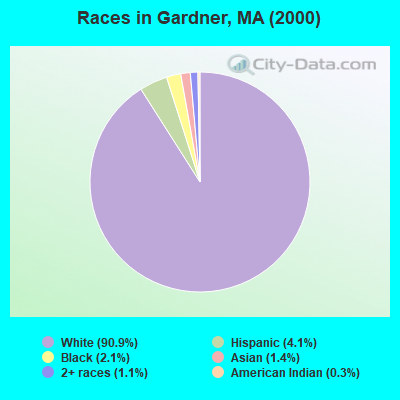
Race distribution in Gardner
2000 2022
5,198,359 81.9% White alone 428,729 6.8% Hispanic 318,329 5.0% Black alone 236,786 3.7% Asian alone 110,338 1.7% Two or more races 43,586 0.7% Other race alone 11,264 0.2% American Indian alone 1,706 0.03% Native Hawaiian and Other
4,676,627 67.0% White alone 911,038 13.0% Hispanic 501,463 7.2% Asian alone 459,740 6.6% Black alone 341,889 4.9% Two or more races 84,403 1.2% Other race alone 5,838 0.08% American Indian alone 976 0.01% Native Hawaiian and Other
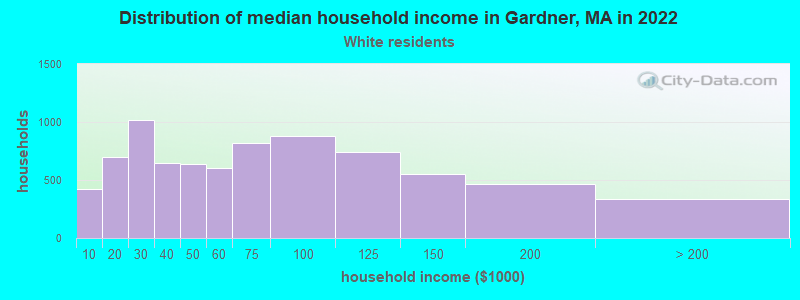
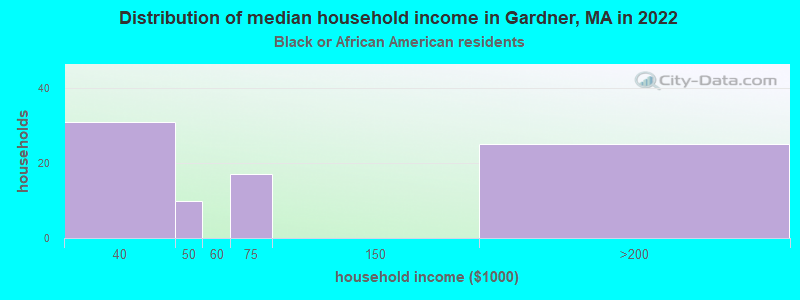
Income and house value in Gardner Median household income in 2022 $56,017 White non-Hispanic householders$58,287 Asian householders$84,391 Some other race householders$72,976 Hispanic or Latino race householdersMedian 2022 house value $269,783 White Non-Hispanic householders$303,824 Black or African American householders$349,296 American Indian or Alaska Native householders $258,606 Asian householders$241,331 Some other race householders$285,787 Two or more races householders$285,787 Hispanic or Latino householders
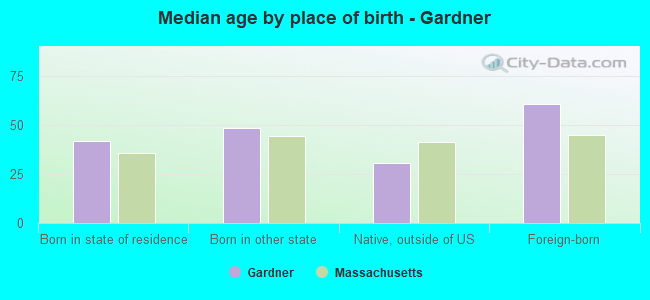
Median age by race in Gardner
47.9 Median age for White residents47.9 48.5 25.7 Median age for Black or African American residents24.0 26.3 28.1 Median age for American Indian / Alaska Native residents30.3 -657,223,795.4 49.8 Median age for Asian residents44.5 59.5 -601,918,464.6 Median age for Native Hawaiian / Pacific Islander residents-513,131,312.6 -508,717,948.2 12.5 Median age for Other race residents10.4 27.0 37.4 Median age for Two or more races residents35.7 46.6 48.0 Median age for White alone residents47.5 50.0 30.1 Median age for Hispanic or Latino residents31.8 27.3
Owner/renter occupied households by race in Gardner
House owners and renters - White residents 4,498 57.1% Owner occupied3,378 42.9% Renter occupiedHouse owners and renters - Black or African American residents 85 85.7% Owner occupied14 14.3% Renter occupiedHouse owners and renters - Asian residents 125 42.3% Owner occupied171 57.7% Renter occupiedHouse owners and renters - Other race residents 139 61.9% Owner occupied85 38.1% Renter occupiedHouse owners and renters - Two or more races residents 171 35.2% Owner occupied315 64.8% Renter occupiedHouse owners and renters - White alone residents 4,487 55.9% Owner occupied3,542 44.1% Renter occupiedHouse owners and renters - Hispanic or Latino residents 273 56.1% Owner occupied213 43.9% Renter occupied
Language usage in Gardner
English speakers - Total 87.4% of residents of Gardner speak English at home.
5.2% of residents speak Spanish at home 482 46.5% Speak English very well555 53.5% Speak English less than very well7.0% of residents speak other language at home 1,161 82.6% Speak English very well244 17.4% Speak English less than very well
English speakers - Born in the United States 95.1% of residents of Gardner speak English at home.
2.0% of residents speak Spanish at home 53 100.0% Speak English very well2.7% of residents speak other language at home 70 100.0% Speak English very well
English speakers - Native, born elsewhere 42.3% of residents of Gardner speak English at home.
47.4% of residents speak Spanish at home 162 51.4% Speak English very well153 48.6% Speak English less than very well9.0% of residents speak other language at home 60 100.0% Speak English very well
English speakers - Foreign-born 18.2% of residents of Gardner speak English at home.
19.0% of residents speak Spanish at home 82 23.0% Speak English very well275 77.0% Speak English less than very well60.0% of residents speak other language at home 923 81.9% Speak English very well204 18.1% Speak English less than very well
White (Caucasian) - Speak only English Native:
100.0% (15,728)Foreign-born:
24.6% (200)
White (Caucasian) - Speak another language Native:
1.3% (200)Foreign-born:
75.0% (610)
Black or African American - Speak only English Native:
83.3% (428)Foreign-born:
49.9% (7)
Black or African American - Speak another language Native:
16.1% (83)Foreign-born:
47.9% (7)
Asian - Speak only English Native:
80.1% (78)Foreign-born:
15.2% (81)
Asian - Speak another language Native:
16.8% (16)Foreign-born:
83.2% (442)
Other race - Speak another language Native:
78.0% (436)Foreign-born:
95.7% (23)
Two or more races - Speak another language Native:
25.5% (270)Foreign-born:
100.0% (385)
White alone - Speak only English Native:
99.0% (15,587)Foreign-born:
23.6% (196)
White alone - Speak another language Native:
1.2% (185)Foreign-born:
76.1% (634)
Hispanic or Latino - Speak only English Native:
46.1% (571)Foreign-born:
4.1% (15)
Hispanic or Latino - Speak another language Native:
53.7% (665)Foreign-born:
95.1% (342)
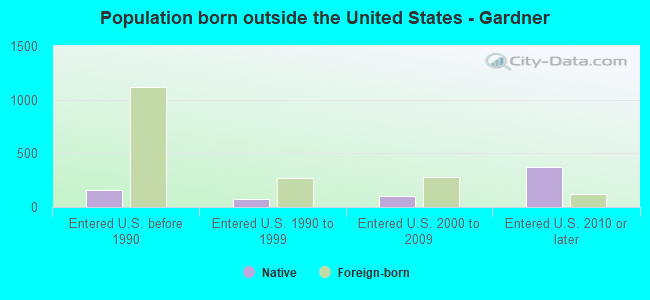
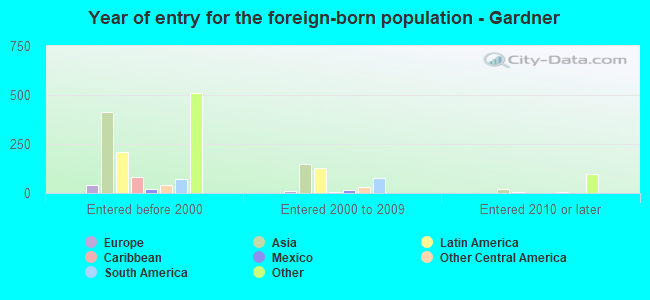
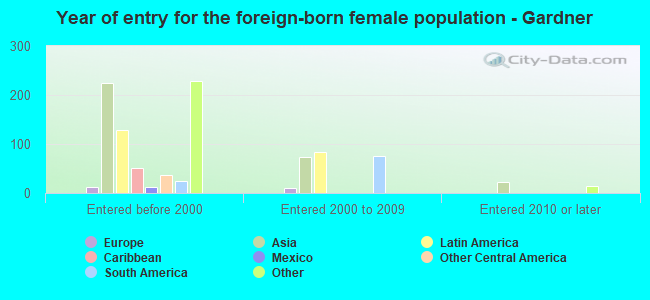
Foreign-born residents in Gardner 1,868 residents are foreign born (3.6% North America , 2.7% Asia , 1.5% Latin America ).
This city:
8.8%Massachusetts:
17.6%
Marital status for residents in Gardner Marital status - White (Caucasian) population 15 years and over
Males 38.4% Never married44.9% Now married1.9% Separated3.2% Widowed11.7% DivorcedFemales 28.3% Never married46.4% Now married0.9% Separated13.0% Widowed11.4% DivorcedWomen who gave birth in the past 12 months Now married:
30.0% (61)Unmarried:
70.0% (143)
Women who did not give birth in the past 12 months Now married:
37.2% (1,139)Unmarried:
62.8% (1,922)
Marital status - Black or African American population 15 years and over
Males 69.3% Never married17.6% Now married3.4% Separated5.4% Widowed4.2% DivorcedFemales 65.4% Never married4.4% Now married22.0% Separated0.0% Widowed8.2% DivorcedWomen who did not give birth in the past 12 months Now married:
25.2% (36)Unmarried:
74.8% (107)
Marital status - American Indian / Alaska Native population 15 years and over
Males 62.5% Never married0.0% Now married0.0% Separated0.0% Widowed37.5% DivorcedFemales 100.0% Never married0.0% Now married0.0% Separated0.0% Widowed0.0% DivorcedWomen who did not give birth in the past 12 months Now married:
0.0% (0)Unmarried:
100.0% (17)
Marital status - Asian population 15 years and over
Males 30.2% Never married35.7% Now married0.0% Separated0.0% Widowed34.1% DivorcedFemales 5.9% Never married65.2% Now married0.0% Separated28.9% Widowed0.0% DivorcedWomen who did not give birth in the past 12 months Now married:
80.0% (67)Unmarried:
20.0% (17)
Marital status - Other race population 15 years and over
Males 24.4% Never married75.6% Now married0.0% Separated0.0% Widowed0.0% DivorcedFemales 27.6% Never married66.2% Now married0.0% Separated0.0% Widowed6.2% DivorcedWomen who gave birth in the past 12 months Now married:
100.0% (46)Unmarried:
0.0% (0)
Women who did not give birth in the past 12 months Now married:
49.0% (59)Unmarried:
51.0% (61)
Marital status - Two or more races population 15 years and over
Males 59.2% Never married31.6% Now married0.9% Separated0.0% Widowed8.2% DivorcedFemales 28.0% Never married22.4% Now married30.7% Separated0.0% Widowed18.9% DivorcedWomen who gave birth in the past 12 months Now married:
100.0% (15)Unmarried:
0.0% (0)
Women who did not give birth in the past 12 months Now married:
47.2% (160)Unmarried:
52.8% (179)
Marital status - White alone, not Hispanic / Latino population 15 years and over
Males 37.9% Never married45.1% Now married1.9% Separated3.3% Widowed11.8% DivorcedFemales 28.1% Never married46.2% Now married1.0% Separated13.3% Widowed11.5% DivorcedWomen who gave birth in the past 12 months Now married:
30.0% (63)Unmarried:
70.0% (148)
Women who did not give birth in the past 12 months Now married:
36.7% (1,111)Unmarried:
63.3% (1,916)
Marital status - Hispanic or Latino population 15 years and over
Males 55.6% Never married36.3% Now married0.7% Separated0.0% Widowed7.5% DivorcedFemales 35.3% Never married46.4% Now married8.8% Separated0.0% Widowed9.4% DivorcedWomen who gave birth in the past 12 months Now married:
100.0% (38)Unmarried:
0.0% (0)
Women who did not give birth in the past 12 months Now married:
42.9% (185)Unmarried:
57.1% (245)
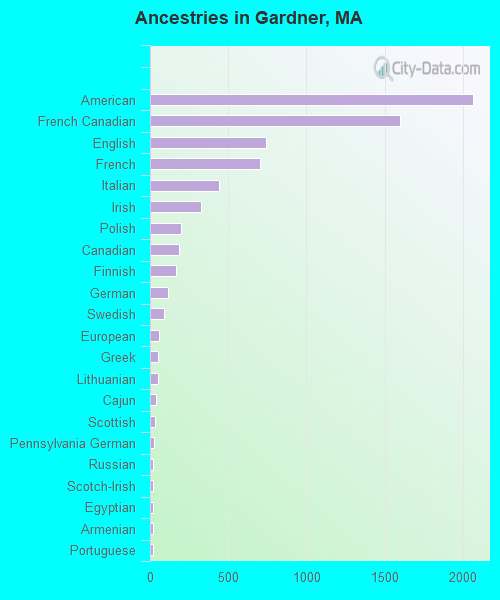
Ancestries in Gardner
2,064 21.4% American1,596 16.6% French Canadian740 7.7% English701 7.3% French441 4.6% Italian326 3.4% Irish198 2.1% Polish185 1.9% Canadian164 1.7% Finnish115 1.2% German87 0.9% Swedish60 0.6% European54 0.6% Greek54 0.6% Lithuanian41 0.4% Cajun29 0.3% Scottish23 0.2% Pennsylvania German22 0.2% Russian21 0.2% Scotch-Irish19 0.2% Egyptian19 0.2% Armenian19 0.2% Portuguese14 0.1% Ukrainian13 0.1% British11 0.1% Lebanese10 0.1% Trinidadian and Tobagonian9 0.09% Cape Verdean6 0.06% Eastern European4 0.04% African4 0.04% Haitian
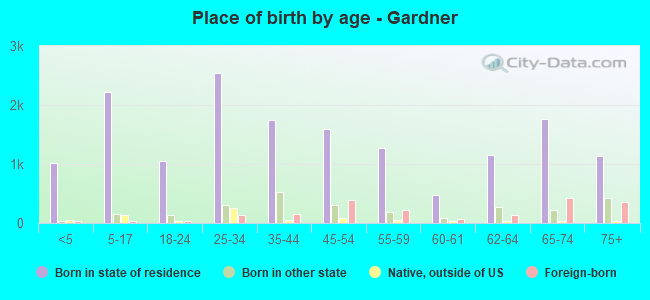
Children Nativity (place of birth) in Gardner
Children under 6 years - Living with two parents Both parents native 362 99.9% Native0 0.1% Foreign-bornBoth parents foreign-born 113 83.8% Native22 16.2% Foreign-bornOne native, one foreign-born parent 33 100.0% NativeChildren under 6 years - Living with one parent Native parent 431 100.0% NativeForeign-born parent 35 100.0% NativeChildren 6 to 17 years - Living with two parents Both parents native 941 99.9% Native1 0.1% Foreign-bornBoth parents foreign-born 58 77.2% Native17 22.8% Foreign-bornOne native, one foreign-born parent 72 100.0% NativeChildren 6 to 17 years - Living with one parent Native parent 1,022 100.0% NativeForeign-born parent 184 51.0% Native177 49.0% Foreign-born
Grandparents responsible for own grandchildren in Gardner
Grandparents (30 to 59 years) White / Caucasian 81 56.7% Responsible for grandchildren62 43.3% Not responsible for grandchildrenWhite alone, not Hispanic / Latino 57 47.1% Responsible for grandchildren64 52.9% Not responsible for grandchildrenGrandparents (60 years and over) White / Caucasian 127 50.1% Responsible for grandchildren126 49.9% Not responsible for grandchildrenWhite alone, not Hispanic / Latino 136 50.8% Responsible for grandchildren132 49.2% Not responsible for grandchildren