Races in Gardner, Kansas (KS) Detailed Stats
Data:
Races - White alone (%)
Races - White alone (% change since 2000)
Races - Black alone (%)
Races - Black alone (% change since 2000)
Races - American Indian alone (%)
Races - American Indian alone (% change since 2000)
Races - Asian alone (%)
Races - Asian alone (% change since 2000)
Races - Hispanic (%)
Races - Hispanic (% change since 2000)
Races - Native Hawaiian and Other Pacific Islander alone (%)
Races - Native Hawaiian and Other Pacific Islander alone (% change since 2000)
Races - Two or more races(%)
Races - Two or more races(% change since 2000)
Races - Other race alone (%)
Races - Other race alone (% change since 2000)
Racial diversity
Place of birth - Born in state of residence (%)
Place of birth - Born in state of residence (%) - White
Place of birth - Born in state of residence (%) - Black or African American
Place of birth - Born in state of residence (%) - Asian
Place of birth - Born in state of residence (%) - Hispanic or Latino
Place of birth - Born in state of residence (%) - American Indian and Alaska Native
Place of birth - Born in state of residence (%) - Multirace
Place of birth - Born in state of residence (%) - Other Race
Place of birth - Born in other state (%)
Place of birth - Born in other state (%) - White
Place of birth - Born in other state (%) - Black or African American
Place of birth - Born in other state (%) - Asian
Place of birth - Born in other state (%) - Hispanic or Latino
Place of birth - Born in other state (%) - American Indian and Alaska Native
Place of birth - Born in other state (%) - Multirace
Place of birth - Born in other state (%) - Other Race
Place of birth - Native, outside of US (%)
Place of birth - Native, outside of US (%) - White
Place of birth - Native, outside of US (%) - Black or African American
Place of birth - Native, outside of US (%) - Asian
Place of birth - Native, outside of US (%) - Hispanic or Latino
Place of birth - Native, outside of US (%) - American Indian and Alaska Native
Place of birth - Native, outside of US (%) - Multirace
Place of birth - Native, outside of US (%) - Other Race
Place of birth - Foreign born (%)
Place of birth - Foreign born (%) - White
Place of birth - Foreign born (%) - Black or African American
Place of birth - Foreign born (%) - Asian
Place of birth - Foreign born (%) - Hispanic or Latino
Place of birth - Foreign born (%) - American Indian and Alaska Native
Place of birth - Foreign born (%) - Multirace
Place of birth - Foreign born (%) - Other Race
Residents speaking English at home (%)
Residents speaking English at home - Born in the United States (%)
Residents speaking English at home - Native, born elsewhere (%)
Residents speaking English at home - Foreign born (%)
Residents speaking Spanish at home (%)
Residents speaking Spanish at home - Born in the United States (%)
Residents speaking Spanish at home - Native, born elsewhere (%)
Residents speaking Spanish at home - Foreign born (%)
Residents speaking other language at home (%)
Residents speaking other language at home - Born in the United States (%)
Residents speaking other language at home - Native, born elsewhere (%)
Residents speaking other language at home - Foreign born (%)
Marital status - Never married (%)
Marital status - Now married (%)
Marital status - Separated (%)
Marital status - Widowed (%)
Marital status - Divorced (%)
Ancestries Reported - Arab (%)
Ancestries Reported - Czech (%)
Ancestries Reported - Danish (%)
Ancestries Reported - Dutch (%)
Ancestries Reported - English (%)
Ancestries Reported - French (%)
Ancestries Reported - French Canadian (%)
Ancestries Reported - German (%)
Ancestries Reported - Greek (%)
Ancestries Reported - Hungarian (%)
Ancestries Reported - Irish (%)
Ancestries Reported - Italian (%)
Ancestries Reported - Lithuanian (%)
Ancestries Reported - Norwegian (%)
Ancestries Reported - Polish (%)
Ancestries Reported - Portuguese (%)
Ancestries Reported - Russian (%)
Ancestries Reported - Scotch-Irish (%)
Ancestries Reported - Scottish (%)
Ancestries Reported - Slovak (%)
Ancestries Reported - Subsaharan African (%)
Ancestries Reported - Swedish (%)
Ancestries Reported - Swiss (%)
Ancestries Reported - Ukrainian (%)
Ancestries Reported - United States (%)
Ancestries Reported - Welsh (%)
Ancestries Reported - West Indian (%)
Ancestries Reported - Other (%)
Geographical mobility - Same house 1 year ago (%)
Geographical mobility - Same house 1 year ago (%) - White
Geographical mobility - Same house 1 year ago (%) - Black or African American
Geographical mobility - Same house 1 year ago (%) - Asian
Geographical mobility - Same house 1 year ago (%) - Hispanic or Latino
Geographical mobility - Same house 1 year ago (%) - American Indian and Alaska Native
Geographical mobility - Same house 1 year ago (%) - Multirace
Geographical mobility - Same house 1 year ago (%) - Other Race
Geographical mobility - Moved within same county (%)
Geographical mobility - Moved within same county (%) - White
Geographical mobility - Moved within same county (%) - Black or African American
Geographical mobility - Moved within same county (%) - Asian
Geographical mobility - Moved within same county (%) - Hispanic or Latino
Geographical mobility - Moved within same county (%) - American Indian and Alaska Native
Geographical mobility - Moved within same county (%) - Multirace
Geographical mobility - Moved within same county (%) - Other Race
Geographical mobility - Moved from different county within same state (%)
Geographical mobility - Moved from different county within same state (%) - White
Geographical mobility - Moved from different county within same state (%) - Black or African American
Geographical mobility - Moved from different county within same state (%) - Asian
Geographical mobility - Moved from different county within same state (%) - Hispanic or Latino
Geographical mobility - Moved from different county within same state (%) - American Indian and Alaska Native
Geographical mobility - Moved from different county within same state (%) - Multirace
Geographical mobility - Moved from different county within same state (%) - Other Race
Geographical mobility - Moved from different state (%)
Geographical mobility - Moved from different state (%) - White
Geographical mobility - Moved from different state (%) - Black or African American
Geographical mobility - Moved from different state (%) - Asian
Geographical mobility - Moved from different state (%) - Hispanic or Latino
Geographical mobility - Moved from different state (%) - American Indian and Alaska Native
Geographical mobility - Moved from different state (%) - Multirace
Geographical mobility - Moved from different state (%) - Other Race
Geographical mobility - Moved from abroad (%)
Geographical mobility - Moved from abroad (%) - White
Geographical mobility - Moved from abroad (%) - Black or African American
Geographical mobility - Moved from abroad (%) - Asian
Geographical mobility - Moved from abroad (%) - Hispanic or Latino
Geographical mobility - Moved from abroad (%) - American Indian and Alaska Native
Geographical mobility - Moved from abroad (%) - Multirace
Geographical mobility - Moved from abroad (%) - Other Race
Place of birth for the foreign-born population - Ireland (%)
Place of birth for the foreign-born population - Denmark (%)
Place of birth for the foreign-born population - Norway (%)
Place of birth for the foreign-born population - Sweden (%)
Place of birth for the foreign-born population - United Kingdom (%)
Place of birth for the foreign-born population - England (%)
Place of birth for the foreign-born population - Scotland (%)
Place of birth for the foreign-born population - Other Northern Europe (%)
Place of birth for the foreign-born population - Austria (%)
Place of birth for the foreign-born population - Belgium (%)
Place of birth for the foreign-born population - France (%)
Place of birth for the foreign-born population - Germany (%)
Place of birth for the foreign-born population - Netherlands (%)
Place of birth for the foreign-born population - Switzerland (%)
Place of birth for the foreign-born population - Other Western Europe (%)
Place of birth for the foreign-born population - Greece (%)
Place of birth for the foreign-born population - Italy (%)
Place of birth for the foreign-born population - Portugal (%)
Place of birth for the foreign-born population - Spain (%)
Place of birth for the foreign-born population - Other Southern Europe (%)
Place of birth for the foreign-born population - Albania (%)
Place of birth for the foreign-born population - Belarus (%)
Place of birth for the foreign-born population - Bosnia and Herzegovina (%)
Place of birth for the foreign-born population - Bulgaria (%)
Place of birth for the foreign-born population - Croatia (%)
Place of birth for the foreign-born population - Czechoslovakia (%)
Place of birth for the foreign-born population - Hungary (%)
Place of birth for the foreign-born population - Latvia (%)
Place of birth for the foreign-born population - Lithuania (%)
Place of birth for the foreign-born population - North Macedonia (Macedonia) (%)
Place of birth for the foreign-born population - Moldova (%)
Place of birth for the foreign-born population - Poland (%)
Place of birth for the foreign-born population - Romania (%)
Place of birth for the foreign-born population - Russia (%)
Place of birth for the foreign-born population - Serbia (%)
Place of birth for the foreign-born population - Ukraine (%)
Place of birth for the foreign-born population - Other Eastern Europe (%)
Place of birth for the foreign-born population - China (%)
Place of birth for the foreign-born population - Hong Kong (%)
Place of birth for the foreign-born population - Taiwan (%)
Place of birth for the foreign-born population - Japan (%)
Place of birth for the foreign-born population - Korea (%)
Place of birth for the foreign-born population - Other Eastern Asia (%)
Place of birth for the foreign-born population - Afghanistan (%)
Place of birth for the foreign-born population - Bangladesh (%)
Place of birth for the foreign-born population - India (%)
Place of birth for the foreign-born population - Iran (%)
Place of birth for the foreign-born population - Kazakhstan (%)
Place of birth for the foreign-born population - Nepal (%)
Place of birth for the foreign-born population - Pakistan (%)
Place of birth for the foreign-born population - Sri Lanka (%)
Place of birth for the foreign-born population - Uzbekistan (%)
Place of birth for the foreign-born population - Other South Central Asia (%)
Place of birth for the foreign-born population - Burma (%)
Place of birth for the foreign-born population - Cambodia (%)
Place of birth for the foreign-born population - Indonesia (%)
Place of birth for the foreign-born population - Laos (%)
Place of birth for the foreign-born population - Malaysia (%)
Place of birth for the foreign-born population - Philippines (%)
Place of birth for the foreign-born population - Singapore (%)
Place of birth for the foreign-born population - Thailand (%)
Place of birth for the foreign-born population - Vietnam (%)
Place of birth for the foreign-born population - Other South Eastern Asia (%)
Place of birth for the foreign-born population - Armenia (%)
Place of birth for the foreign-born population - Iraq (%)
Place of birth for the foreign-born population - Israel (%)
Place of birth for the foreign-born population - Jordan (%)
Place of birth for the foreign-born population - Kuwait (%)
Place of birth for the foreign-born population - Lebanon (%)
Place of birth for the foreign-born population - Saudi Arabia (%)
Place of birth for the foreign-born population - Syria (%)
Place of birth for the foreign-born population - Turkey (%)
Place of birth for the foreign-born population - Yemen (%)
Place of birth for the foreign-born population - Other Western Asia (%)
Place of birth for the foreign-born population - Eritrea (%)
Place of birth for the foreign-born population - Ethiopia (%)
Place of birth for the foreign-born population - Kenya (%)
Place of birth for the foreign-born population - Somalia (%)
Place of birth for the foreign-born population - Uganda (%)
Place of birth for the foreign-born population - Zimbabwe (%)
Place of birth for the foreign-born population - Other Eastern Africa (%)
Place of birth for the foreign-born population - Cameroon (%)
Place of birth for the foreign-born population - Congo (%)
Place of birth for the foreign-born population - Democratic Republic of Congo (Zaire) (%)
Place of birth for the foreign-born population - Other Middle Africa (%)
Place of birth for the foreign-born population - Egypt (%)
Place of birth for the foreign-born population - Morocco (%)
Place of birth for the foreign-born population - Sudan (%)
Place of birth for the foreign-born population - Other Northern Africa (%)
Place of birth for the foreign-born population - South Africa (%)
Place of birth for the foreign-born population - Other Southern Africa (%)
Place of birth for the foreign-born population - Cabo Verde (%)
Place of birth for the foreign-born population - Ghana (%)
Place of birth for the foreign-born population - Liberia (%)
Place of birth for the foreign-born population - Nigeria (%)
Place of birth for the foreign-born population - Senegal (%)
Place of birth for the foreign-born population - Sierra Leone (%)
Place of birth for the foreign-born population - Other Western Africa (%)
Place of birth for the foreign-born population - Australia (%)
Place of birth for the foreign-born population - New Zealand (%)
Place of birth for the foreign-born population - Fiji (%)
Place of birth for the foreign-born population - Micronesia (%)
Place of birth for the foreign-born population - Bahamas (%)
Place of birth for the foreign-born population - Barbados (%)
Place of birth for the foreign-born population - Cuba (%)
Place of birth for the foreign-born population - Dominica (%)
Place of birth for the foreign-born population - Dominican Republic (%)
Place of birth for the foreign-born population - Grenada (%)
Place of birth for the foreign-born population - Haiti (%)
Place of birth for the foreign-born population - Jamaica (%)
Place of birth for the foreign-born population - St. Vincent and the Grenadines (%)
Place of birth for the foreign-born population - Trinidad and Tobago (%)
Place of birth for the foreign-born population - West Indies (%)
Place of birth for the foreign-born population - Other Caribbean (%)
Place of birth for the foreign-born population - Belize (%)
Place of birth for the foreign-born population - Costa Rica (%)
Place of birth for the foreign-born population - El Salvador (%)
Place of birth for the foreign-born population - Guatemala (%)
Place of birth for the foreign-born population - Honduras (%)
Place of birth for the foreign-born population - Mexico (%)
Place of birth for the foreign-born population - Nicaragua (%)
Place of birth for the foreign-born population - Panama (%)
Place of birth for the foreign-born population - Other Central America (%)
Place of birth for the foreign-born population - Argentina (%)
Place of birth for the foreign-born population - Bolivia (%)
Place of birth for the foreign-born population - Brazil (%)
Place of birth for the foreign-born population - Chile (%)
Place of birth for the foreign-born population - Colombia (%)
Place of birth for the foreign-born population - Ecuador (%)
Place of birth for the foreign-born population - Guyana (%)
Place of birth for the foreign-born population - Peru (%)
Place of birth for the foreign-born population - Uruguay (%)
Place of birth for the foreign-born population - Venezuela (%)
Place of birth for the foreign-born population - Other South America (%)
Place of birth for the foreign-born population - Canada (%)
Place of birth for the foreign-born population - Other Northern America (%)
Place of birth for the foreign-born population - Other (%)
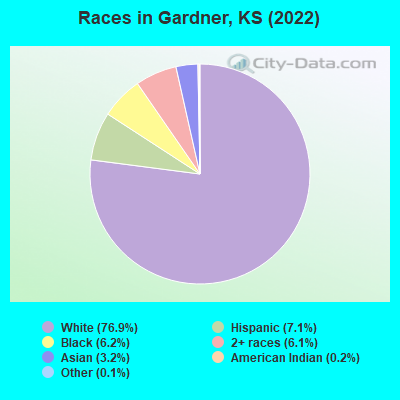
According to 2022 data, the most numerous races in Gardner, KS are White alone (18,312 residents), Hispanic (1,693 residents), and Black alone (1,482 residents). 91.5% of Gardner residents speak English at home. 4.8% of Gardner, KS residents are foreign-born (2.1% born in Latin America, 1.2% born in Asia, 1.2% born in Africa), which is 44.6% less than the foreign-born rate of 7.0% across the entire state of Kansas.
Race distribution in Gardner
2000 2022
2,233,997 83.1% White alone 188,252 7.0% Hispanic 151,407 5.6% Black alone 46,301 1.7% Asian alone 42,508 1.6% Two or more races 22,322 0.8% American Indian alone 2,477 0.09% Other race alone 1,154 0.04% Native Hawaiian and Other
2,147,943 73.1% White alone 381,746 13.0% Hispanic 147,666 5.0% Black alone 145,362 4.9% Two or more races 85,085 2.9% Asian alone 13,263 0.5% Other race alone 12,065 0.4% American Indian alone 4,020 0.1% Native Hawaiian and Other
Income and house value in Gardner Median household income in 2022 $85,985 White non-Hispanic householders$109,438 Black householders$97,096 Asian householders$94,091 Some other race householders$98,984 Two or more races householders$85,008 Hispanic or Latino race householdersMedian 2022 house value $294,991 White Non-Hispanic householders$346,086 Black or African American householders$346,086 American Indian or Alaska Native householders $471,936 Asian householders$220,236 Two or more races householders$253,209 Hispanic or Latino householders
Median age by race in Gardner
33.2 Median age for White residents32.4 33.9 32.5 Median age for Black or African American residents41.7 17.4 30.1 Median age for American Indian / Alaska Native residents47.5 28.5 18.5 Median age for Asian residents23.4 17.0 -1,068,376,067.3 Median age for Native Hawaiian / Pacific Islander residents-669,240,668.6 -641,269,840.6 46.6 Median age for Other race residents28.9 44.9 13.3 Median age for Two or more races residents18.5 12.0 32.8 Median age for White alone residents31.9 34.0 36.0 Median age for Hispanic or Latino residents28.8 39.8
Owner/renter occupied households by race in Gardner
House owners and renters - White residents 4,752 68.9% Owner occupied2,142 31.1% Renter occupiedHouse owners and renters - Black or African American residents 281 67.5% Owner occupied135 32.5% Renter occupiedHouse owners and renters - American Indian / Alaska Native residents 15 55.0% Owner occupied12 45.0% Renter occupiedHouse owners and renters - Asian residents 100 61.2% Owner occupied63 38.8% Renter occupiedHouse owners and renters - Other race residents 105 62.5% Owner occupied63 37.5% Renter occupiedHouse owners and renters - Two or more races residents 258 77.0% Owner occupied77 23.0% Renter occupiedHouse owners and renters - White alone residents 4,712 69.3% Owner occupied2,092 30.7% Renter occupiedHouse owners and renters - Hispanic or Latino residents 242 58.3% Owner occupied173 41.7% Renter occupied
Language usage in Gardner
English speakers - Total 91.5% of residents of Gardner speak English at home.
4.3% of residents speak Spanish at home 549 59.0% Speak English very well382 41.0% Speak English less than very well4.2% of residents speak other language at home 705 78.2% Speak English very well197 21.8% Speak English less than very well
English speakers - Born in the United States 96.2% of residents of Gardner speak English at home.
2.2% of residents speak Spanish at home 186 93.0% Speak English very well14 7.0% Speak English less than very well1.6% of residents speak other language at home 142 93.4% Speak English very well10 6.6% Speak English less than very well
English speakers - Native, born elsewhere 52.8% of residents of Gardner speak English at home.
15.2% of residents speak Spanish at home 44 81.5% Speak English very well10 18.5% Speak English less than very well31.7% of residents speak other language at home 113 100.0% Speak English very well
English speakers - Foreign-born 9.1% of residents of Gardner speak English at home.
40.9% of residents speak Spanish at home 90 20.2% Speak English very well355 79.8% Speak English less than very well44.7% of residents speak other language at home 297 61.0% Speak English very well190 39.0% Speak English less than very well
White (Caucasian) - Speak only English Native:
98.3% (16,735)Foreign-born:
16.6% (32)
White (Caucasian) - Speak another language Native:
1.8% (299)Foreign-born:
76.7% (147)
Black or African American - Speak only English Native:
97.6% (1,052)Foreign-born:
11.1% (27)
Black or African American - Speak another language Native:
2.3% (25)Foreign-born:
88.9% (216)
Asian - Speak only English Native:
61.0% (333)Foreign-born:
5.6% (14)
Asian - Speak another language Native:
33.9% (185)Foreign-born:
95.0% (244)
Other race - Speak another language Native:
52.0% (244)Foreign-born:
86.9% (273)
Two or more races - Speak another language Native:
3.2% (47)Foreign-born:
100.0% (61)
White alone - Speak only English Native:
98.5% (16,505)Foreign-born:
41.9% (32)
White alone - Speak another language Native:
1.5% (252)Foreign-born:
58.1% (45)
Hispanic or Latino - Speak another language Native:
31.9% (352)Foreign-born:
97.8% (508)
Foreign-born residents in Gardner 1,153 residents are foreign born (2.1% Latin America , 1.2% Asia , 1.2% Africa ).
This city:
4.8%Kansas:
7.1%
Marital status for residents in Gardner Marital status - White (Caucasian) population 15 years and over
Males 30.6% Never married58.0% Now married0.6% Separated1.7% Widowed9.1% DivorcedFemales 23.5% Never married59.2% Now married0.7% Separated4.4% Widowed12.2% DivorcedWomen who gave birth in the past 12 months Now married:
56.1% (160)Unmarried:
43.9% (125)
Women who did not give birth in the past 12 months Now married:
61.0% (2,663)Unmarried:
39.0% (1,703)
Marital status - Black or African American population 15 years and over
Males 5.5% Never married80.5% Now married0.0% Separated0.0% Widowed14.1% DivorcedFemales 33.1% Never married56.4% Now married6.4% Separated0.0% Widowed4.0% DivorcedWomen who gave birth in the past 12 months Now married:
68.0% (19)Unmarried:
32.0% (9)
Women who did not give birth in the past 12 months Now married:
57.8% (222)Unmarried:
42.2% (162)
Marital status - American Indian / Alaska Native population 15 years and over
Males 62.5% Never married37.5% Now married0.0% Separated0.0% Widowed0.0% DivorcedFemales 60.3% Never married17.6% Now married0.0% Separated0.0% Widowed22.1% DivorcedWomen who did not give birth in the past 12 months Now married:
10.9% (6)Unmarried:
89.1% (47)
Marital status - Asian population 15 years and over
Males 44.3% Never married50.6% Now married0.0% Separated0.0% Widowed5.1% DivorcedFemales 48.2% Never married42.8% Now married0.0% Separated0.0% Widowed9.1% DivorcedWomen who did not give birth in the past 12 months Now married:
40.8% (110)Unmarried:
59.2% (160)
Marital status - Other race population 15 years and over
Males 56.8% Never married43.2% Now married0.0% Separated0.0% Widowed0.0% DivorcedFemales 21.6% Never married51.5% Now married0.0% Separated10.8% Widowed16.0% DivorcedWomen who did not give birth in the past 12 months Now married:
67.3% (153)Unmarried:
32.7% (74)
Marital status - Two or more races population 15 years and over
Males 46.1% Never married42.2% Now married0.0% Separated0.0% Widowed11.7% DivorcedFemales 25.2% Never married65.5% Now married2.9% Separated0.0% Widowed6.5% DivorcedWomen who gave birth in the past 12 months Now married:
100.0% (38)Unmarried:
0.0% (0)
Women who did not give birth in the past 12 months Now married:
55.0% (97)Unmarried:
45.0% (79)
Marital status - White alone, not Hispanic / Latino population 15 years and over
Males 30.1% Never married58.1% Now married0.6% Separated1.8% Widowed9.4% DivorcedFemales 22.7% Never married59.5% Now married0.7% Separated4.6% Widowed12.5% DivorcedWomen who gave birth in the past 12 months Now married:
56.1% (164)Unmarried:
43.9% (128)
Women who did not give birth in the past 12 months Now married:
61.8% (2,669)Unmarried:
38.2% (1,647)
Marital status - Hispanic or Latino population 15 years and over
Males 54.4% Never married43.0% Now married0.0% Separated0.0% Widowed2.6% DivorcedFemales 33.8% Never married52.1% Now married0.0% Separated4.7% Widowed9.4% DivorcedWomen who did not give birth in the past 12 months Now married:
52.9% (196)Unmarried:
47.1% (175)
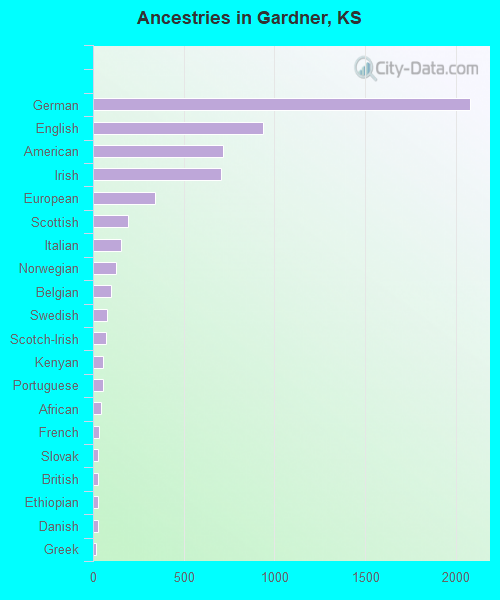
Ancestries in Gardner
2,078 23.6% German939 10.7% English719 8.2% American707 8.0% Irish344 3.9% European192 2.2% Scottish157 1.8% Italian125 1.4% Norwegian97 1.1% Belgian79 0.9% Swedish73 0.8% Scotch-Irish55 0.6% Kenyan54 0.6% Portuguese42 0.5% African31 0.4% French30 0.3% Slovak27 0.3% British27 0.3% Ethiopian26 0.3% Danish19 0.2% Greek18 0.2% Czech15 0.2% Welsh15 0.2% Polish14 0.2% Russian13 0.1% Hungarian12 0.1% Cajun12 0.1% Dutch11 0.1% Senegalese10 0.1% Croatian10 0.1% Austrian8 0.09% Northern European7 0.08% Czechoslovakian6 0.07% Turkish5 0.06% Canadian4 0.05% Eastern European
Geographical mobility in Gardner Same house 1 year ago 16,120 87.5% White (Caucasian)1,303 87.3% Black or African American105 89.5% American Indian / Alaska Native709 92.5% Asian741 99.1% Other race1,957 96.2% Two or more races15,789 87.2% White alone, not Hispanic / Latino1,536 90.8% Hispanic or LatinoMoved within same county 1,228 6.7% White / Caucasian51 3.4% Black or African American35 4.6% Asian33 4.5% Other race126 6.2% Two or more races1,222 6.7% White alone, not Hispanic / Latino184 10.9% Hispanic or LatinoMoved within same state 227 1.2% White / Caucasian139 9.3% Black or African American12 9.9% American Indian / Alaska Native8 0.4% Two or more races225 1.2% White alone, not Hispanic / LatinoMoved from different state 852 4.6% White / Caucasian42 2.8% Black or African American7 0.9% Asian871 4.8% White alone, not Hispanic / LatinoMoved from abroad 7 1.0% Other race11 0.6% Hispanic or Latino
Children Nativity (place of birth) in Gardner
Children under 6 years - Living with two parents Both parents native 1,539 99.8% Native3 0.2% Foreign-bornBoth parents foreign-born 42 59.7% Native28 40.3% Foreign-bornOne native, one foreign-born parent 64 100.0% NativeChildren under 6 years - Living with one parent Native parent 447 100.0% NativeForeign-born parent 100 100.0% NativeChildren 6 to 17 years - Living with two parents Both parents native 3,097 99.9% Native4 0.1% Foreign-bornBoth parents foreign-born 362 89.5% Native42 10.5% Foreign-bornOne native, one foreign-born parent 156 100.0% NativeChildren 6 to 17 years - Living with one parent Native parent 879 100.0% NativeForeign-born parent 8 55.0% Native7 45.0% Foreign-born
Grandparents responsible for own grandchildren in Gardner
Grandparents (30 to 59 years) White / Caucasian 30 50.6% Responsible for grandchildren29 49.4% Not responsible for grandchildrenAmerican Indian / Alaska Native 14 100.0% Not responsible for grandchildrenOther race 54 100.0% Not responsible for grandchildrenTwo or more races 10 100.0% Not responsible for grandchildrenWhite alone, not Hispanic / Latino 31 49.4% Responsible for grandchildren32 50.6% Not responsible for grandchildrenHispanic or Latino 26 100.0% Not responsible for grandchildrenGrandparents (60 years and over) White / Caucasian 31 24.6% Responsible for grandchildren94 75.4% Not responsible for grandchildrenOther race 33 100.0% Not responsible for grandchildrenWhite alone, not Hispanic / Latino 31 23.2% Responsible for grandchildren101 76.8% Not responsible for grandchildrenHispanic or Latino 23 100.0% Not responsible for grandchildren