Races in Gahanna, Ohio (OH) Detailed Stats
Data:
Races - White alone (%)
Races - White alone (% change since 2000)
Races - Black alone (%)
Races - Black alone (% change since 2000)
Races - American Indian alone (%)
Races - American Indian alone (% change since 2000)
Races - Asian alone (%)
Races - Asian alone (% change since 2000)
Races - Hispanic (%)
Races - Hispanic (% change since 2000)
Races - Native Hawaiian and Other Pacific Islander alone (%)
Races - Native Hawaiian and Other Pacific Islander alone (% change since 2000)
Races - Two or more races(%)
Races - Two or more races(% change since 2000)
Races - Other race alone (%)
Races - Other race alone (% change since 2000)
Racial diversity
Place of birth - Born in state of residence (%)
Place of birth - Born in state of residence (%) - White
Place of birth - Born in state of residence (%) - Black or African American
Place of birth - Born in state of residence (%) - Asian
Place of birth - Born in state of residence (%) - Hispanic or Latino
Place of birth - Born in state of residence (%) - American Indian and Alaska Native
Place of birth - Born in state of residence (%) - Multirace
Place of birth - Born in state of residence (%) - Other Race
Place of birth - Born in other state (%)
Place of birth - Born in other state (%) - White
Place of birth - Born in other state (%) - Black or African American
Place of birth - Born in other state (%) - Asian
Place of birth - Born in other state (%) - Hispanic or Latino
Place of birth - Born in other state (%) - American Indian and Alaska Native
Place of birth - Born in other state (%) - Multirace
Place of birth - Born in other state (%) - Other Race
Place of birth - Native, outside of US (%)
Place of birth - Native, outside of US (%) - White
Place of birth - Native, outside of US (%) - Black or African American
Place of birth - Native, outside of US (%) - Asian
Place of birth - Native, outside of US (%) - Hispanic or Latino
Place of birth - Native, outside of US (%) - American Indian and Alaska Native
Place of birth - Native, outside of US (%) - Multirace
Place of birth - Native, outside of US (%) - Other Race
Place of birth - Foreign born (%)
Place of birth - Foreign born (%) - White
Place of birth - Foreign born (%) - Black or African American
Place of birth - Foreign born (%) - Asian
Place of birth - Foreign born (%) - Hispanic or Latino
Place of birth - Foreign born (%) - American Indian and Alaska Native
Place of birth - Foreign born (%) - Multirace
Place of birth - Foreign born (%) - Other Race
Residents speaking English at home (%)
Residents speaking English at home - Born in the United States (%)
Residents speaking English at home - Native, born elsewhere (%)
Residents speaking English at home - Foreign born (%)
Residents speaking Spanish at home (%)
Residents speaking Spanish at home - Born in the United States (%)
Residents speaking Spanish at home - Native, born elsewhere (%)
Residents speaking Spanish at home - Foreign born (%)
Residents speaking other language at home (%)
Residents speaking other language at home - Born in the United States (%)
Residents speaking other language at home - Native, born elsewhere (%)
Residents speaking other language at home - Foreign born (%)
Marital status - Never married (%)
Marital status - Now married (%)
Marital status - Separated (%)
Marital status - Widowed (%)
Marital status - Divorced (%)
Ancestries Reported - Arab (%)
Ancestries Reported - Czech (%)
Ancestries Reported - Danish (%)
Ancestries Reported - Dutch (%)
Ancestries Reported - English (%)
Ancestries Reported - French (%)
Ancestries Reported - French Canadian (%)
Ancestries Reported - German (%)
Ancestries Reported - Greek (%)
Ancestries Reported - Hungarian (%)
Ancestries Reported - Irish (%)
Ancestries Reported - Italian (%)
Ancestries Reported - Lithuanian (%)
Ancestries Reported - Norwegian (%)
Ancestries Reported - Polish (%)
Ancestries Reported - Portuguese (%)
Ancestries Reported - Russian (%)
Ancestries Reported - Scotch-Irish (%)
Ancestries Reported - Scottish (%)
Ancestries Reported - Slovak (%)
Ancestries Reported - Subsaharan African (%)
Ancestries Reported - Swedish (%)
Ancestries Reported - Swiss (%)
Ancestries Reported - Ukrainian (%)
Ancestries Reported - United States (%)
Ancestries Reported - Welsh (%)
Ancestries Reported - West Indian (%)
Ancestries Reported - Other (%)
Geographical mobility - Same house 1 year ago (%)
Geographical mobility - Same house 1 year ago (%) - White
Geographical mobility - Same house 1 year ago (%) - Black or African American
Geographical mobility - Same house 1 year ago (%) - Asian
Geographical mobility - Same house 1 year ago (%) - Hispanic or Latino
Geographical mobility - Same house 1 year ago (%) - American Indian and Alaska Native
Geographical mobility - Same house 1 year ago (%) - Multirace
Geographical mobility - Same house 1 year ago (%) - Other Race
Geographical mobility - Moved within same county (%)
Geographical mobility - Moved within same county (%) - White
Geographical mobility - Moved within same county (%) - Black or African American
Geographical mobility - Moved within same county (%) - Asian
Geographical mobility - Moved within same county (%) - Hispanic or Latino
Geographical mobility - Moved within same county (%) - American Indian and Alaska Native
Geographical mobility - Moved within same county (%) - Multirace
Geographical mobility - Moved within same county (%) - Other Race
Geographical mobility - Moved from different county within same state (%)
Geographical mobility - Moved from different county within same state (%) - White
Geographical mobility - Moved from different county within same state (%) - Black or African American
Geographical mobility - Moved from different county within same state (%) - Asian
Geographical mobility - Moved from different county within same state (%) - Hispanic or Latino
Geographical mobility - Moved from different county within same state (%) - American Indian and Alaska Native
Geographical mobility - Moved from different county within same state (%) - Multirace
Geographical mobility - Moved from different county within same state (%) - Other Race
Geographical mobility - Moved from different state (%)
Geographical mobility - Moved from different state (%) - White
Geographical mobility - Moved from different state (%) - Black or African American
Geographical mobility - Moved from different state (%) - Asian
Geographical mobility - Moved from different state (%) - Hispanic or Latino
Geographical mobility - Moved from different state (%) - American Indian and Alaska Native
Geographical mobility - Moved from different state (%) - Multirace
Geographical mobility - Moved from different state (%) - Other Race
Geographical mobility - Moved from abroad (%)
Geographical mobility - Moved from abroad (%) - White
Geographical mobility - Moved from abroad (%) - Black or African American
Geographical mobility - Moved from abroad (%) - Asian
Geographical mobility - Moved from abroad (%) - Hispanic or Latino
Geographical mobility - Moved from abroad (%) - American Indian and Alaska Native
Geographical mobility - Moved from abroad (%) - Multirace
Geographical mobility - Moved from abroad (%) - Other Race
Place of birth for the foreign-born population - Ireland (%)
Place of birth for the foreign-born population - Denmark (%)
Place of birth for the foreign-born population - Norway (%)
Place of birth for the foreign-born population - Sweden (%)
Place of birth for the foreign-born population - United Kingdom (%)
Place of birth for the foreign-born population - England (%)
Place of birth for the foreign-born population - Scotland (%)
Place of birth for the foreign-born population - Other Northern Europe (%)
Place of birth for the foreign-born population - Austria (%)
Place of birth for the foreign-born population - Belgium (%)
Place of birth for the foreign-born population - France (%)
Place of birth for the foreign-born population - Germany (%)
Place of birth for the foreign-born population - Netherlands (%)
Place of birth for the foreign-born population - Switzerland (%)
Place of birth for the foreign-born population - Other Western Europe (%)
Place of birth for the foreign-born population - Greece (%)
Place of birth for the foreign-born population - Italy (%)
Place of birth for the foreign-born population - Portugal (%)
Place of birth for the foreign-born population - Spain (%)
Place of birth for the foreign-born population - Other Southern Europe (%)
Place of birth for the foreign-born population - Albania (%)
Place of birth for the foreign-born population - Belarus (%)
Place of birth for the foreign-born population - Bosnia and Herzegovina (%)
Place of birth for the foreign-born population - Bulgaria (%)
Place of birth for the foreign-born population - Croatia (%)
Place of birth for the foreign-born population - Czechoslovakia (%)
Place of birth for the foreign-born population - Hungary (%)
Place of birth for the foreign-born population - Latvia (%)
Place of birth for the foreign-born population - Lithuania (%)
Place of birth for the foreign-born population - North Macedonia (Macedonia) (%)
Place of birth for the foreign-born population - Moldova (%)
Place of birth for the foreign-born population - Poland (%)
Place of birth for the foreign-born population - Romania (%)
Place of birth for the foreign-born population - Russia (%)
Place of birth for the foreign-born population - Serbia (%)
Place of birth for the foreign-born population - Ukraine (%)
Place of birth for the foreign-born population - Other Eastern Europe (%)
Place of birth for the foreign-born population - China (%)
Place of birth for the foreign-born population - Hong Kong (%)
Place of birth for the foreign-born population - Taiwan (%)
Place of birth for the foreign-born population - Japan (%)
Place of birth for the foreign-born population - Korea (%)
Place of birth for the foreign-born population - Other Eastern Asia (%)
Place of birth for the foreign-born population - Afghanistan (%)
Place of birth for the foreign-born population - Bangladesh (%)
Place of birth for the foreign-born population - India (%)
Place of birth for the foreign-born population - Iran (%)
Place of birth for the foreign-born population - Kazakhstan (%)
Place of birth for the foreign-born population - Nepal (%)
Place of birth for the foreign-born population - Pakistan (%)
Place of birth for the foreign-born population - Sri Lanka (%)
Place of birth for the foreign-born population - Uzbekistan (%)
Place of birth for the foreign-born population - Other South Central Asia (%)
Place of birth for the foreign-born population - Burma (%)
Place of birth for the foreign-born population - Cambodia (%)
Place of birth for the foreign-born population - Indonesia (%)
Place of birth for the foreign-born population - Laos (%)
Place of birth for the foreign-born population - Malaysia (%)
Place of birth for the foreign-born population - Philippines (%)
Place of birth for the foreign-born population - Singapore (%)
Place of birth for the foreign-born population - Thailand (%)
Place of birth for the foreign-born population - Vietnam (%)
Place of birth for the foreign-born population - Other South Eastern Asia (%)
Place of birth for the foreign-born population - Armenia (%)
Place of birth for the foreign-born population - Iraq (%)
Place of birth for the foreign-born population - Israel (%)
Place of birth for the foreign-born population - Jordan (%)
Place of birth for the foreign-born population - Kuwait (%)
Place of birth for the foreign-born population - Lebanon (%)
Place of birth for the foreign-born population - Saudi Arabia (%)
Place of birth for the foreign-born population - Syria (%)
Place of birth for the foreign-born population - Turkey (%)
Place of birth for the foreign-born population - Yemen (%)
Place of birth for the foreign-born population - Other Western Asia (%)
Place of birth for the foreign-born population - Eritrea (%)
Place of birth for the foreign-born population - Ethiopia (%)
Place of birth for the foreign-born population - Kenya (%)
Place of birth for the foreign-born population - Somalia (%)
Place of birth for the foreign-born population - Uganda (%)
Place of birth for the foreign-born population - Zimbabwe (%)
Place of birth for the foreign-born population - Other Eastern Africa (%)
Place of birth for the foreign-born population - Cameroon (%)
Place of birth for the foreign-born population - Congo (%)
Place of birth for the foreign-born population - Democratic Republic of Congo (Zaire) (%)
Place of birth for the foreign-born population - Other Middle Africa (%)
Place of birth for the foreign-born population - Egypt (%)
Place of birth for the foreign-born population - Morocco (%)
Place of birth for the foreign-born population - Sudan (%)
Place of birth for the foreign-born population - Other Northern Africa (%)
Place of birth for the foreign-born population - South Africa (%)
Place of birth for the foreign-born population - Other Southern Africa (%)
Place of birth for the foreign-born population - Cabo Verde (%)
Place of birth for the foreign-born population - Ghana (%)
Place of birth for the foreign-born population - Liberia (%)
Place of birth for the foreign-born population - Nigeria (%)
Place of birth for the foreign-born population - Senegal (%)
Place of birth for the foreign-born population - Sierra Leone (%)
Place of birth for the foreign-born population - Other Western Africa (%)
Place of birth for the foreign-born population - Australia (%)
Place of birth for the foreign-born population - New Zealand (%)
Place of birth for the foreign-born population - Fiji (%)
Place of birth for the foreign-born population - Micronesia (%)
Place of birth for the foreign-born population - Bahamas (%)
Place of birth for the foreign-born population - Barbados (%)
Place of birth for the foreign-born population - Cuba (%)
Place of birth for the foreign-born population - Dominica (%)
Place of birth for the foreign-born population - Dominican Republic (%)
Place of birth for the foreign-born population - Grenada (%)
Place of birth for the foreign-born population - Haiti (%)
Place of birth for the foreign-born population - Jamaica (%)
Place of birth for the foreign-born population - St. Vincent and the Grenadines (%)
Place of birth for the foreign-born population - Trinidad and Tobago (%)
Place of birth for the foreign-born population - West Indies (%)
Place of birth for the foreign-born population - Other Caribbean (%)
Place of birth for the foreign-born population - Belize (%)
Place of birth for the foreign-born population - Costa Rica (%)
Place of birth for the foreign-born population - El Salvador (%)
Place of birth for the foreign-born population - Guatemala (%)
Place of birth for the foreign-born population - Honduras (%)
Place of birth for the foreign-born population - Mexico (%)
Place of birth for the foreign-born population - Nicaragua (%)
Place of birth for the foreign-born population - Panama (%)
Place of birth for the foreign-born population - Other Central America (%)
Place of birth for the foreign-born population - Argentina (%)
Place of birth for the foreign-born population - Bolivia (%)
Place of birth for the foreign-born population - Brazil (%)
Place of birth for the foreign-born population - Chile (%)
Place of birth for the foreign-born population - Colombia (%)
Place of birth for the foreign-born population - Ecuador (%)
Place of birth for the foreign-born population - Guyana (%)
Place of birth for the foreign-born population - Peru (%)
Place of birth for the foreign-born population - Uruguay (%)
Place of birth for the foreign-born population - Venezuela (%)
Place of birth for the foreign-born population - Other South America (%)
Place of birth for the foreign-born population - Canada (%)
Place of birth for the foreign-born population - Other Northern America (%)
Place of birth for the foreign-born population - Other (%)
Latest news about races in Gahanna, OH collected exclusively by city-data.com from local newspapers, TV, and radio stations
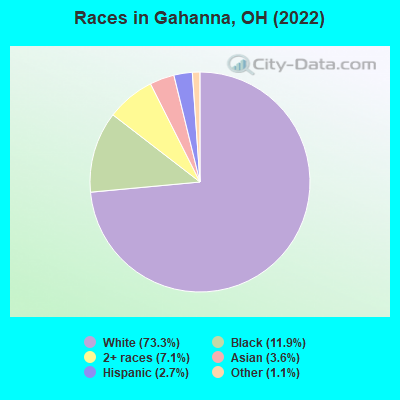
According to 2022 data, the most numerous races in Gahanna, OH are White alone (26,114 residents), Black alone (4,247 residents), and Two or more races (2,540 residents). 94.0% of Gahanna residents speak English at home. 6.3% of Gahanna, OH residents are foreign-born (2.5% born in Asia, 1.2% born in Africa, 1.0% born in Europe, 0.7% born in Oceania), which is 36.3% greater than the foreign-born rate of 4.0% across the entire state of Ohio.
Race distribution in Gahanna
2000 2022
9,538,111 84.0% White alone 1,290,662 11.4% Black alone 217,123 1.9% Hispanic 137,770 1.2% Two or more races 131,670 1.2% Asian alone 21,985 0.2% American Indian alone 13,483 0.1% Other race alone 2,336 0.02% Native Hawaiian and Other
8,948,793 76.1% White alone 1,401,403 11.9% Black alone 529,291 4.5% Two or more races 517,232 4.4% Hispanic 293,387 2.5% Asian alone 52,805 0.4% Other race alone 9,785 0.08% American Indian alone 3,362 0.03% Native Hawaiian and Other
Income and house value in Gahanna Median household income in 2022 $106,876 White non-Hispanic householders$73,777 Black householders$135,173 Asian householders$72,527 Some other race householders$103,285 Two or more races householders$63,808 Hispanic or Latino race householdersMedian 2022 house value $334,693 White Non-Hispanic householders$446,809 Black or African American householders$138,078 American Indian or Alaska Native householders $548,775 Asian householders$324,544 Some other race householders$231,547 Two or more races householders$540,986 Hispanic or Latino householders
Median age by race in Gahanna
41.9 Median age for White residents40.2 44.3 41.3 Median age for Black or African American residents37.7 44.0 -691,029,899.6 Median age for American Indian / Alaska Native residents-670,953,911.4 -732,121,211.4 31.5 Median age for Asian residents30.8 24.5 -497,206,703.4 Median age for Native Hawaiian / Pacific Islander residents-544,891,640.3 -805,394,989.6 24.1 Median age for Other race residents26.3 15.0 25.6 Median age for Two or more races residents21.4 26.6 41.6 Median age for White alone residents39.8 44.5 29.3 Median age for Hispanic or Latino residents36.9 17.2
Owner/renter occupied households by race in Gahanna
House owners and renters - White residents 8,538 76.1% Owner occupied2,685 23.9% Renter occupiedHouse owners and renters - Black or African American residents 743 40.7% Owner occupied1,081 59.3% Renter occupiedHouse owners and renters - American Indian / Alaska Native residents 8 100.0% Renter occupiedHouse owners and renters - Asian residents 163 52.9% Owner occupied145 47.1% Renter occupiedHouse owners and renters - Other race residents 85 34.8% Owner occupied160 65.2% Renter occupiedHouse owners and renters - Two or more races residents 554 68.4% Owner occupied256 31.6% Renter occupiedHouse owners and renters - White alone residents 8,565 75.8% Owner occupied2,737 24.2% Renter occupiedHouse owners and renters - Hispanic or Latino residents 116 40.5% Owner occupied171 59.5% Renter occupied
Language usage in Gahanna
English speakers - Total 94.0% of residents of Gahanna speak English at home.
1.1% of residents speak Spanish at home 245 64.6% Speak English very well134 35.4% Speak English less than very well3.9% of residents speak other language at home 876 66.2% Speak English very well448 33.8% Speak English less than very well
English speakers - Born in the United States 97.5% of residents of Gahanna speak English at home.
1.2% of residents speak Spanish at home 86 81.1% Speak English very well20 18.9% Speak English less than very well1.2% of residents speak other language at home 105 100.0% Speak English very well
English speakers - Native, born elsewhere 64.7% of residents of Gahanna speak English at home.
29.1% of residents speak Spanish at home 56 51.9% Speak English very well52 48.1% Speak English less than very well5.4% of residents speak other language at home 20 100.0% Speak English very well
English speakers - Foreign-born 42.1% of residents of Gahanna speak English at home.
5.3% of residents speak Spanish at home 67 55.4% Speak English very well54 44.6% Speak English less than very well46.4% of residents speak other language at home 618 58.7% Speak English very well435 41.3% Speak English less than very well
White (Caucasian) - Speak only English Native:
99.6% (24,099)Foreign-born:
71.2% (403)
White (Caucasian) - Speak another language Native:
0.6% (152)Foreign-born:
31.1% (176)
Black or African American - Speak only English Native:
97.5% (3,616)Foreign-born:
27.1% (122)
Black or African American - Speak another language Native:
1.2% (45)Foreign-born:
72.4% (325)
Asian - Speak only English Native:
62.0% (155)Foreign-born:
38.1% (342)
Asian - Speak another language Native:
38.8% (97)Foreign-born:
52.9% (474)
Other race - Speak only English Native:
70.9% (390)Foreign-born:
5.3% (6)
Other race - Speak another language Native:
7.9% (43)Foreign-born:
89.7% (97)
Two or more races - Speak another language Native:
6.2% (167)Foreign-born:
99.8% (89)
White alone - Speak only English Native:
99.4% (24,060)Foreign-born:
59.2% (397)
White alone - Speak another language Native:
0.6% (136)Foreign-born:
34.0% (228)
Hispanic or Latino - Speak only English Native:
66.4% (518)Foreign-born:
18.1% (28)
Hispanic or Latino - Speak another language Native:
28.9% (225)Foreign-born:
83.9% (128)
Foreign-born residents in Gahanna 2,236 residents are foreign born (2.5% Asia , 1.2% Africa , 1.0% Europe , 0.7% Oceania ).
Marital status for residents in Gahanna Marital status - White (Caucasian) population 15 years and over
Males 27.5% Never married61.9% Now married1.3% Separated2.6% Widowed6.6% DivorcedFemales 23.3% Never married54.7% Now married1.2% Separated8.4% Widowed12.4% DivorcedWomen who gave birth in the past 12 months Now married:
87.1% (286)Unmarried:
12.9% (42)
Women who did not give birth in the past 12 months Now married:
52.5% (2,947)Unmarried:
47.5% (2,665)
Marital status - Black or African American population 15 years and over
Males 38.6% Never married46.4% Now married1.3% Separated4.7% Widowed9.0% DivorcedFemales 33.5% Never married35.0% Now married9.9% Separated11.1% Widowed10.5% DivorcedWomen who gave birth in the past 12 months Now married:
100.0% (29)Unmarried:
0.0% (0)
Women who did not give birth in the past 12 months Now married:
34.1% (345)Unmarried:
65.9% (669)
Marital status - American Indian / Alaska Native population 15 years and over
Males 100.0% Never married0.0% Now married0.0% Separated0.0% Widowed0.0% DivorcedFemales 100.0% Never married0.0% Now married0.0% Separated0.0% Widowed0.0% DivorcedMarital status - Asian population 15 years and over
Males 21.5% Never married78.5% Now married0.0% Separated0.0% Widowed0.0% DivorcedFemales 48.5% Never married41.6% Now married2.0% Separated5.7% Widowed2.1% DivorcedWomen who gave birth in the past 12 months Now married:
100.0% (58)Unmarried:
0.0% (0)
Women who did not give birth in the past 12 months Now married:
26.4% (153)Unmarried:
73.6% (425)
Marital status - Other race population 15 years and over
Males 41.5% Never married39.5% Now married0.0% Separated0.0% Widowed19.0% DivorcedFemales 66.9% Never married22.5% Now married0.0% Separated0.0% Widowed10.6% DivorcedWomen who gave birth in the past 12 months Now married:
100.0% (22)Unmarried:
0.0% (0)
Women who did not give birth in the past 12 months Now married:
11.3% (17)Unmarried:
88.7% (133)
Marital status - Two or more races population 15 years and over
Males 38.6% Never married53.9% Now married2.1% Separated5.4% Widowed0.0% DivorcedFemales 34.0% Never married31.4% Now married3.0% Separated15.6% Widowed16.0% DivorcedWomen who did not give birth in the past 12 months Now married:
39.4% (254)Unmarried:
60.6% (392)
Marital status - White alone, not Hispanic / Latino population 15 years and over
Males 27.6% Never married62.0% Now married1.3% Separated2.7% Widowed6.5% DivorcedFemales 23.2% Never married54.7% Now married1.2% Separated8.5% Widowed12.5% DivorcedWomen who gave birth in the past 12 months Now married:
87.1% (290)Unmarried:
12.9% (43)
Women who did not give birth in the past 12 months Now married:
52.4% (2,936)Unmarried:
47.6% (2,669)
Marital status - Hispanic or Latino population 15 years and over
Males 28.7% Never married42.4% Now married0.0% Separated6.4% Widowed22.6% DivorcedFemales 47.3% Never married34.3% Now married0.0% Separated0.0% Widowed18.4% DivorcedWomen who gave birth in the past 12 months Now married:
100.0% (12)Unmarried:
0.0% (0)
Women who did not give birth in the past 12 months Now married:
35.8% (81)Unmarried:
64.2% (145)
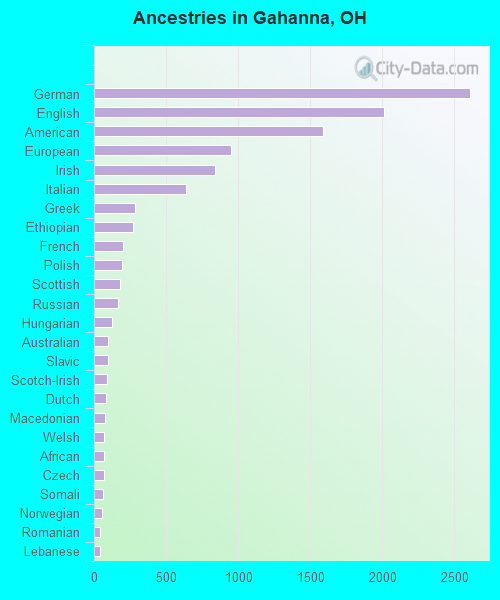
Ancestries in Gahanna
2,612 15.4% German2,012 11.8% English1,593 9.4% American952 5.6% European839 4.9% Irish636 3.7% Italian284 1.7% Greek269 1.6% Ethiopian202 1.2% French196 1.2% Polish182 1.1% Scottish165 1.0% Russian128 0.8% Hungarian97 0.6% Australian95 0.6% Slavic89 0.5% Scotch-Irish80 0.5% Dutch76 0.4% Macedonian70 0.4% Welsh67 0.4% African66 0.4% Czech61 0.4% Somali58 0.3% Norwegian45 0.3% Romanian45 0.3% Lebanese44 0.3% Jamaican40 0.2% Nigerian39 0.2% Ukrainian35 0.2% Eastern European30 0.2% Scandinavian26 0.2% British26 0.2% Slovak22 0.1% Northern European21 0.1% French Canadian18 0.1% Brazilian15 0.09% Croatian15 0.09% Canadian15 0.09% Swiss14 0.08% Syrian14 0.08% Swedish9 0.05% Liberian8 0.05% Bulgarian8 0.05% Austrian
Geographical mobility in Gahanna Same house 1 year ago 23,284 90.8% White (Caucasian)3,864 89.8% Black or African American22 100.0% American Indian / Alaska Native1,131 92.9% Asian24 100.0% Native Hawaiian / Pacific Islander793 90.7% Other race2,894 99.1% Two or more races23,468 90.8% White alone, not Hispanic / Latino833 86.9% Hispanic or LatinoMoved within same county 1,715 6.7% White / Caucasian263 6.1% Black or African American19 1.5% Asian28 3.2% Other race13 0.4% Two or more races1,731 6.7% White alone, not Hispanic / Latino72 7.5% Hispanic or LatinoMoved within same state 490 1.9% White / Caucasian66 1.5% Black or African American478 1.9% White alone, not Hispanic / Latino13 1.3% Hispanic or LatinoMoved from different state 156 0.6% White / Caucasian17 0.4% Black or African American66 5.5% Asian9 1.0% Other race37 1.3% Two or more races149 0.6% White alone, not Hispanic / Latino13 1.4% Hispanic or LatinoMoved from abroad 57 1.3% Black or African American9 0.8% Asian
Children Nativity (place of birth) in Gahanna
Children under 6 years - Living with two parents Both parents native 1,546 99.3% Native11 0.7% Foreign-bornBoth parents foreign-born 126 100.0% NativeOne native, one foreign-born parent 16 100.0% NativeChildren under 6 years - Living with one parent Native parent 383 100.0% NativeChildren 6 to 17 years - Living with two parents Both parents native 3,667 100.0% NativeBoth parents foreign-born 335 55.2% Native273 44.8% Foreign-bornOne native, one foreign-born parent 204 100.0% NativeChildren 6 to 17 years - Living with one parent Native parent 1,509 81.8% Native335 18.2% Foreign-bornForeign-born parent 15 50.6% Native14 49.4% Foreign-born
Grandparents responsible for own grandchildren in Gahanna
Grandparents (30 to 59 years) White / Caucasian 27 29.5% Responsible for grandchildren65 70.5% Not responsible for grandchildrenBlack or African American 11 100.0% Responsible for grandchildrenWhite alone, not Hispanic / Latino 28 29.0% Responsible for grandchildren68 71.0% Not responsible for grandchildrenGrandparents (60 years and over) White / Caucasian 117 59.4% Responsible for grandchildren80 40.6% Not responsible for grandchildrenBlack or African American 36 72.1% Responsible for grandchildren14 27.9% Not responsible for grandchildrenWhite alone, not Hispanic / Latino 119 59.0% Responsible for grandchildren83 41.0% Not responsible for grandchildren