Races in Fulton, Missouri (MO) Detailed Stats
Data:
Races - White alone (%)
Races - White alone (% change since 2000)
Races - Black alone (%)
Races - Black alone (% change since 2000)
Races - American Indian alone (%)
Races - American Indian alone (% change since 2000)
Races - Asian alone (%)
Races - Asian alone (% change since 2000)
Races - Hispanic (%)
Races - Hispanic (% change since 2000)
Races - Native Hawaiian and Other Pacific Islander alone (%)
Races - Native Hawaiian and Other Pacific Islander alone (% change since 2000)
Races - Two or more races(%)
Races - Two or more races(% change since 2000)
Races - Other race alone (%)
Races - Other race alone (% change since 2000)
Racial diversity
Place of birth - Born in state of residence (%)
Place of birth - Born in state of residence (%) - White
Place of birth - Born in state of residence (%) - Black or African American
Place of birth - Born in state of residence (%) - Asian
Place of birth - Born in state of residence (%) - Hispanic or Latino
Place of birth - Born in state of residence (%) - American Indian and Alaska Native
Place of birth - Born in state of residence (%) - Multirace
Place of birth - Born in state of residence (%) - Other Race
Place of birth - Born in other state (%)
Place of birth - Born in other state (%) - White
Place of birth - Born in other state (%) - Black or African American
Place of birth - Born in other state (%) - Asian
Place of birth - Born in other state (%) - Hispanic or Latino
Place of birth - Born in other state (%) - American Indian and Alaska Native
Place of birth - Born in other state (%) - Multirace
Place of birth - Born in other state (%) - Other Race
Place of birth - Native, outside of US (%)
Place of birth - Native, outside of US (%) - White
Place of birth - Native, outside of US (%) - Black or African American
Place of birth - Native, outside of US (%) - Asian
Place of birth - Native, outside of US (%) - Hispanic or Latino
Place of birth - Native, outside of US (%) - American Indian and Alaska Native
Place of birth - Native, outside of US (%) - Multirace
Place of birth - Native, outside of US (%) - Other Race
Place of birth - Foreign born (%)
Place of birth - Foreign born (%) - White
Place of birth - Foreign born (%) - Black or African American
Place of birth - Foreign born (%) - Asian
Place of birth - Foreign born (%) - Hispanic or Latino
Place of birth - Foreign born (%) - American Indian and Alaska Native
Place of birth - Foreign born (%) - Multirace
Place of birth - Foreign born (%) - Other Race
Residents speaking English at home (%)
Residents speaking English at home - Born in the United States (%)
Residents speaking English at home - Native, born elsewhere (%)
Residents speaking English at home - Foreign born (%)
Residents speaking Spanish at home (%)
Residents speaking Spanish at home - Born in the United States (%)
Residents speaking Spanish at home - Native, born elsewhere (%)
Residents speaking Spanish at home - Foreign born (%)
Residents speaking other language at home (%)
Residents speaking other language at home - Born in the United States (%)
Residents speaking other language at home - Native, born elsewhere (%)
Residents speaking other language at home - Foreign born (%)
Marital status - Never married (%)
Marital status - Now married (%)
Marital status - Separated (%)
Marital status - Widowed (%)
Marital status - Divorced (%)
Ancestries Reported - Arab (%)
Ancestries Reported - Czech (%)
Ancestries Reported - Danish (%)
Ancestries Reported - Dutch (%)
Ancestries Reported - English (%)
Ancestries Reported - French (%)
Ancestries Reported - French Canadian (%)
Ancestries Reported - German (%)
Ancestries Reported - Greek (%)
Ancestries Reported - Hungarian (%)
Ancestries Reported - Irish (%)
Ancestries Reported - Italian (%)
Ancestries Reported - Lithuanian (%)
Ancestries Reported - Norwegian (%)
Ancestries Reported - Polish (%)
Ancestries Reported - Portuguese (%)
Ancestries Reported - Russian (%)
Ancestries Reported - Scotch-Irish (%)
Ancestries Reported - Scottish (%)
Ancestries Reported - Slovak (%)
Ancestries Reported - Subsaharan African (%)
Ancestries Reported - Swedish (%)
Ancestries Reported - Swiss (%)
Ancestries Reported - Ukrainian (%)
Ancestries Reported - United States (%)
Ancestries Reported - Welsh (%)
Ancestries Reported - West Indian (%)
Ancestries Reported - Other (%)
Geographical mobility - Same house 1 year ago (%)
Geographical mobility - Same house 1 year ago (%) - White
Geographical mobility - Same house 1 year ago (%) - Black or African American
Geographical mobility - Same house 1 year ago (%) - Asian
Geographical mobility - Same house 1 year ago (%) - Hispanic or Latino
Geographical mobility - Same house 1 year ago (%) - American Indian and Alaska Native
Geographical mobility - Same house 1 year ago (%) - Multirace
Geographical mobility - Same house 1 year ago (%) - Other Race
Geographical mobility - Moved within same county (%)
Geographical mobility - Moved within same county (%) - White
Geographical mobility - Moved within same county (%) - Black or African American
Geographical mobility - Moved within same county (%) - Asian
Geographical mobility - Moved within same county (%) - Hispanic or Latino
Geographical mobility - Moved within same county (%) - American Indian and Alaska Native
Geographical mobility - Moved within same county (%) - Multirace
Geographical mobility - Moved within same county (%) - Other Race
Geographical mobility - Moved from different county within same state (%)
Geographical mobility - Moved from different county within same state (%) - White
Geographical mobility - Moved from different county within same state (%) - Black or African American
Geographical mobility - Moved from different county within same state (%) - Asian
Geographical mobility - Moved from different county within same state (%) - Hispanic or Latino
Geographical mobility - Moved from different county within same state (%) - American Indian and Alaska Native
Geographical mobility - Moved from different county within same state (%) - Multirace
Geographical mobility - Moved from different county within same state (%) - Other Race
Geographical mobility - Moved from different state (%)
Geographical mobility - Moved from different state (%) - White
Geographical mobility - Moved from different state (%) - Black or African American
Geographical mobility - Moved from different state (%) - Asian
Geographical mobility - Moved from different state (%) - Hispanic or Latino
Geographical mobility - Moved from different state (%) - American Indian and Alaska Native
Geographical mobility - Moved from different state (%) - Multirace
Geographical mobility - Moved from different state (%) - Other Race
Geographical mobility - Moved from abroad (%)
Geographical mobility - Moved from abroad (%) - White
Geographical mobility - Moved from abroad (%) - Black or African American
Geographical mobility - Moved from abroad (%) - Asian
Geographical mobility - Moved from abroad (%) - Hispanic or Latino
Geographical mobility - Moved from abroad (%) - American Indian and Alaska Native
Geographical mobility - Moved from abroad (%) - Multirace
Geographical mobility - Moved from abroad (%) - Other Race
Place of birth for the foreign-born population - Ireland (%)
Place of birth for the foreign-born population - Denmark (%)
Place of birth for the foreign-born population - Norway (%)
Place of birth for the foreign-born population - Sweden (%)
Place of birth for the foreign-born population - United Kingdom (%)
Place of birth for the foreign-born population - England (%)
Place of birth for the foreign-born population - Scotland (%)
Place of birth for the foreign-born population - Other Northern Europe (%)
Place of birth for the foreign-born population - Austria (%)
Place of birth for the foreign-born population - Belgium (%)
Place of birth for the foreign-born population - France (%)
Place of birth for the foreign-born population - Germany (%)
Place of birth for the foreign-born population - Netherlands (%)
Place of birth for the foreign-born population - Switzerland (%)
Place of birth for the foreign-born population - Other Western Europe (%)
Place of birth for the foreign-born population - Greece (%)
Place of birth for the foreign-born population - Italy (%)
Place of birth for the foreign-born population - Portugal (%)
Place of birth for the foreign-born population - Spain (%)
Place of birth for the foreign-born population - Other Southern Europe (%)
Place of birth for the foreign-born population - Albania (%)
Place of birth for the foreign-born population - Belarus (%)
Place of birth for the foreign-born population - Bosnia and Herzegovina (%)
Place of birth for the foreign-born population - Bulgaria (%)
Place of birth for the foreign-born population - Croatia (%)
Place of birth for the foreign-born population - Czechoslovakia (%)
Place of birth for the foreign-born population - Hungary (%)
Place of birth for the foreign-born population - Latvia (%)
Place of birth for the foreign-born population - Lithuania (%)
Place of birth for the foreign-born population - North Macedonia (Macedonia) (%)
Place of birth for the foreign-born population - Moldova (%)
Place of birth for the foreign-born population - Poland (%)
Place of birth for the foreign-born population - Romania (%)
Place of birth for the foreign-born population - Russia (%)
Place of birth for the foreign-born population - Serbia (%)
Place of birth for the foreign-born population - Ukraine (%)
Place of birth for the foreign-born population - Other Eastern Europe (%)
Place of birth for the foreign-born population - China (%)
Place of birth for the foreign-born population - Hong Kong (%)
Place of birth for the foreign-born population - Taiwan (%)
Place of birth for the foreign-born population - Japan (%)
Place of birth for the foreign-born population - Korea (%)
Place of birth for the foreign-born population - Other Eastern Asia (%)
Place of birth for the foreign-born population - Afghanistan (%)
Place of birth for the foreign-born population - Bangladesh (%)
Place of birth for the foreign-born population - India (%)
Place of birth for the foreign-born population - Iran (%)
Place of birth for the foreign-born population - Kazakhstan (%)
Place of birth for the foreign-born population - Nepal (%)
Place of birth for the foreign-born population - Pakistan (%)
Place of birth for the foreign-born population - Sri Lanka (%)
Place of birth for the foreign-born population - Uzbekistan (%)
Place of birth for the foreign-born population - Other South Central Asia (%)
Place of birth for the foreign-born population - Burma (%)
Place of birth for the foreign-born population - Cambodia (%)
Place of birth for the foreign-born population - Indonesia (%)
Place of birth for the foreign-born population - Laos (%)
Place of birth for the foreign-born population - Malaysia (%)
Place of birth for the foreign-born population - Philippines (%)
Place of birth for the foreign-born population - Singapore (%)
Place of birth for the foreign-born population - Thailand (%)
Place of birth for the foreign-born population - Vietnam (%)
Place of birth for the foreign-born population - Other South Eastern Asia (%)
Place of birth for the foreign-born population - Armenia (%)
Place of birth for the foreign-born population - Iraq (%)
Place of birth for the foreign-born population - Israel (%)
Place of birth for the foreign-born population - Jordan (%)
Place of birth for the foreign-born population - Kuwait (%)
Place of birth for the foreign-born population - Lebanon (%)
Place of birth for the foreign-born population - Saudi Arabia (%)
Place of birth for the foreign-born population - Syria (%)
Place of birth for the foreign-born population - Turkey (%)
Place of birth for the foreign-born population - Yemen (%)
Place of birth for the foreign-born population - Other Western Asia (%)
Place of birth for the foreign-born population - Eritrea (%)
Place of birth for the foreign-born population - Ethiopia (%)
Place of birth for the foreign-born population - Kenya (%)
Place of birth for the foreign-born population - Somalia (%)
Place of birth for the foreign-born population - Uganda (%)
Place of birth for the foreign-born population - Zimbabwe (%)
Place of birth for the foreign-born population - Other Eastern Africa (%)
Place of birth for the foreign-born population - Cameroon (%)
Place of birth for the foreign-born population - Congo (%)
Place of birth for the foreign-born population - Democratic Republic of Congo (Zaire) (%)
Place of birth for the foreign-born population - Other Middle Africa (%)
Place of birth for the foreign-born population - Egypt (%)
Place of birth for the foreign-born population - Morocco (%)
Place of birth for the foreign-born population - Sudan (%)
Place of birth for the foreign-born population - Other Northern Africa (%)
Place of birth for the foreign-born population - South Africa (%)
Place of birth for the foreign-born population - Other Southern Africa (%)
Place of birth for the foreign-born population - Cabo Verde (%)
Place of birth for the foreign-born population - Ghana (%)
Place of birth for the foreign-born population - Liberia (%)
Place of birth for the foreign-born population - Nigeria (%)
Place of birth for the foreign-born population - Senegal (%)
Place of birth for the foreign-born population - Sierra Leone (%)
Place of birth for the foreign-born population - Other Western Africa (%)
Place of birth for the foreign-born population - Australia (%)
Place of birth for the foreign-born population - New Zealand (%)
Place of birth for the foreign-born population - Fiji (%)
Place of birth for the foreign-born population - Micronesia (%)
Place of birth for the foreign-born population - Bahamas (%)
Place of birth for the foreign-born population - Barbados (%)
Place of birth for the foreign-born population - Cuba (%)
Place of birth for the foreign-born population - Dominica (%)
Place of birth for the foreign-born population - Dominican Republic (%)
Place of birth for the foreign-born population - Grenada (%)
Place of birth for the foreign-born population - Haiti (%)
Place of birth for the foreign-born population - Jamaica (%)
Place of birth for the foreign-born population - St. Vincent and the Grenadines (%)
Place of birth for the foreign-born population - Trinidad and Tobago (%)
Place of birth for the foreign-born population - West Indies (%)
Place of birth for the foreign-born population - Other Caribbean (%)
Place of birth for the foreign-born population - Belize (%)
Place of birth for the foreign-born population - Costa Rica (%)
Place of birth for the foreign-born population - El Salvador (%)
Place of birth for the foreign-born population - Guatemala (%)
Place of birth for the foreign-born population - Honduras (%)
Place of birth for the foreign-born population - Mexico (%)
Place of birth for the foreign-born population - Nicaragua (%)
Place of birth for the foreign-born population - Panama (%)
Place of birth for the foreign-born population - Other Central America (%)
Place of birth for the foreign-born population - Argentina (%)
Place of birth for the foreign-born population - Bolivia (%)
Place of birth for the foreign-born population - Brazil (%)
Place of birth for the foreign-born population - Chile (%)
Place of birth for the foreign-born population - Colombia (%)
Place of birth for the foreign-born population - Ecuador (%)
Place of birth for the foreign-born population - Guyana (%)
Place of birth for the foreign-born population - Peru (%)
Place of birth for the foreign-born population - Uruguay (%)
Place of birth for the foreign-born population - Venezuela (%)
Place of birth for the foreign-born population - Other South America (%)
Place of birth for the foreign-born population - Canada (%)
Place of birth for the foreign-born population - Other Northern America (%)
Place of birth for the foreign-born population - Other (%)
Latest news about races in Fulton, MO collected exclusively by city-data.com from local newspapers, TV, and radio stations
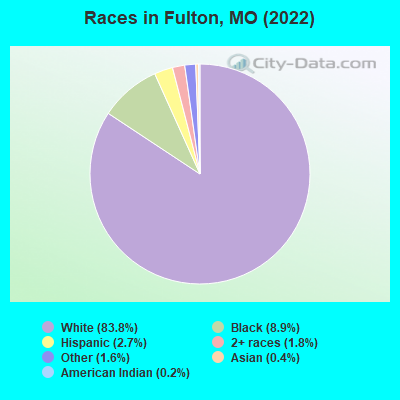
According to 2022 data, the most numerous races in Fulton, MO are White alone (10,643 residents), Black alone (1,126 residents), and Two or more races (226 residents). 97.8% of Fulton residents speak English at home. 1.3% of Fulton, MO residents are foreign-born , which is 217.4% less than the foreign-born rate of 4.0% across the entire state of Missouri.
Race distribution in Fulton
2000 2022
4,686,474 83.8% White alone 625,667 11.2% Black alone 118,592 2.1% Hispanic 71,905 1.3% Two or more races 61,041 1.1% Asian alone 23,302 0.4% American Indian alone 5,291 0.09% Other race alone 2,939 0.05% Native Hawaiian and Other
4,733,411 76.6% White alone 656,739 10.6% Black alone 316,300 5.1% Two or more races 291,763 4.7% Hispanic 132,436 2.1% Asian alone 27,467 0.4% Other race alone 12,313 0.2% American Indian alone 7,528 0.1% Native Hawaiian and Other
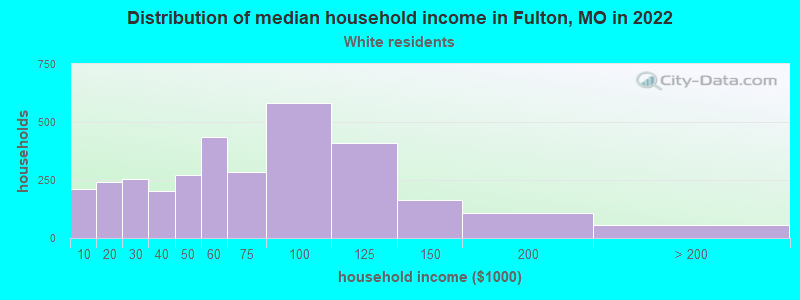
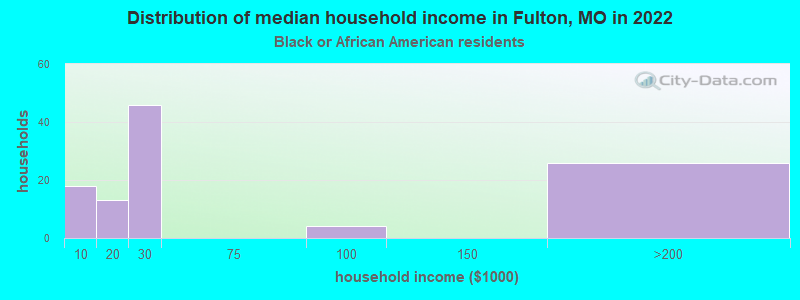
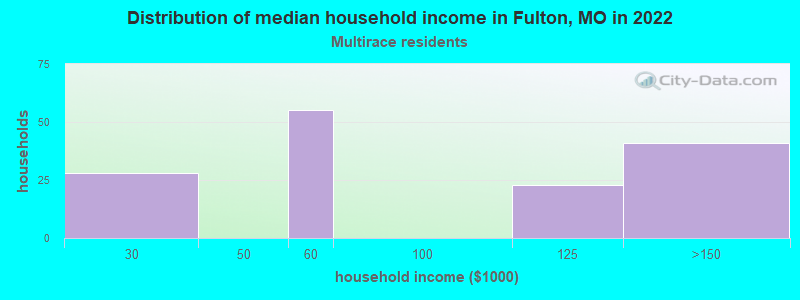
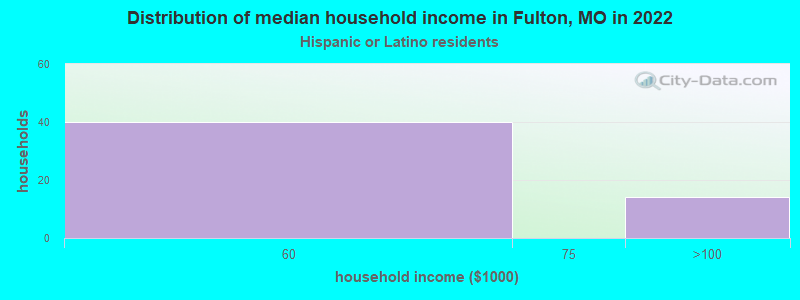
Income and house value in Fulton Median household income in 2022 $59,484 White non-Hispanic householders$22,213 Black householdersMedian 2022 house value $160,286 White Non-Hispanic householders$139,829 Black or African American householders$158,177 American Indian or Alaska Native householders $179,268 Asian householders
Median age by race in Fulton
35.8 Median age for White residents36.2 35.0 29.6 Median age for Black or African American residents29.6 26.7 29.5 Median age for American Indian / Alaska Native residents28.0 -576,856,648.8 20.7 Median age for Asian residents21.0 -666,666,666.0 -693,430,656.2 Median age for Native Hawaiian / Pacific Islander residents-683,513,838.1 -752,136,751.4 24.5 Median age for Other race residents45.2 -684,343,433.7 36.9 Median age for Two or more races residents38.4 36.1 36.0 Median age for White alone residents36.1 36.0 19.6 Median age for Hispanic or Latino residents40.5 18.5
Owner/renter occupied households by race in Fulton
House owners and renters - White residents 1,900 59.4% Owner occupied1,298 40.6% Renter occupiedHouse owners and renters - Black or African American residents 9 8.3% Owner occupied103 91.7% Renter occupiedHouse owners and renters - American Indian / Alaska Native residents 16 100.0% Owner occupiedHouse owners and renters - Other race residents 16 100.0% Owner occupiedHouse owners and renters - Two or more races residents 38 27.6% Owner occupied100 72.4% Renter occupiedHouse owners and renters - White alone residents 1,907 59.2% Owner occupied1,314 40.8% Renter occupiedHouse owners and renters - Hispanic or Latino residents 13 27.1% Owner occupied36 72.9% Renter occupied
Language usage in Fulton
English speakers - Total 97.8% of residents of Fulton speak English at home.
1.0% of residents speak Spanish at home 79 66.9% Speak English very well39 33.1% Speak English less than very well1.1% of residents speak other language at home 84 60.9% Speak English very well54 39.1% Speak English less than very well
English speakers - Born in the United States 97.8% of residents of Fulton speak English at home.
2.1% of residents speak Spanish at home 65 92.9% Speak English very well5 7.1% Speak English less than very well
All residents speak only English at home
English speakers - Foreign-born 5.6% of residents of Fulton speak English at home.
13.8% of residents speak Spanish at home 11 50.0% Speak English very well11 50.0% Speak English less than very well80.6% of residents speak other language at home 75 58.1% Speak English very well54 41.9% Speak English less than very well
White (Caucasian) - Speak another language Native:
0.2% (20)Foreign-born:
99.0% (72)
Black or African American - Speak only English Native:
98.4% (1,079)Foreign-born:
84.3% (5)
Black or African American - Speak another language Native:
1.1% (12)Foreign-born:
16.6% (1)
Asian - Speak only English Native:
100.0% (11)Foreign-born:
2.8% (1)
Other race - Speak only English Native:
97.5% (203)Foreign-born:
36.4% (7)
Other race - Speak another language Native:
9.3% (19)Foreign-born:
71.2% (13)
Two or more races - Speak another language Native:
23.0% (68)Foreign-born:
100.0% (17)
White alone - Speak another language Native:
0.2% (24)Foreign-born:
100.0% (87)
Hispanic or Latino - Speak only English Native:
79.2% (236)Foreign-born:
15.5% (4)
Hispanic or Latino - Speak another language Native:
21.5% (64)Foreign-born:
84.7% (23)
Foreign-born residents in Fulton 160 residents are foreign born
This city:
1.3%Missouri:
4.2%
Marital status for residents in Fulton Marital status - White (Caucasian) population 15 years and over
Males 39.9% Never married37.1% Now married1.2% Separated4.5% Widowed17.3% DivorcedFemales 36.9% Never married37.6% Now married0.4% Separated10.8% Widowed14.3% DivorcedWomen who gave birth in the past 12 months Now married:
96.5% (161)Unmarried:
3.5% (6)
Women who did not give birth in the past 12 months Now married:
32.4% (754)Unmarried:
67.6% (1,572)
Marital status - Black or African American population 15 years and over
Males 65.6% Never married21.9% Now married0.0% Separated0.0% Widowed12.5% DivorcedFemales 52.5% Never married26.7% Now married0.0% Separated0.0% Widowed20.8% DivorcedWomen who gave birth in the past 12 months Now married:
0.0% (0)Unmarried:
100.0% (8)
Women who did not give birth in the past 12 months Now married:
47.8% (51)Unmarried:
52.2% (55)
Marital status - American Indian / Alaska Native population 15 years and over
Males 100.0% Never married0.0% Now married0.0% Separated0.0% Widowed0.0% DivorcedFemales 100.0% Never married0.0% Now married0.0% Separated0.0% Widowed0.0% DivorcedWomen who did not give birth in the past 12 months Now married:
0.0% (0)Unmarried:
100.0% (15)
Marital status - Asian population 15 years and over
Males 97.6% Never married2.4% Now married0.0% Separated0.0% Widowed0.0% DivorcedFemales 100.0% Never married0.0% Now married0.0% Separated0.0% Widowed0.0% DivorcedWomen who did not give birth in the past 12 months Now married:
0.0% (0)Unmarried:
100.0% (3)
Marital status - Other race population 15 years and over
Males 5.1% Never married74.4% Now married10.3% Separated0.0% Widowed10.3% DivorcedFemales 100.0% Never married0.0% Now married0.0% Separated0.0% Widowed0.0% DivorcedWomen who did not give birth in the past 12 months Now married:
0.0% (0)Unmarried:
100.0% (176)
Marital status - Two or more races population 15 years and over
Males 51.6% Never married6.5% Now married20.4% Separated0.0% Widowed21.5% DivorcedFemales 17.4% Never married67.8% Now married0.0% Separated0.0% Widowed14.9% DivorcedWomen who did not give birth in the past 12 months Now married:
76.4% (94)Unmarried:
23.6% (29)
Marital status - White alone, not Hispanic / Latino population 15 years and over
Males 39.8% Never married37.2% Now married1.2% Separated4.5% Widowed17.3% DivorcedFemales 35.7% Never married37.8% Now married0.4% Separated11.2% Widowed14.8% DivorcedWomen who gave birth in the past 12 months Now married:
96.5% (162)Unmarried:
3.5% (6)
Women who did not give birth in the past 12 months Now married:
32.5% (721)Unmarried:
67.5% (1,496)
Marital status - Hispanic or Latino population 15 years and over
Males 54.0% Never married29.9% Now married4.6% Separated0.0% Widowed11.5% DivorcedFemales 57.7% Never married42.3% Now married0.0% Separated0.0% Widowed0.0% DivorcedWomen who gave birth in the past 12 months Now married:
0.0% (0)Unmarried:
100.0% (10)
Women who did not give birth in the past 12 months Now married:
44.5% (84)Unmarried:
55.5% (105)
Ancestries in Fulton
1,611 29.8% German600 11.1% English467 8.7% American362 6.7% Irish151 2.8% European133 2.5% French109 2.0% Italian50 0.9% Lithuanian43 0.8% Dutch39 0.7% Polish19 0.4% Norwegian17 0.3% British16 0.3% Swedish15 0.3% Czech15 0.3% Jamaican14 0.3% African12 0.2% Scottish4 0.07% Somali2 0.04% Scotch-Irish
Geographical mobility in Fulton Same house 1 year ago 7,611 71.6% White (Caucasian)702 61.9% Black or African American31 61.7% American Indian / Alaska Native23 10.5% Other race224 64.4% Two or more races7,506 71.2% White alone, not Hispanic / Latino263 75.4% Hispanic or LatinoMoved within same county 1,038 9.8% White / Caucasian9 0.8% Black or African American118 53.3% Other race39 11.2% Two or more races1,045 9.9% White alone, not Hispanic / Latino32 9.3% Hispanic or LatinoMoved within same state 1,385 13.0% White / Caucasian421 37.2% Black or African American23 45.5% American Indian / Alaska Native8 17.3% Asian22 9.9% Other race37 10.5% Two or more races1,383 13.1% White alone, not Hispanic / Latino48 13.8% Hispanic or LatinoMoved from different state 537 5.1% White / Caucasian10 0.9% Black or African American37 79.3% Asian8 3.8% Other race42 12.2% Two or more races543 5.2% White alone, not Hispanic / Latino8 2.3% Hispanic or Latino
Children Nativity (place of birth) in Fulton
Children under 6 years - Living with two parents Both parents native 412 100.0% NativeOne native, one foreign-born parent 30 100.0% NativeChildren under 6 years - Living with one parent Native parent 228 100.0% Native
Children 6 to 17 years - Living with two parents Both parents native 1,072 100.0% NativeChildren 6 to 17 years - Living with one parent Native parent 584 100.0% Native
Grandparents responsible for own grandchildren in Fulton
Grandparents (30 to 59 years) White / Caucasian 17 27.1% Responsible for grandchildren45 72.9% Not responsible for grandchildrenWhite alone, not Hispanic / Latino 17 27.0% Responsible for grandchildren46 73.0% Not responsible for grandchildren
Grandparents (60 years and over) White / Caucasian 5 100.0% Not responsible for grandchildrenWhite alone, not Hispanic / Latino 5 100.0% Not responsible for grandchildren