Races in Fruitville, Florida (FL) Detailed Stats
Data:
Races - White alone (%)
Races - White alone (% change since 2000)
Races - Black alone (%)
Races - Black alone (% change since 2000)
Races - American Indian alone (%)
Races - American Indian alone (% change since 2000)
Races - Asian alone (%)
Races - Asian alone (% change since 2000)
Races - Hispanic (%)
Races - Hispanic (% change since 2000)
Races - Native Hawaiian and Other Pacific Islander alone (%)
Races - Native Hawaiian and Other Pacific Islander alone (% change since 2000)
Races - Two or more races(%)
Races - Two or more races(% change since 2000)
Races - Other race alone (%)
Races - Other race alone (% change since 2000)
Racial diversity
Place of birth - Born in state of residence (%)
Place of birth - Born in state of residence (%) - White
Place of birth - Born in state of residence (%) - Black or African American
Place of birth - Born in state of residence (%) - Asian
Place of birth - Born in state of residence (%) - Hispanic or Latino
Place of birth - Born in state of residence (%) - American Indian and Alaska Native
Place of birth - Born in state of residence (%) - Multirace
Place of birth - Born in state of residence (%) - Other Race
Place of birth - Born in other state (%)
Place of birth - Born in other state (%) - White
Place of birth - Born in other state (%) - Black or African American
Place of birth - Born in other state (%) - Asian
Place of birth - Born in other state (%) - Hispanic or Latino
Place of birth - Born in other state (%) - American Indian and Alaska Native
Place of birth - Born in other state (%) - Multirace
Place of birth - Born in other state (%) - Other Race
Place of birth - Native, outside of US (%)
Place of birth - Native, outside of US (%) - White
Place of birth - Native, outside of US (%) - Black or African American
Place of birth - Native, outside of US (%) - Asian
Place of birth - Native, outside of US (%) - Hispanic or Latino
Place of birth - Native, outside of US (%) - American Indian and Alaska Native
Place of birth - Native, outside of US (%) - Multirace
Place of birth - Native, outside of US (%) - Other Race
Place of birth - Foreign born (%)
Place of birth - Foreign born (%) - White
Place of birth - Foreign born (%) - Black or African American
Place of birth - Foreign born (%) - Asian
Place of birth - Foreign born (%) - Hispanic or Latino
Place of birth - Foreign born (%) - American Indian and Alaska Native
Place of birth - Foreign born (%) - Multirace
Place of birth - Foreign born (%) - Other Race
Residents speaking English at home (%)
Residents speaking English at home - Born in the United States (%)
Residents speaking English at home - Native, born elsewhere (%)
Residents speaking English at home - Foreign born (%)
Residents speaking Spanish at home (%)
Residents speaking Spanish at home - Born in the United States (%)
Residents speaking Spanish at home - Native, born elsewhere (%)
Residents speaking Spanish at home - Foreign born (%)
Residents speaking other language at home (%)
Residents speaking other language at home - Born in the United States (%)
Residents speaking other language at home - Native, born elsewhere (%)
Residents speaking other language at home - Foreign born (%)
Marital status - Never married (%)
Marital status - Now married (%)
Marital status - Separated (%)
Marital status - Widowed (%)
Marital status - Divorced (%)
Ancestries Reported - Arab (%)
Ancestries Reported - Czech (%)
Ancestries Reported - Danish (%)
Ancestries Reported - Dutch (%)
Ancestries Reported - English (%)
Ancestries Reported - French (%)
Ancestries Reported - French Canadian (%)
Ancestries Reported - German (%)
Ancestries Reported - Greek (%)
Ancestries Reported - Hungarian (%)
Ancestries Reported - Irish (%)
Ancestries Reported - Italian (%)
Ancestries Reported - Lithuanian (%)
Ancestries Reported - Norwegian (%)
Ancestries Reported - Polish (%)
Ancestries Reported - Portuguese (%)
Ancestries Reported - Russian (%)
Ancestries Reported - Scotch-Irish (%)
Ancestries Reported - Scottish (%)
Ancestries Reported - Slovak (%)
Ancestries Reported - Subsaharan African (%)
Ancestries Reported - Swedish (%)
Ancestries Reported - Swiss (%)
Ancestries Reported - Ukrainian (%)
Ancestries Reported - United States (%)
Ancestries Reported - Welsh (%)
Ancestries Reported - West Indian (%)
Ancestries Reported - Other (%)
Geographical mobility - Same house 1 year ago (%)
Geographical mobility - Same house 1 year ago (%) - White
Geographical mobility - Same house 1 year ago (%) - Black or African American
Geographical mobility - Same house 1 year ago (%) - Asian
Geographical mobility - Same house 1 year ago (%) - Hispanic or Latino
Geographical mobility - Same house 1 year ago (%) - American Indian and Alaska Native
Geographical mobility - Same house 1 year ago (%) - Multirace
Geographical mobility - Same house 1 year ago (%) - Other Race
Geographical mobility - Moved within same county (%)
Geographical mobility - Moved within same county (%) - White
Geographical mobility - Moved within same county (%) - Black or African American
Geographical mobility - Moved within same county (%) - Asian
Geographical mobility - Moved within same county (%) - Hispanic or Latino
Geographical mobility - Moved within same county (%) - American Indian and Alaska Native
Geographical mobility - Moved within same county (%) - Multirace
Geographical mobility - Moved within same county (%) - Other Race
Geographical mobility - Moved from different county within same state (%)
Geographical mobility - Moved from different county within same state (%) - White
Geographical mobility - Moved from different county within same state (%) - Black or African American
Geographical mobility - Moved from different county within same state (%) - Asian
Geographical mobility - Moved from different county within same state (%) - Hispanic or Latino
Geographical mobility - Moved from different county within same state (%) - American Indian and Alaska Native
Geographical mobility - Moved from different county within same state (%) - Multirace
Geographical mobility - Moved from different county within same state (%) - Other Race
Geographical mobility - Moved from different state (%)
Geographical mobility - Moved from different state (%) - White
Geographical mobility - Moved from different state (%) - Black or African American
Geographical mobility - Moved from different state (%) - Asian
Geographical mobility - Moved from different state (%) - Hispanic or Latino
Geographical mobility - Moved from different state (%) - American Indian and Alaska Native
Geographical mobility - Moved from different state (%) - Multirace
Geographical mobility - Moved from different state (%) - Other Race
Geographical mobility - Moved from abroad (%)
Geographical mobility - Moved from abroad (%) - White
Geographical mobility - Moved from abroad (%) - Black or African American
Geographical mobility - Moved from abroad (%) - Asian
Geographical mobility - Moved from abroad (%) - Hispanic or Latino
Geographical mobility - Moved from abroad (%) - American Indian and Alaska Native
Geographical mobility - Moved from abroad (%) - Multirace
Geographical mobility - Moved from abroad (%) - Other Race
Place of birth for the foreign-born population - Ireland (%)
Place of birth for the foreign-born population - Denmark (%)
Place of birth for the foreign-born population - Norway (%)
Place of birth for the foreign-born population - Sweden (%)
Place of birth for the foreign-born population - United Kingdom (%)
Place of birth for the foreign-born population - England (%)
Place of birth for the foreign-born population - Scotland (%)
Place of birth for the foreign-born population - Other Northern Europe (%)
Place of birth for the foreign-born population - Austria (%)
Place of birth for the foreign-born population - Belgium (%)
Place of birth for the foreign-born population - France (%)
Place of birth for the foreign-born population - Germany (%)
Place of birth for the foreign-born population - Netherlands (%)
Place of birth for the foreign-born population - Switzerland (%)
Place of birth for the foreign-born population - Other Western Europe (%)
Place of birth for the foreign-born population - Greece (%)
Place of birth for the foreign-born population - Italy (%)
Place of birth for the foreign-born population - Portugal (%)
Place of birth for the foreign-born population - Spain (%)
Place of birth for the foreign-born population - Other Southern Europe (%)
Place of birth for the foreign-born population - Albania (%)
Place of birth for the foreign-born population - Belarus (%)
Place of birth for the foreign-born population - Bosnia and Herzegovina (%)
Place of birth for the foreign-born population - Bulgaria (%)
Place of birth for the foreign-born population - Croatia (%)
Place of birth for the foreign-born population - Czechoslovakia (%)
Place of birth for the foreign-born population - Hungary (%)
Place of birth for the foreign-born population - Latvia (%)
Place of birth for the foreign-born population - Lithuania (%)
Place of birth for the foreign-born population - North Macedonia (Macedonia) (%)
Place of birth for the foreign-born population - Moldova (%)
Place of birth for the foreign-born population - Poland (%)
Place of birth for the foreign-born population - Romania (%)
Place of birth for the foreign-born population - Russia (%)
Place of birth for the foreign-born population - Serbia (%)
Place of birth for the foreign-born population - Ukraine (%)
Place of birth for the foreign-born population - Other Eastern Europe (%)
Place of birth for the foreign-born population - China (%)
Place of birth for the foreign-born population - Hong Kong (%)
Place of birth for the foreign-born population - Taiwan (%)
Place of birth for the foreign-born population - Japan (%)
Place of birth for the foreign-born population - Korea (%)
Place of birth for the foreign-born population - Other Eastern Asia (%)
Place of birth for the foreign-born population - Afghanistan (%)
Place of birth for the foreign-born population - Bangladesh (%)
Place of birth for the foreign-born population - India (%)
Place of birth for the foreign-born population - Iran (%)
Place of birth for the foreign-born population - Kazakhstan (%)
Place of birth for the foreign-born population - Nepal (%)
Place of birth for the foreign-born population - Pakistan (%)
Place of birth for the foreign-born population - Sri Lanka (%)
Place of birth for the foreign-born population - Uzbekistan (%)
Place of birth for the foreign-born population - Other South Central Asia (%)
Place of birth for the foreign-born population - Burma (%)
Place of birth for the foreign-born population - Cambodia (%)
Place of birth for the foreign-born population - Indonesia (%)
Place of birth for the foreign-born population - Laos (%)
Place of birth for the foreign-born population - Malaysia (%)
Place of birth for the foreign-born population - Philippines (%)
Place of birth for the foreign-born population - Singapore (%)
Place of birth for the foreign-born population - Thailand (%)
Place of birth for the foreign-born population - Vietnam (%)
Place of birth for the foreign-born population - Other South Eastern Asia (%)
Place of birth for the foreign-born population - Armenia (%)
Place of birth for the foreign-born population - Iraq (%)
Place of birth for the foreign-born population - Israel (%)
Place of birth for the foreign-born population - Jordan (%)
Place of birth for the foreign-born population - Kuwait (%)
Place of birth for the foreign-born population - Lebanon (%)
Place of birth for the foreign-born population - Saudi Arabia (%)
Place of birth for the foreign-born population - Syria (%)
Place of birth for the foreign-born population - Turkey (%)
Place of birth for the foreign-born population - Yemen (%)
Place of birth for the foreign-born population - Other Western Asia (%)
Place of birth for the foreign-born population - Eritrea (%)
Place of birth for the foreign-born population - Ethiopia (%)
Place of birth for the foreign-born population - Kenya (%)
Place of birth for the foreign-born population - Somalia (%)
Place of birth for the foreign-born population - Uganda (%)
Place of birth for the foreign-born population - Zimbabwe (%)
Place of birth for the foreign-born population - Other Eastern Africa (%)
Place of birth for the foreign-born population - Cameroon (%)
Place of birth for the foreign-born population - Congo (%)
Place of birth for the foreign-born population - Democratic Republic of Congo (Zaire) (%)
Place of birth for the foreign-born population - Other Middle Africa (%)
Place of birth for the foreign-born population - Egypt (%)
Place of birth for the foreign-born population - Morocco (%)
Place of birth for the foreign-born population - Sudan (%)
Place of birth for the foreign-born population - Other Northern Africa (%)
Place of birth for the foreign-born population - South Africa (%)
Place of birth for the foreign-born population - Other Southern Africa (%)
Place of birth for the foreign-born population - Cabo Verde (%)
Place of birth for the foreign-born population - Ghana (%)
Place of birth for the foreign-born population - Liberia (%)
Place of birth for the foreign-born population - Nigeria (%)
Place of birth for the foreign-born population - Senegal (%)
Place of birth for the foreign-born population - Sierra Leone (%)
Place of birth for the foreign-born population - Other Western Africa (%)
Place of birth for the foreign-born population - Australia (%)
Place of birth for the foreign-born population - New Zealand (%)
Place of birth for the foreign-born population - Fiji (%)
Place of birth for the foreign-born population - Micronesia (%)
Place of birth for the foreign-born population - Bahamas (%)
Place of birth for the foreign-born population - Barbados (%)
Place of birth for the foreign-born population - Cuba (%)
Place of birth for the foreign-born population - Dominica (%)
Place of birth for the foreign-born population - Dominican Republic (%)
Place of birth for the foreign-born population - Grenada (%)
Place of birth for the foreign-born population - Haiti (%)
Place of birth for the foreign-born population - Jamaica (%)
Place of birth for the foreign-born population - St. Vincent and the Grenadines (%)
Place of birth for the foreign-born population - Trinidad and Tobago (%)
Place of birth for the foreign-born population - West Indies (%)
Place of birth for the foreign-born population - Other Caribbean (%)
Place of birth for the foreign-born population - Belize (%)
Place of birth for the foreign-born population - Costa Rica (%)
Place of birth for the foreign-born population - El Salvador (%)
Place of birth for the foreign-born population - Guatemala (%)
Place of birth for the foreign-born population - Honduras (%)
Place of birth for the foreign-born population - Mexico (%)
Place of birth for the foreign-born population - Nicaragua (%)
Place of birth for the foreign-born population - Panama (%)
Place of birth for the foreign-born population - Other Central America (%)
Place of birth for the foreign-born population - Argentina (%)
Place of birth for the foreign-born population - Bolivia (%)
Place of birth for the foreign-born population - Brazil (%)
Place of birth for the foreign-born population - Chile (%)
Place of birth for the foreign-born population - Colombia (%)
Place of birth for the foreign-born population - Ecuador (%)
Place of birth for the foreign-born population - Guyana (%)
Place of birth for the foreign-born population - Peru (%)
Place of birth for the foreign-born population - Uruguay (%)
Place of birth for the foreign-born population - Venezuela (%)
Place of birth for the foreign-born population - Other South America (%)
Place of birth for the foreign-born population - Canada (%)
Place of birth for the foreign-born population - Other Northern America (%)
Place of birth for the foreign-born population - Other (%)
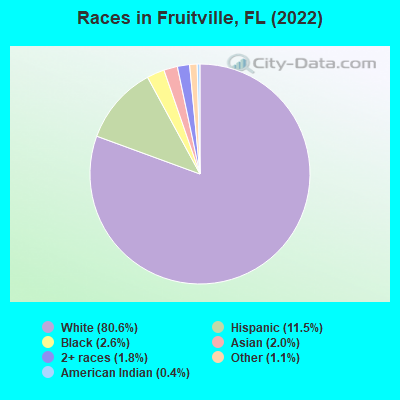
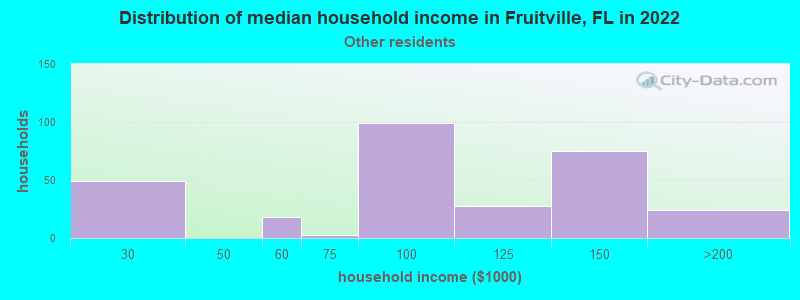
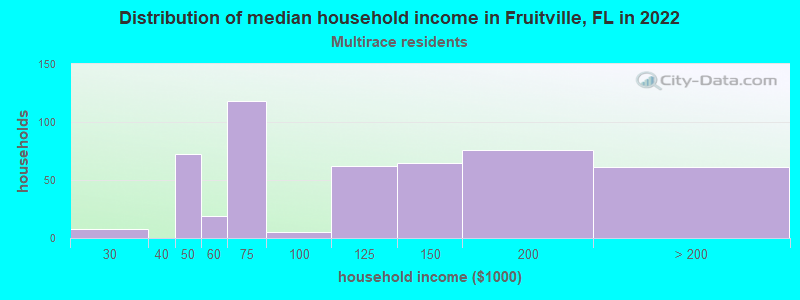
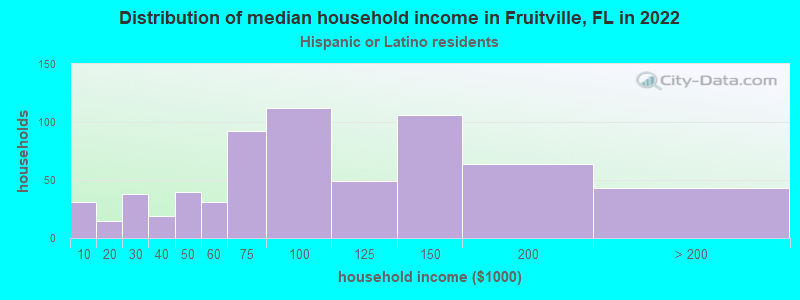
According to 2022 data, the most numerous races in Fruitville, FL are White alone (13,001 residents), Hispanic (1,857 residents), and Black alone (412 residents). 84.5% of Fruitville residents speak English at home. 11.1% of Fruitville, FL residents are foreign-born (5.8% born in Latin America, 2.8% born in Europe, 1.6% born in Asia), which is 88.8% less than the foreign-born rate of 21.0% across the entire state of Florida.
Race distribution in Fruitville
2000 2022
10,458,509 65.4% White alone 2,682,715 16.8% Hispanic 2,264,268 14.2% Black alone 261,693 1.6% Asian alone 236,954 1.5% Two or more races 42,358 0.3% American Indian alone 28,994 0.2% Other race alone 6,887 0.04% Native Hawaiian and Other
11,309,403 50.8% White alone 6,025,039 27.1% Hispanic 3,241,015 14.6% Black alone 861,630 3.9% Two or more races 623,692 2.8% Asian alone 152,054 0.7% Other race alone 22,504 0.1% American Indian alone 9,486 0.04% Native Hawaiian and Other
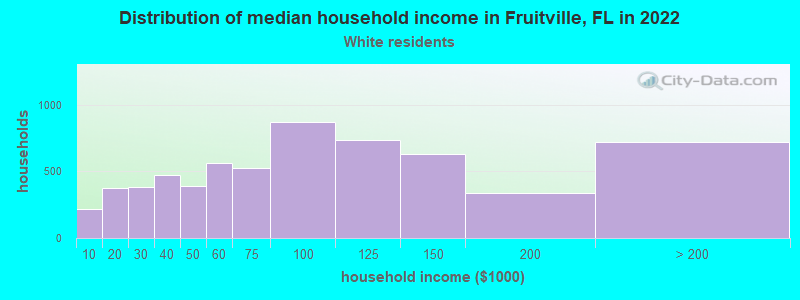
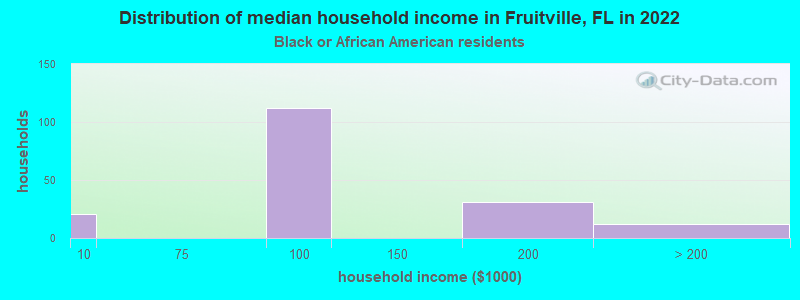
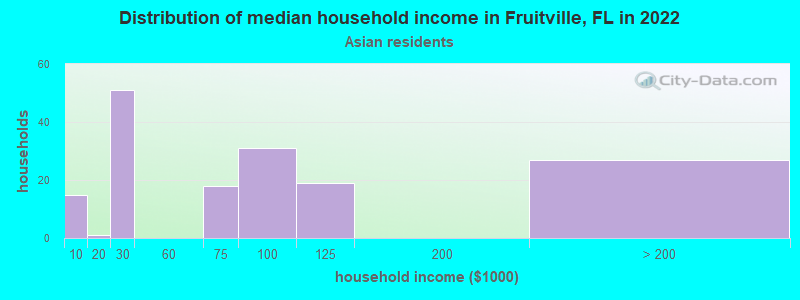
Income and house value in Fruitville Median household income in 2022 $83,635 White non-Hispanic householders$98,074 Black householders$113,644 Some other race householders$116,489 Two or more races householders$78,855 Hispanic or Latino race householdersMedian 2022 house value $427,542 White Non-Hispanic householders$402,627 Black or African American householders $174,405 Asian householders$384,024 Some other race householders$491,325 Two or more races householders$451,460 Hispanic or Latino householders
Median age by race in Fruitville
50.2 Median age for White residents45.1 53.9 60.5 Median age for Black or African American residents76.2 46.2 98.8 Median age for American Indian / Alaska Native residents49.9 55.6 40.9 Median age for Asian residents47.9 36.8 -679,849,340.2 Median age for Native Hawaiian / Pacific Islander residents-858,307,848.3 -443,298,968.6 38.1 Median age for Other race residents42.2 42.8 37.2 Median age for Two or more races residents29.4 49.9 50.8 Median age for White alone residents45.0 54.6 36.3 Median age for Hispanic or Latino residents37.2 37.6
Owner/renter occupied households by race in Fruitville
House owners and renters - White residents 3,884 62.7% Owner occupied2,310 37.3% Renter occupiedHouse owners and renters - Black or African American residents 113 75.5% Owner occupied37 24.5% Renter occupiedHouse owners and renters - American Indian / Alaska Native residents 6 100.0% Owner occupiedHouse owners and renters - Asian residents 136 75.9% Owner occupied43 24.1% Renter occupiedHouse owners and renters - Other race residents 206 60.8% Owner occupied133 39.2% Renter occupiedHouse owners and renters - Two or more races residents 411 72.3% Owner occupied157 27.7% Renter occupiedHouse owners and renters - White alone residents 3,826 62.1% Owner occupied2,339 37.9% Renter occupiedHouse owners and renters - Hispanic or Latino residents 435 60.1% Owner occupied289 39.9% Renter occupied
Language usage in Fruitville
English speakers - Total 84.5% of residents of Fruitville speak English at home.
7.7% of residents speak Spanish at home 699 59.6% Speak English very well473 40.4% Speak English less than very well7.8% of residents speak other language at home 799 67.5% Speak English very well384 32.5% Speak English less than very well
English speakers - Born in the United States 93.3% of residents of Fruitville speak English at home.
2.6% of residents speak Spanish at home 183 79.2% Speak English very well48 20.8% Speak English less than very well4.2% of residents speak other language at home 370 100.0% Speak English very well
English speakers - Native, born elsewhere 66.1% of residents of Fruitville speak English at home.
36.2% of residents speak Spanish at home 7 11.1% Speak English very well56 88.9% Speak English less than very well
English speakers - Foreign-born 34.8% of residents of Fruitville speak English at home.
33.5% of residents speak Spanish at home 299 43.7% Speak English very well385 56.3% Speak English less than very well29.6% of residents speak other language at home 296 48.9% Speak English very well309 51.1% Speak English less than very well
White (Caucasian) - Speak only English Native:
95.5% (11,065)Foreign-born:
47.7% (415)
White (Caucasian) - Speak another language Native:
4.3% (500)Foreign-born:
52.0% (453)
Black or African American - Speak only English Native:
92.6% (290)Foreign-born:
100.0% (83)
American Indian / Alaska Native - Speak only English Native:
77.0% (76)Foreign-born:
41.0% (3)
Asian - Speak only English Native:
21.4% (8)Foreign-born:
19.5% (55)
Asian - Speak another language Native:
72.0% (28)Foreign-born:
80.6% (226)
Other race - Speak only English Native:
41.4% (206)Foreign-born:
49.2% (99)
Other race - Speak another language Native:
56.6% (281)Foreign-born:
59.0% (119)
Two or more races - Speak only English Native:
70.6% (541)Foreign-born:
12.9% (94)
Two or more races - Speak another language Native:
27.1% (208)Foreign-born:
86.0% (629)
White alone - Speak only English Native:
96.4% (11,041)Foreign-born:
54.5% (417)
White alone - Speak another language Native:
3.6% (418)Foreign-born:
42.3% (324)
Hispanic or Latino - Speak only English Native:
48.5% (467)Foreign-born:
10.0% (77)
Hispanic or Latino - Speak another language Native:
49.1% (473)Foreign-born:
87.9% (680)
Foreign-born residents in Fruitville 1,794 residents are foreign born (5.8% Latin America , 2.8% Europe , 1.6% Asia ).
This city:
11.1%Florida:
21.1%
Marital status for residents in Fruitville Marital status - White (Caucasian) population 15 years and over
Males 28.0% Never married55.5% Now married0.9% Separated3.6% Widowed12.0% DivorcedFemales 24.2% Never married46.3% Now married0.4% Separated15.4% Widowed13.7% DivorcedWomen who gave birth in the past 12 months Now married:
86.8% (128)Unmarried:
13.2% (19)
Women who did not give birth in the past 12 months Now married:
38.2% (927)Unmarried:
61.8% (1,501)
Marital status - Black or African American population 15 years and over
Males 85.6% Never married11.5% Now married0.0% Separated0.0% Widowed2.9% DivorcedFemales 18.1% Never married54.3% Now married0.0% Separated10.5% Widowed17.1% DivorcedWomen who gave birth in the past 12 months Now married:
100.0% (14)Unmarried:
0.0% (0)
Women who did not give birth in the past 12 months Now married:
30.2% (16)Unmarried:
69.8% (37)
Marital status - American Indian / Alaska Native population 15 years and over
Males 35.4% Never married45.8% Now married18.8% Separated0.0% Widowed0.0% DivorcedFemales 0.0% Never married33.3% Now married0.0% Separated0.0% Widowed66.7% DivorcedWomen who did not give birth in the past 12 months Now married:
100.0% (2)Unmarried:
0.0% (0)
Marital status - Asian population 15 years and over
Males 1.2% Never married68.2% Now married29.4% Separated0.0% Widowed1.2% DivorcedFemales 20.5% Never married59.5% Now married11.2% Separated0.0% Widowed8.8% DivorcedWomen who did not give birth in the past 12 months Now married:
62.3% (102)Unmarried:
37.7% (62)
Marital status - Other race population 15 years and over
Males 42.0% Never married29.5% Now married0.0% Separated0.0% Widowed28.5% DivorcedFemales 58.1% Never married29.9% Now married0.0% Separated0.0% Widowed12.0% DivorcedWomen who did not give birth in the past 12 months Now married:
14.9% (37)Unmarried:
85.1% (214)
Marital status - Two or more races population 15 years and over
Males 30.8% Never married67.3% Now married0.0% Separated0.7% Widowed1.2% DivorcedFemales 13.0% Never married60.0% Now married0.0% Separated6.3% Widowed20.6% DivorcedWomen who did not give birth in the past 12 months Now married:
89.5% (198)Unmarried:
10.5% (23)
Marital status - White alone, not Hispanic / Latino population 15 years and over
Males 27.3% Never married55.6% Now married1.0% Separated3.6% Widowed12.5% DivorcedFemales 23.3% Never married46.6% Now married0.4% Separated15.8% Widowed13.9% DivorcedWomen who gave birth in the past 12 months Now married:
86.8% (135)Unmarried:
13.2% (20)
Women who did not give birth in the past 12 months Now married:
37.8% (889)Unmarried:
62.2% (1,466)
Marital status - Hispanic or Latino population 15 years and over
Males 31.9% Never married59.8% Now married0.0% Separated1.7% Widowed6.5% DivorcedFemales 40.2% Never married42.8% Now married0.0% Separated5.7% Widowed11.4% DivorcedWomen who did not give birth in the past 12 months Now married:
43.1% (209)Unmarried:
56.9% (276)
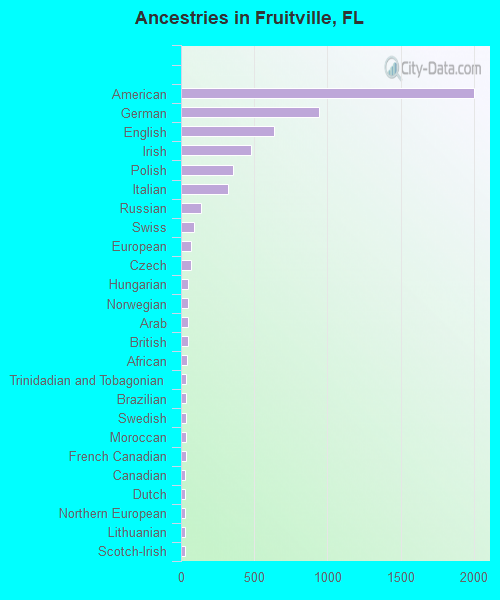
Ancestries in Fruitville
2,004 26.0% American946 12.3% German638 8.3% English476 6.2% Irish355 4.6% Polish322 4.2% Italian134 1.7% Russian86 1.1% Swiss66 0.9% European65 0.8% Czech48 0.6% Hungarian46 0.6% Norwegian45 0.6% Arab45 0.6% British43 0.6% African37 0.5% Trinidadian and Tobagonian34 0.4% Brazilian34 0.4% Swedish33 0.4% Moroccan33 0.4% French Canadian29 0.4% Canadian29 0.4% Dutch28 0.4% Northern European25 0.3% Lithuanian25 0.3% Scotch-Irish24 0.3% French24 0.3% Scottish24 0.3% Slovak23 0.3% Australian20 0.3% Danish20 0.3% Jamaican15 0.2% Guyanese11 0.1% Austrian9 0.1% Welsh8 0.1% Scandinavian7 0.09% Armenian3 0.04% Icelander
Geographical mobility in Fruitville Same house 1 year ago 10,438 80.2% White (Caucasian)229 56.8% Black or African American70 58.3% American Indian / Alaska Native199 62.9% Asian645 89.5% Other race1,377 84.0% Two or more races10,280 80.3% White alone, not Hispanic / Latino1,520 81.5% Hispanic or LatinoMoved within same county 908 7.0% White / Caucasian53 13.0% Black or African American96 30.5% Asian13 1.8% Other race90 5.5% Two or more races892 7.0% White alone, not Hispanic / Latino141 7.6% Hispanic or LatinoMoved within same state 1,064 8.2% White / Caucasian102 25.2% Black or African American1 0.3% Asian36 4.9% Other race32 1.9% Two or more races1,062 8.3% White alone, not Hispanic / Latino65 3.5% Hispanic or LatinoMoved from different state 598 4.6% White / Caucasian51 12.6% Black or African American41 34.1% American Indian / Alaska Native583 4.5% White alone, not Hispanic / Latino16 0.9% Hispanic or LatinoMoved from abroad 16 0.1% White4 1.4% Asian56 3.4% Two or more races17 0.1% White alone, not Hispanic / Latino80 4.3% Hispanic or Latino
Children Nativity (place of birth) in Fruitville
Children under 6 years - Living with two parents Both parents native 580 100.0% NativeBoth parents foreign-born 112 100.0% NativeOne native, one foreign-born parent 209 100.0% NativeChildren under 6 years - Living with one parent Native parent 126 100.0% NativeChildren 6 to 17 years - Living with two parents Both parents native 714 99.8% Native2 0.2% Foreign-bornBoth parents foreign-born 134 100.0% NativeOne native, one foreign-born parent 65 74.3% Native23 25.7% Foreign-bornChildren 6 to 17 years - Living with one parent Native parent 466 99.4% Native3 0.6% Foreign-bornForeign-born parent 11 54.4% Native10 45.6% Foreign-born
Grandparents responsible for own grandchildren in Fruitville
Grandparents (30 to 59 years) White / Caucasian 18 100.0% Not responsible for grandchildrenAsian 49 100.0% Not responsible for grandchildrenTwo or more races 56 100.0% Not responsible for grandchildrenWhite alone, not Hispanic / Latino 21 100.0% Not responsible for grandchildrenHispanic or Latino 32 100.0% Not responsible for grandchildren
Grandparents (60 years and over) White / Caucasian 36 100.0% Not responsible for grandchildrenTwo or more races 91 100.0% Not responsible for grandchildrenWhite alone, not Hispanic / Latino 34 100.0% Not responsible for grandchildrenHispanic or Latino 62 100.0% Not responsible for grandchildren