Races in Franconia, Virginia (VA) Detailed Stats
Data:
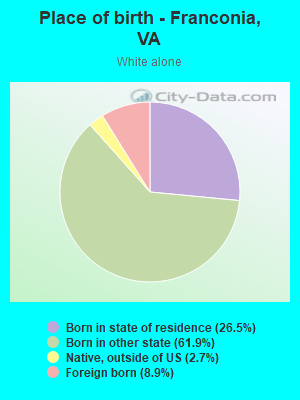
Races - White alone (%)
Races - White alone (% change since 2000)
Races - Black alone (%)
Races - Black alone (% change since 2000)
Races - American Indian alone (%)
Races - American Indian alone (% change since 2000)
Races - Asian alone (%)
Races - Asian alone (% change since 2000)
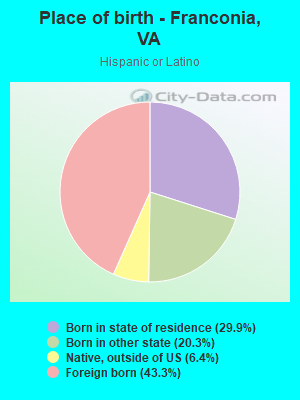
Races - Hispanic (%)
Races - Hispanic (% change since 2000)
Races - Native Hawaiian and Other Pacific Islander alone (%)
Races - Native Hawaiian and Other Pacific Islander alone (% change since 2000)
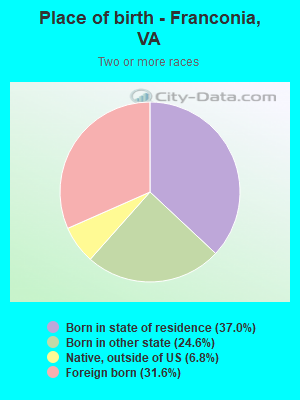
Races - Two or more races(%)
Races - Two or more races(% change since 2000)
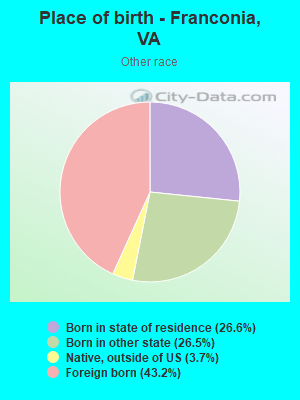
Races - Other race alone (%)
Races - Other race alone (% change since 2000)
Racial diversity
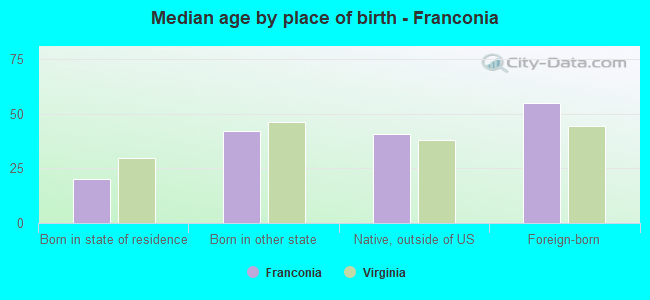
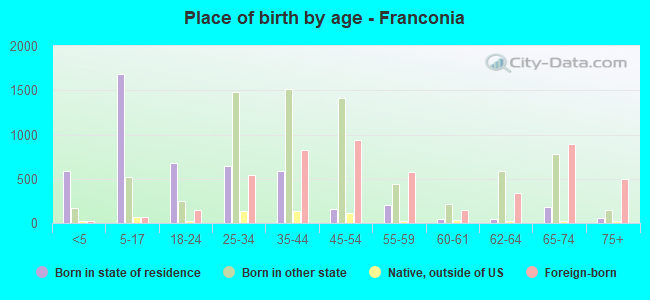
Place of birth - Born in state of residence (%)
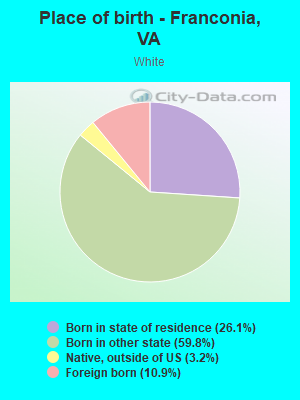
Place of birth - Born in state of residence (%) - White
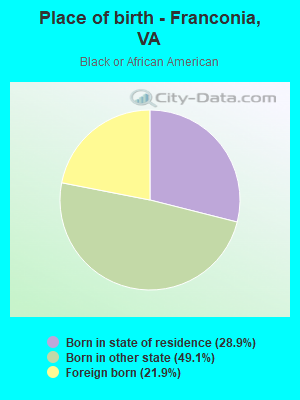
Place of birth - Born in state of residence (%) - Black or African American
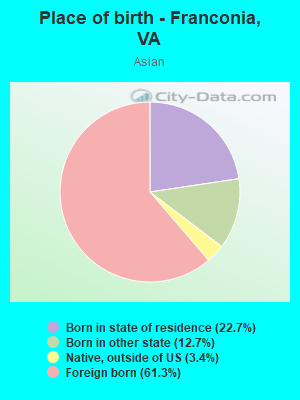
Place of birth - Born in state of residence (%) - Asian
Place of birth - Born in state of residence (%) - Hispanic or Latino
Place of birth - Born in state of residence (%) - American Indian and Alaska Native
Place of birth - Born in state of residence (%) - Multirace
Place of birth - Born in state of residence (%) - Other Race
Place of birth - Born in other state (%)
Place of birth - Born in other state (%) - White
Place of birth - Born in other state (%) - Black or African American
Place of birth - Born in other state (%) - Asian
Place of birth - Born in other state (%) - Hispanic or Latino
Place of birth - Born in other state (%) - American Indian and Alaska Native
Place of birth - Born in other state (%) - Multirace
Place of birth - Born in other state (%) - Other Race
Place of birth - Native, outside of US (%)
Place of birth - Native, outside of US (%) - White
Place of birth - Native, outside of US (%) - Black or African American
Place of birth - Native, outside of US (%) - Asian
Place of birth - Native, outside of US (%) - Hispanic or Latino
Place of birth - Native, outside of US (%) - American Indian and Alaska Native
Place of birth - Native, outside of US (%) - Multirace
Place of birth - Native, outside of US (%) - Other Race
Place of birth - Foreign born (%)
Place of birth - Foreign born (%) - White
Place of birth - Foreign born (%) - Black or African American
Place of birth - Foreign born (%) - Asian
Place of birth - Foreign born (%) - Hispanic or Latino
Place of birth - Foreign born (%) - American Indian and Alaska Native
Place of birth - Foreign born (%) - Multirace
Place of birth - Foreign born (%) - Other Race
Residents speaking English at home (%)
Residents speaking English at home - Born in the United States (%)
Residents speaking English at home - Native, born elsewhere (%)
Residents speaking English at home - Foreign born (%)
Residents speaking Spanish at home (%)
Residents speaking Spanish at home - Born in the United States (%)
Residents speaking Spanish at home - Native, born elsewhere (%)
Residents speaking Spanish at home - Foreign born (%)
Residents speaking other language at home (%)
Residents speaking other language at home - Born in the United States (%)
Residents speaking other language at home - Native, born elsewhere (%)
Residents speaking other language at home - Foreign born (%)
Marital status - Never married (%)
Marital status - Now married (%)
Marital status - Separated (%)
Marital status - Widowed (%)
Marital status - Divorced (%)
Ancestries Reported - Arab (%)
Ancestries Reported - Czech (%)
Ancestries Reported - Danish (%)
Ancestries Reported - Dutch (%)
Ancestries Reported - English (%)
Ancestries Reported - French (%)
Ancestries Reported - French Canadian (%)
Ancestries Reported - German (%)
Ancestries Reported - Greek (%)
Ancestries Reported - Hungarian (%)
Ancestries Reported - Irish (%)
Ancestries Reported - Italian (%)
Ancestries Reported - Lithuanian (%)
Ancestries Reported - Norwegian (%)
Ancestries Reported - Polish (%)
Ancestries Reported - Portuguese (%)
Ancestries Reported - Russian (%)
Ancestries Reported - Scotch-Irish (%)
Ancestries Reported - Scottish (%)
Ancestries Reported - Slovak (%)
Ancestries Reported - Subsaharan African (%)
Ancestries Reported - Swedish (%)
Ancestries Reported - Swiss (%)
Ancestries Reported - Ukrainian (%)
Ancestries Reported - United States (%)
Ancestries Reported - Welsh (%)
Ancestries Reported - West Indian (%)
Ancestries Reported - Other (%)
Geographical mobility - Same house 1 year ago (%)
Geographical mobility - Same house 1 year ago (%) - White
Geographical mobility - Same house 1 year ago (%) - Black or African American
Geographical mobility - Same house 1 year ago (%) - Asian
Geographical mobility - Same house 1 year ago (%) - Hispanic or Latino
Geographical mobility - Same house 1 year ago (%) - American Indian and Alaska Native
Geographical mobility - Same house 1 year ago (%) - Multirace
Geographical mobility - Same house 1 year ago (%) - Other Race
Geographical mobility - Moved within same county (%)
Geographical mobility - Moved within same county (%) - White
Geographical mobility - Moved within same county (%) - Black or African American
Geographical mobility - Moved within same county (%) - Asian
Geographical mobility - Moved within same county (%) - Hispanic or Latino
Geographical mobility - Moved within same county (%) - American Indian and Alaska Native
Geographical mobility - Moved within same county (%) - Multirace
Geographical mobility - Moved within same county (%) - Other Race
Geographical mobility - Moved from different county within same state (%)
Geographical mobility - Moved from different county within same state (%) - White
Geographical mobility - Moved from different county within same state (%) - Black or African American
Geographical mobility - Moved from different county within same state (%) - Asian
Geographical mobility - Moved from different county within same state (%) - Hispanic or Latino
Geographical mobility - Moved from different county within same state (%) - American Indian and Alaska Native
Geographical mobility - Moved from different county within same state (%) - Multirace
Geographical mobility - Moved from different county within same state (%) - Other Race
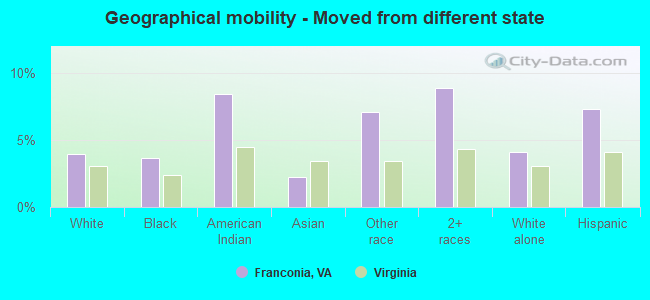
Geographical mobility - Moved from different state (%)
Geographical mobility - Moved from different state (%) - White
Geographical mobility - Moved from different state (%) - Black or African American
Geographical mobility - Moved from different state (%) - Asian
Geographical mobility - Moved from different state (%) - Hispanic or Latino
Geographical mobility - Moved from different state (%) - American Indian and Alaska Native
Geographical mobility - Moved from different state (%) - Multirace
Geographical mobility - Moved from different state (%) - Other Race
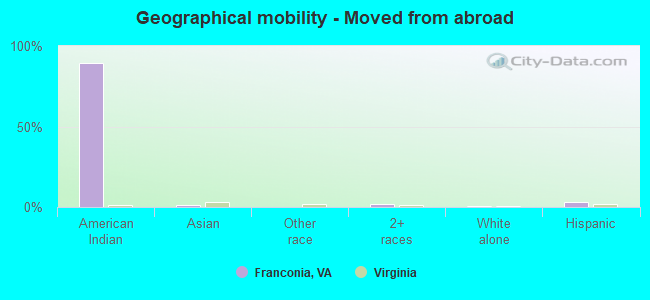
Geographical mobility - Moved from abroad (%)
Geographical mobility - Moved from abroad (%) - White
Geographical mobility - Moved from abroad (%) - Black or African American
Geographical mobility - Moved from abroad (%) - Asian
Geographical mobility - Moved from abroad (%) - Hispanic or Latino
Geographical mobility - Moved from abroad (%) - American Indian and Alaska Native
Geographical mobility - Moved from abroad (%) - Multirace
Geographical mobility - Moved from abroad (%) - Other Race
Place of birth for the foreign-born population - Ireland (%)
Place of birth for the foreign-born population - Denmark (%)
Place of birth for the foreign-born population - Norway (%)
Place of birth for the foreign-born population - Sweden (%)
Place of birth for the foreign-born population - United Kingdom (%)
Place of birth for the foreign-born population - England (%)
Place of birth for the foreign-born population - Scotland (%)
Place of birth for the foreign-born population - Other Northern Europe (%)
Place of birth for the foreign-born population - Austria (%)
Place of birth for the foreign-born population - Belgium (%)
Place of birth for the foreign-born population - France (%)
Place of birth for the foreign-born population - Germany (%)
Place of birth for the foreign-born population - Netherlands (%)
Place of birth for the foreign-born population - Switzerland (%)
Place of birth for the foreign-born population - Other Western Europe (%)
Place of birth for the foreign-born population - Greece (%)
Place of birth for the foreign-born population - Italy (%)
Place of birth for the foreign-born population - Portugal (%)
Place of birth for the foreign-born population - Spain (%)
Place of birth for the foreign-born population - Other Southern Europe (%)
Place of birth for the foreign-born population - Albania (%)
Place of birth for the foreign-born population - Belarus (%)
Place of birth for the foreign-born population - Bosnia and Herzegovina (%)
Place of birth for the foreign-born population - Bulgaria (%)
Place of birth for the foreign-born population - Croatia (%)
Place of birth for the foreign-born population - Czechoslovakia (%)
Place of birth for the foreign-born population - Hungary (%)
Place of birth for the foreign-born population - Latvia (%)
Place of birth for the foreign-born population - Lithuania (%)
Place of birth for the foreign-born population - North Macedonia (Macedonia) (%)
Place of birth for the foreign-born population - Moldova (%)
Place of birth for the foreign-born population - Poland (%)
Place of birth for the foreign-born population - Romania (%)
Place of birth for the foreign-born population - Russia (%)
Place of birth for the foreign-born population - Serbia (%)
Place of birth for the foreign-born population - Ukraine (%)
Place of birth for the foreign-born population - Other Eastern Europe (%)
Place of birth for the foreign-born population - China (%)
Place of birth for the foreign-born population - Hong Kong (%)
Place of birth for the foreign-born population - Taiwan (%)
Place of birth for the foreign-born population - Japan (%)
Place of birth for the foreign-born population - Korea (%)
Place of birth for the foreign-born population - Other Eastern Asia (%)
Place of birth for the foreign-born population - Afghanistan (%)
Place of birth for the foreign-born population - Bangladesh (%)
Place of birth for the foreign-born population - India (%)
Place of birth for the foreign-born population - Iran (%)
Place of birth for the foreign-born population - Kazakhstan (%)
Place of birth for the foreign-born population - Nepal (%)
Place of birth for the foreign-born population - Pakistan (%)
Place of birth for the foreign-born population - Sri Lanka (%)
Place of birth for the foreign-born population - Uzbekistan (%)
Place of birth for the foreign-born population - Other South Central Asia (%)
Place of birth for the foreign-born population - Burma (%)
Place of birth for the foreign-born population - Cambodia (%)
Place of birth for the foreign-born population - Indonesia (%)
Place of birth for the foreign-born population - Laos (%)
Place of birth for the foreign-born population - Malaysia (%)
Place of birth for the foreign-born population - Philippines (%)
Place of birth for the foreign-born population - Singapore (%)
Place of birth for the foreign-born population - Thailand (%)
Place of birth for the foreign-born population - Vietnam (%)
Place of birth for the foreign-born population - Other South Eastern Asia (%)
Place of birth for the foreign-born population - Armenia (%)
Place of birth for the foreign-born population - Iraq (%)
Place of birth for the foreign-born population - Israel (%)
Place of birth for the foreign-born population - Jordan (%)
Place of birth for the foreign-born population - Kuwait (%)
Place of birth for the foreign-born population - Lebanon (%)
Place of birth for the foreign-born population - Saudi Arabia (%)
Place of birth for the foreign-born population - Syria (%)
Place of birth for the foreign-born population - Turkey (%)
Place of birth for the foreign-born population - Yemen (%)
Place of birth for the foreign-born population - Other Western Asia (%)
Place of birth for the foreign-born population - Eritrea (%)
Place of birth for the foreign-born population - Ethiopia (%)
Place of birth for the foreign-born population - Kenya (%)
Place of birth for the foreign-born population - Somalia (%)
Place of birth for the foreign-born population - Uganda (%)
Place of birth for the foreign-born population - Zimbabwe (%)
Place of birth for the foreign-born population - Other Eastern Africa (%)
Place of birth for the foreign-born population - Cameroon (%)
Place of birth for the foreign-born population - Congo (%)
Place of birth for the foreign-born population - Democratic Republic of Congo (Zaire) (%)
Place of birth for the foreign-born population - Other Middle Africa (%)
Place of birth for the foreign-born population - Egypt (%)
Place of birth for the foreign-born population - Morocco (%)
Place of birth for the foreign-born population - Sudan (%)
Place of birth for the foreign-born population - Other Northern Africa (%)
Place of birth for the foreign-born population - South Africa (%)
Place of birth for the foreign-born population - Other Southern Africa (%)
Place of birth for the foreign-born population - Cabo Verde (%)
Place of birth for the foreign-born population - Ghana (%)
Place of birth for the foreign-born population - Liberia (%)
Place of birth for the foreign-born population - Nigeria (%)
Place of birth for the foreign-born population - Senegal (%)
Place of birth for the foreign-born population - Sierra Leone (%)
Place of birth for the foreign-born population - Other Western Africa (%)
Place of birth for the foreign-born population - Australia (%)
Place of birth for the foreign-born population - New Zealand (%)
Place of birth for the foreign-born population - Fiji (%)
Place of birth for the foreign-born population - Micronesia (%)
Place of birth for the foreign-born population - Bahamas (%)
Place of birth for the foreign-born population - Barbados (%)
Place of birth for the foreign-born population - Cuba (%)
Place of birth for the foreign-born population - Dominica (%)
Place of birth for the foreign-born population - Dominican Republic (%)
Place of birth for the foreign-born population - Grenada (%)
Place of birth for the foreign-born population - Haiti (%)
Place of birth for the foreign-born population - Jamaica (%)
Place of birth for the foreign-born population - St. Vincent and the Grenadines (%)
Place of birth for the foreign-born population - Trinidad and Tobago (%)
Place of birth for the foreign-born population - West Indies (%)
Place of birth for the foreign-born population - Other Caribbean (%)
Place of birth for the foreign-born population - Belize (%)
Place of birth for the foreign-born population - Costa Rica (%)
Place of birth for the foreign-born population - El Salvador (%)
Place of birth for the foreign-born population - Guatemala (%)
Place of birth for the foreign-born population - Honduras (%)
Place of birth for the foreign-born population - Mexico (%)
Place of birth for the foreign-born population - Nicaragua (%)
Place of birth for the foreign-born population - Panama (%)
Place of birth for the foreign-born population - Other Central America (%)
Place of birth for the foreign-born population - Argentina (%)
Place of birth for the foreign-born population - Bolivia (%)
Place of birth for the foreign-born population - Brazil (%)
Place of birth for the foreign-born population - Chile (%)
Place of birth for the foreign-born population - Colombia (%)
Place of birth for the foreign-born population - Ecuador (%)
Place of birth for the foreign-born population - Guyana (%)
Place of birth for the foreign-born population - Peru (%)
Place of birth for the foreign-born population - Uruguay (%)
Place of birth for the foreign-born population - Venezuela (%)
Place of birth for the foreign-born population - Other South America (%)
Place of birth for the foreign-born population - Canada (%)
Place of birth for the foreign-born population - Other Northern America (%)
Place of birth for the foreign-born population - Other (%)
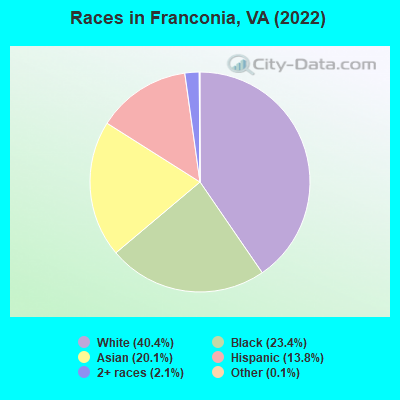
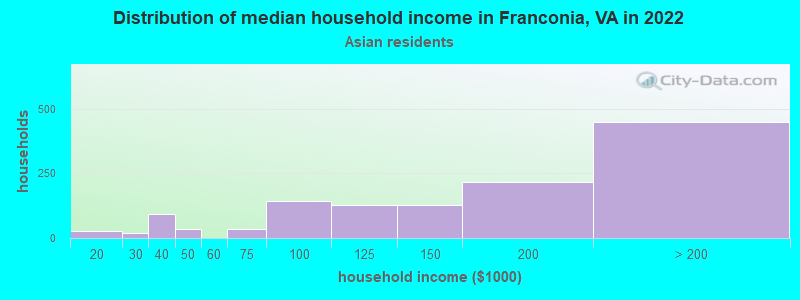
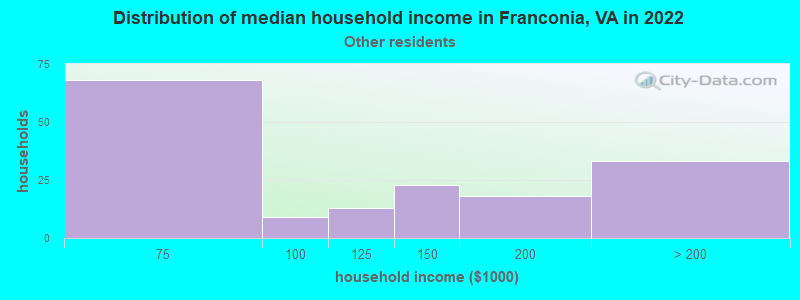
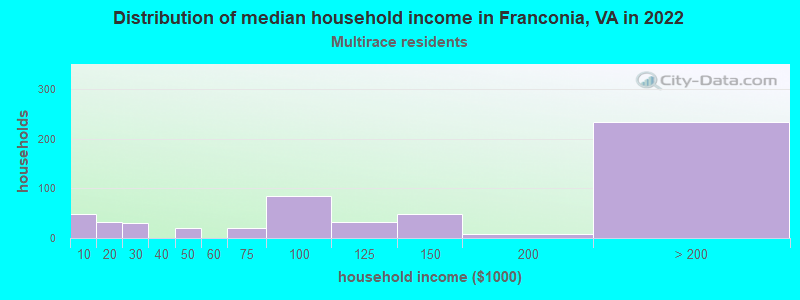
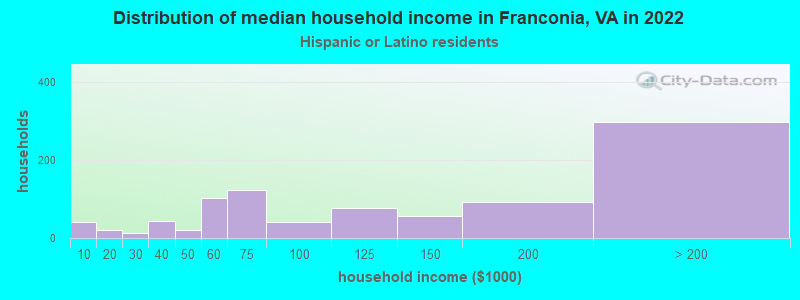
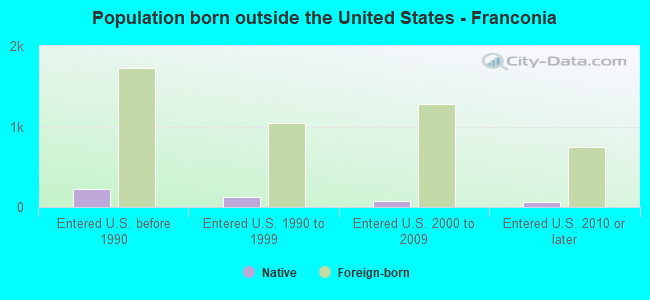
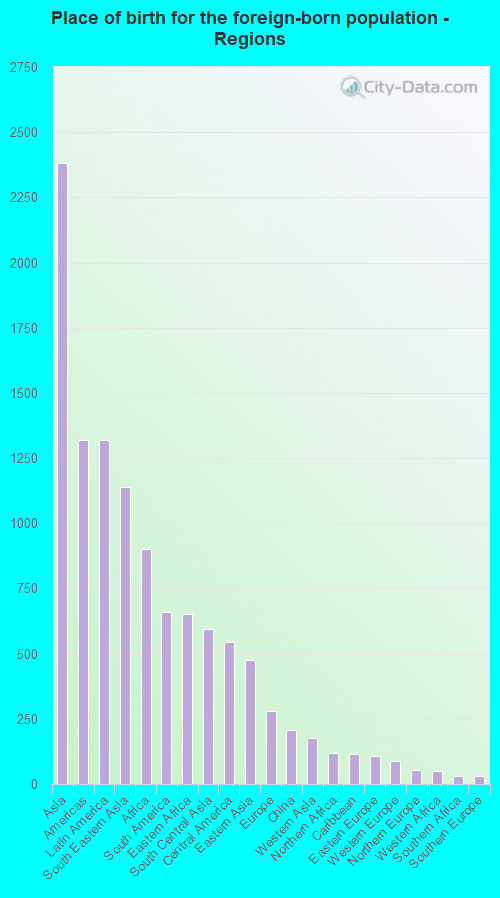
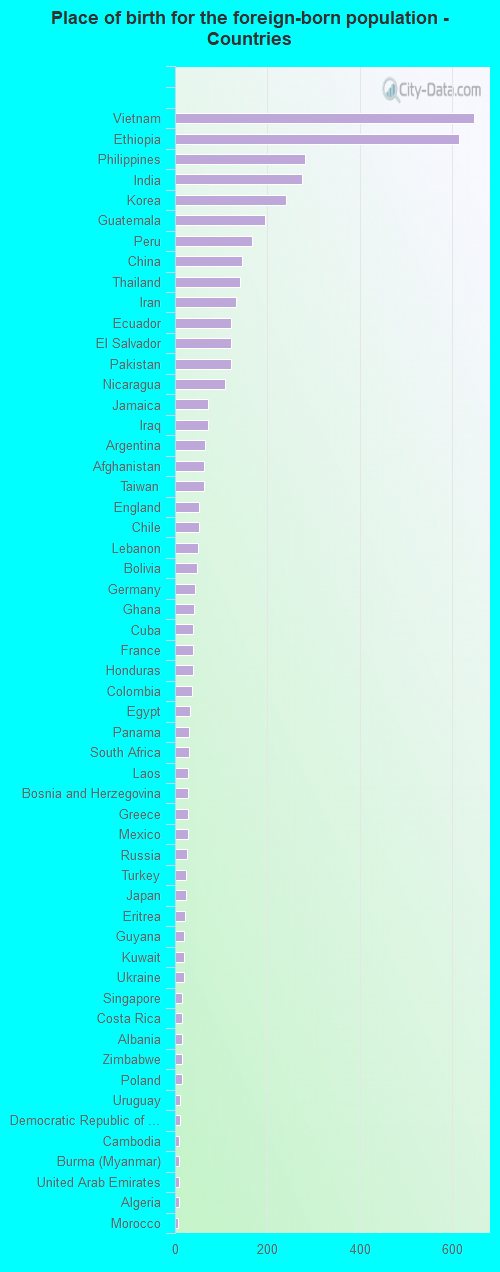
According to 2022 data, the most numerous races in Franconia, VA are White alone (7,190 residents), Black alone (4,160 residents), and Hispanic (2,447 residents). 65.6% of Franconia residents speak English at home. 27.5% of Franconia, VA residents are foreign-born (13.4% born in Asia, 7.4% born in Latin America, 5.1% born in Africa), which is 56.3% greater than the foreign-born rate of 12.0% across the entire state of Virginia.
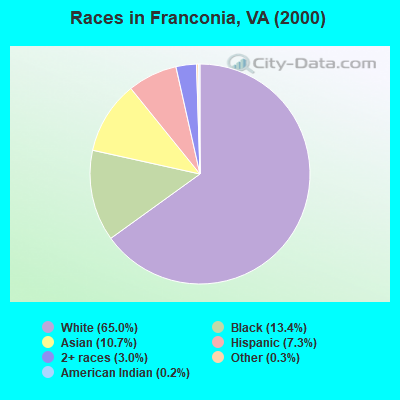
Race distribution in Franconia
2000 2022
4,965,637 70.2% White alone 1,376,378 19.4% Black alone 329,540 4.7% Hispanic 259,277 3.7% Asian alone 114,022 1.6% Two or more races 18,596 0.3% American Indian alone 11,685 0.2% Other race alone 3,380 0.05% Native Hawaiian and Other
5,095,130 58.7% White alone 1,594,785 18.4% Black alone 905,750 10.4% Hispanic 602,881 6.9% Asian alone 406,047 4.7% Two or more races 60,419 0.7% Other race alone 11,738 0.1% American Indian alone 6,869 0.08% Native Hawaiian and Other
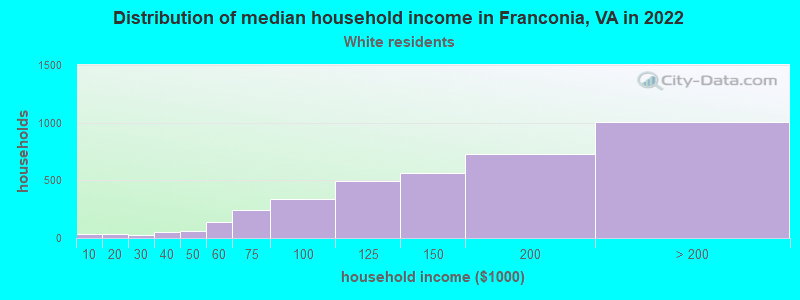
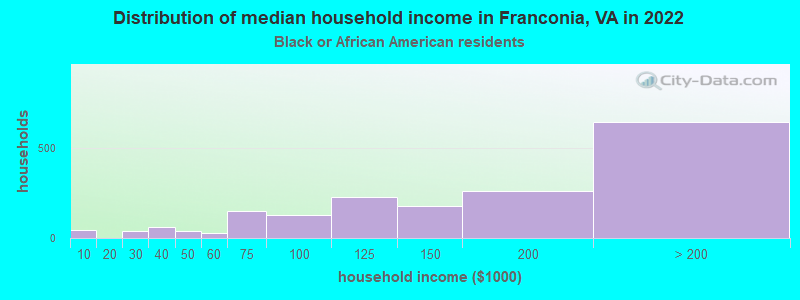
Income and house value in Franconia Median household income in 2022 $140,871 White non-Hispanic householders$150,867 Black householders$152,466 Asian householders$139,249 Some other race householders$129,445 Two or more races householders$121,170 Hispanic or Latino race householdersMedian 2022 house value $586,625 White Non-Hispanic householders$537,516 Black or African American householders$632,460 American Indian or Alaska Native householders $518,468 Asian householders$736,630 Native Hawaiian and other Pacific Islander householders$551,803 Some other race householders$437,811 Two or more races householders$506,861 Hispanic or Latino householders
Median age by race in Franconia
40.5 Median age for White residents40.5 40.3 50.5 Median age for Black or African American residents47.8 52.1 52.4 Median age for American Indian / Alaska Native residents71.0 46.4 42.5 Median age for Asian residents40.4 47.8 -666,666,666.0 Median age for Native Hawaiian / Pacific Islander residents-558,791,801.0 -584,518,166.9 37.0 Median age for Other race residents35.0 40.3 33.6 Median age for Two or more races residents17.7 40.0 39.7 Median age for White alone residents39.8 39.5 37.0 Median age for Hispanic or Latino residents36.4 39.2
Owner/renter occupied households by race in Franconia
House owners and renters - White residents 2,701 72.0% Owner occupied1,049 28.0% Renter occupiedHouse owners and renters - Black or African American residents 1,299 78.2% Owner occupied363 21.8% Renter occupiedHouse owners and renters - American Indian / Alaska Native residents 21 100.0% Renter occupiedHouse owners and renters - Asian residents 1,092 86.8% Owner occupied166 13.2% Renter occupiedHouse owners and renters - Other race residents 119 77.7% Owner occupied34 22.3% Renter occupiedHouse owners and renters - Two or more races residents 377 66.0% Owner occupied194 34.0% Renter occupiedHouse owners and renters - White alone residents 2,513 71.6% Owner occupied996 28.4% Renter occupiedHouse owners and renters - Hispanic or Latino residents 605 67.5% Owner occupied291 32.5% Renter occupied
Language usage in Franconia
English speakers - Total 65.6% of residents of Franconia speak English at home.
9.8% of residents speak Spanish at home 1,069 63.8% Speak English very well606 36.2% Speak English less than very well24.6% of residents speak other language at home 2,991 71.2% Speak English very well1,212 28.8% Speak English less than very well
English speakers - Born in the United States 87.3% of residents of Franconia speak English at home.
3.3% of residents speak Spanish at home 218 88.6% Speak English very well28 11.4% Speak English less than very well8.9% of residents speak other language at home 616 93.1% Speak English very well46 6.9% Speak English less than very well
English speakers - Native, born elsewhere 65.1% of residents of Franconia speak English at home.
17.4% of residents speak Spanish at home 86 100.0% Speak English very well16.6% of residents speak other language at home 82 100.0% Speak English very well
English speakers - Foreign-born 18.1% of residents of Franconia speak English at home.
21.7% of residents speak Spanish at home 483 45.5% Speak English very well579 54.5% Speak English less than very well60.5% of residents speak other language at home 1,847 62.4% Speak English very well1,112 37.6% Speak English less than very well
White (Caucasian) - Speak only English Native:
89.9% (5,774)Foreign-born:
26.8% (222)
White (Caucasian) - Speak another language Native:
9.1% (584)Foreign-born:
73.6% (611)
Black or African American - Speak only English Native:
93.4% (2,965)Foreign-born:
26.6% (243)
Black or African American - Speak another language Native:
5.5% (174)Foreign-born:
74.0% (678)
Asian - Speak only English Native:
45.5% (600)Foreign-born:
16.7% (370)
Asian - Speak another language Native:
54.9% (725)Foreign-born:
83.7% (1,849)
Other race - Speak only English Native:
47.5% (115)Foreign-born:
15.9% (34)
Other race - Speak another language Native:
53.8% (130)Foreign-born:
85.8% (181)
Two or more races - Speak only English Native:
81.5% (730)Foreign-born:
3.3% (18)
Two or more races - Speak another language Native:
17.9% (160)Foreign-born:
96.8% (526)
White alone - Speak only English Native:
89.4% (5,597)Foreign-born:
26.7% (170)
White alone - Speak another language Native:
10.0% (627)Foreign-born:
73.1% (466)
Hispanic or Latino - Speak only English Native:
71.7% (801)Foreign-born:
9.7% (103)
Hispanic or Latino - Speak another language Native:
32.7% (366)Foreign-born:
90.4% (961)
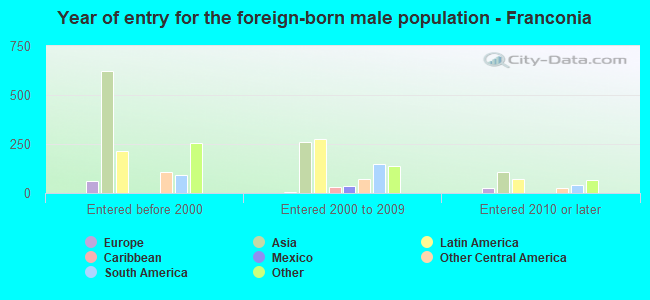
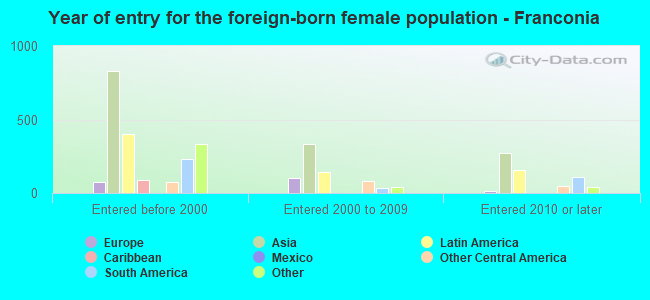
Foreign-born residents in Franconia 4,886 residents are foreign born (13.4% Asia , 7.4% Latin America , 5.1% Africa ).
This city:
27.5%Virginia:
12.6%
Marital status for residents in Franconia Marital status - White (Caucasian) population 15 years and over
Males 35.0% Never married53.1% Now married1.9% Separated0.4% Widowed9.6% DivorcedFemales 36.5% Never married47.5% Now married1.5% Separated4.8% Widowed9.8% DivorcedWomen who gave birth in the past 12 months Now married:
93.1% (119)Unmarried:
6.9% (9)
Women who did not give birth in the past 12 months Now married:
40.6% (831)Unmarried:
59.4% (1,216)
Marital status - Black or African American population 15 years and over
Males 41.9% Never married52.2% Now married0.8% Separated1.6% Widowed3.6% DivorcedFemales 30.7% Never married52.6% Now married1.0% Separated2.8% Widowed12.9% DivorcedWomen who did not give birth in the past 12 months Now married:
36.4% (295)Unmarried:
63.6% (517)
Marital status - American Indian / Alaska Native population 15 years and over
Males 29.3% Never married70.7% Now married0.0% Separated0.0% Widowed0.0% DivorcedFemales 0.0% Never married100.0% Now married0.0% Separated0.0% Widowed0.0% DivorcedWomen who did not give birth in the past 12 months Now married:
100.0% (14)Unmarried:
0.0% (0)
Marital status - Asian population 15 years and over
Males 36.7% Never married51.5% Now married5.2% Separated1.7% Widowed4.8% DivorcedFemales 19.4% Never married53.5% Now married0.5% Separated13.8% Widowed12.9% DivorcedWomen who did not give birth in the past 12 months Now married:
51.7% (403)Unmarried:
48.3% (376)
Marital status - Other race population 15 years and over
Males 53.3% Never married46.7% Now married0.0% Separated0.0% Widowed0.0% DivorcedFemales 17.7% Never married55.5% Now married0.0% Separated0.0% Widowed26.8% DivorcedWomen who gave birth in the past 12 months Now married:
0.0% (0)Unmarried:
100.0% (15)
Women who did not give birth in the past 12 months Now married:
64.2% (75)Unmarried:
35.8% (42)
Marital status - Two or more races population 15 years and over
Males 21.9% Never married67.4% Now married3.5% Separated3.7% Widowed3.5% DivorcedFemales 33.2% Never married40.5% Now married6.3% Separated8.6% Widowed11.4% DivorcedWomen who did not give birth in the past 12 months Now married:
43.7% (156)Unmarried:
56.3% (202)
Marital status - White alone, not Hispanic / Latino population 15 years and over
Males 36.1% Never married51.8% Now married2.1% Separated0.5% Widowed9.5% DivorcedFemales 37.3% Never married46.1% Now married1.6% Separated4.8% Widowed10.1% DivorcedWomen who gave birth in the past 12 months Now married:
93.1% (130)Unmarried:
6.9% (10)
Women who did not give birth in the past 12 months Now married:
39.7% (780)Unmarried:
60.3% (1,185)
Marital status - Hispanic or Latino population 15 years and over
Males 29.8% Never married63.3% Now married0.0% Separated1.4% Widowed5.5% DivorcedFemales 25.0% Never married55.9% Now married1.4% Separated3.9% Widowed13.7% DivorcedWomen who gave birth in the past 12 months Now married:
0.0% (0)Unmarried:
100.0% (12)
Women who did not give birth in the past 12 months Now married:
53.4% (294)Unmarried:
46.6% (257)
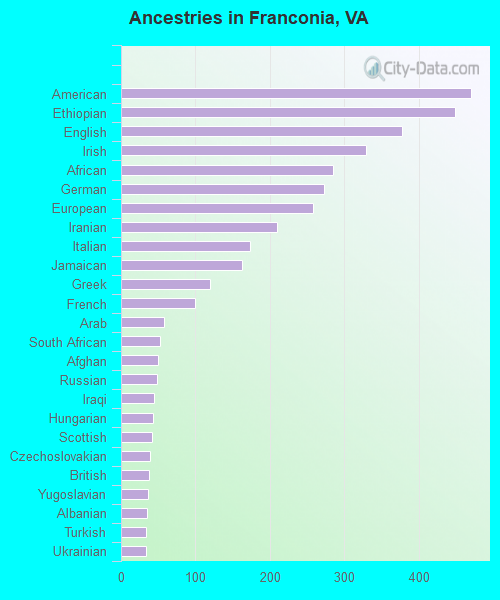
Ancestries in Franconia
471 4.8% American449 4.6% Ethiopian377 3.9% English329 3.4% Irish285 2.9% African273 2.8% German258 2.7% European210 2.2% Iranian174 1.8% Italian162 1.7% Jamaican119 1.2% Greek100 1.0% French58 0.6% Arab53 0.5% South African50 0.5% Afghan49 0.5% Russian45 0.5% Iraqi43 0.4% Hungarian41 0.4% Scottish39 0.4% Czechoslovakian38 0.4% British36 0.4% Yugoslavian35 0.4% Albanian34 0.3% Turkish33 0.3% Ukrainian30 0.3% Sudanese29 0.3% Barbadian28 0.3% Lebanese27 0.3% Polish23 0.2% Romanian18 0.2% Scotch-Irish18 0.2% Portuguese18 0.2% Norwegian17 0.2% Swedish16 0.2% Lithuanian14 0.1% Eastern European14 0.1% Serbian13 0.1% Austrian12 0.1% Armenian11 0.1% Dutch11 0.1% Slovak9 0.09% Danish7 0.07% Nigerian7 0.07% Zimbabwean6 0.06% Slovene4 0.04% Ghanaian2 0.02% Brazilian2 0.02% Swiss1 0.01% Northern European
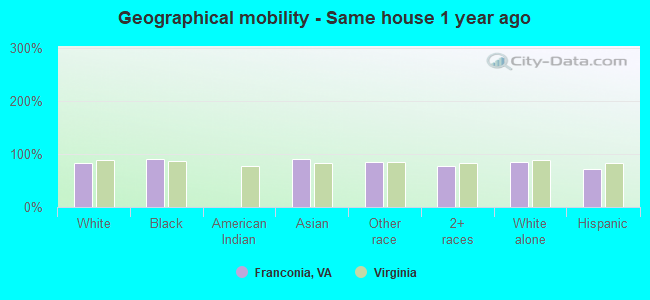
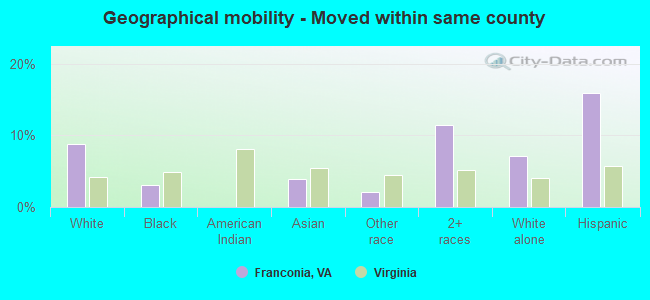
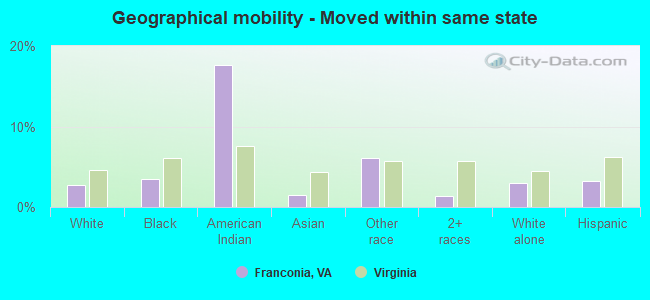
Geographical mobility in Franconia Same house 1 year ago 6,279 83.7% White (Caucasian)3,765 89.7% Black or African American3,257 90.6% Asian394 85.8% Other race1,256 76.7% Two or more races6,042 85.0% White alone, not Hispanic / Latino1,724 72.3% Hispanic or LatinoMoved within same county 661 8.8% White / Caucasian128 3.0% Black or African American140 3.9% Asian10 2.2% Other race188 11.5% Two or more races507 7.1% White alone, not Hispanic / Latino381 16.0% Hispanic or LatinoMoved within same state 202 2.7% White / Caucasian147 3.5% Black or African American14 17.6% American Indian / Alaska Native51 1.4% Asian28 6.1% Other race23 1.4% Two or more races214 3.0% White alone, not Hispanic / Latino78 3.3% Hispanic or LatinoMoved from different state 296 3.9% White / Caucasian152 3.6% Black or African American7 8.4% American Indian / Alaska Native81 2.3% Asian33 7.1% Other race145 8.9% Two or more races290 4.1% White alone, not Hispanic / Latino175 7.3% Hispanic or LatinoMoved from abroad 56 0.7% White74 89.7% American Indian / Alaska Native45 1.3% Asian26 1.6% Two or more races54 0.8% White alone, not Hispanic / Latino72 3.0% Hispanic or Latino
Children Nativity (place of birth) in Franconia
Children under 6 years - Living with two parents Both parents native 520 100.0% NativeBoth parents foreign-born 138 100.0% NativeOne native, one foreign-born parent 166 100.0% NativeChildren under 6 years - Living with one parent Native parent 119 100.0% NativeForeign-born parent 7 100.0% NativeChildren 6 to 17 years - Living with two parents Both parents native 861 100.0% NativeBoth parents foreign-born 473 88.8% Native60 11.2% Foreign-bornOne native, one foreign-born parent 179 100.0% NativeChildren 6 to 17 years - Living with one parent Native parent 288 100.0% NativeForeign-born parent 284 51.9% Native263 48.1% Foreign-born
Grandparents responsible for own grandchildren in Franconia
Grandparents (30 to 59 years) White / Caucasian 7 100.0% Not responsible for grandchildrenOther race 17 32.3% Responsible for grandchildren36 67.7% Not responsible for grandchildrenWhite alone, not Hispanic / Latino 16 100.0% Not responsible for grandchildrenHispanic or Latino 14 38.9% Responsible for grandchildren21 61.1% Not responsible for grandchildrenGrandparents (60 years and over) White / Caucasian 4 9.4% Responsible for grandchildren39 90.6% Not responsible for grandchildrenOther race 10 21.1% Responsible for grandchildren38 78.9% Not responsible for grandchildrenWhite alone, not Hispanic / Latino 4 11.3% Responsible for grandchildren34 88.7% Not responsible for grandchildrenHispanic or Latino 23 24.6% Responsible for grandchildren71 75.4% Not responsible for grandchildren