Races in Fort Riley North, Kansas (KS) Detailed Stats
Ancestries, Foreign-born residents, place of birth

Discuss Fort Riley North, Kansas races on our local forum with over 2,400,000 registered users
7.1% of Fort Riley North, KS residents are foreign-born (3.1% born in Europe, 2.5% born in Latin America, 1.4% born in Asia), which is about the same as the foreign-born rate of 7.0% across the entire state of Kansas.
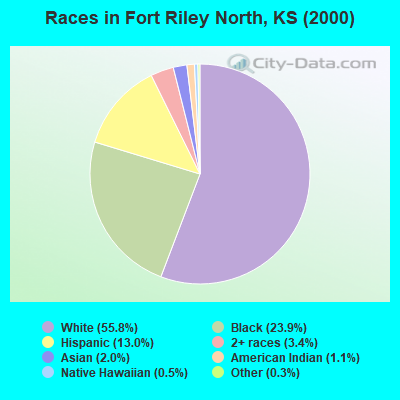
Race distribution in Fort Riley North

- 4,52455.8%White alone
- 1,94223.9%Black alone
- 1,05213.0%Hispanic
- 2763.4%Two or more races
- 1632.0%Asian alone
- 921.1%American Indian alone
- 430.5%Native Hawaiian and Other
Pacific Islander alone - 220.3%Other race alone
2000
2022
-
- 2,233,99783.1%White alone
- 188,2527.0%Hispanic
- 151,4075.6%Black alone
- 46,3011.7%Asian alone
- 42,5081.6%Two or more races
- 22,3220.8%American Indian alone
- 2,4770.09%Other race alone
- 1,1540.04%Native Hawaiian and Other
Pacific Islander alone

-
- 2,147,94373.1%White alone
- 381,74613.0%Hispanic
- 147,6665.0%Black alone
- 145,3624.9%Two or more races
- 85,0852.9%Asian alone
- 13,2630.5%Other race alone
- 12,0650.4%American Indian alone
- 4,0200.1%Native Hawaiian and Other
Pacific Islander alone

Income and house value in Fort Riley North
- Median household income in 2022
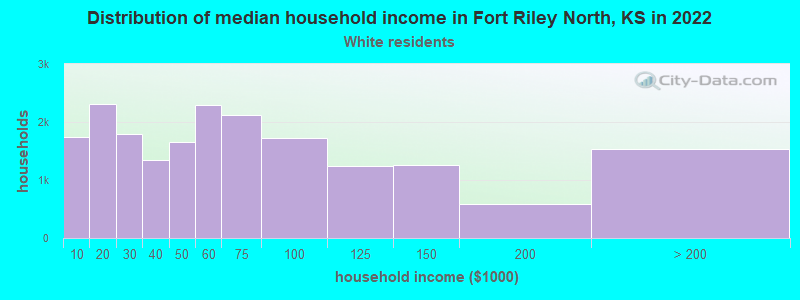
- $47,998White non-Hispanic householders
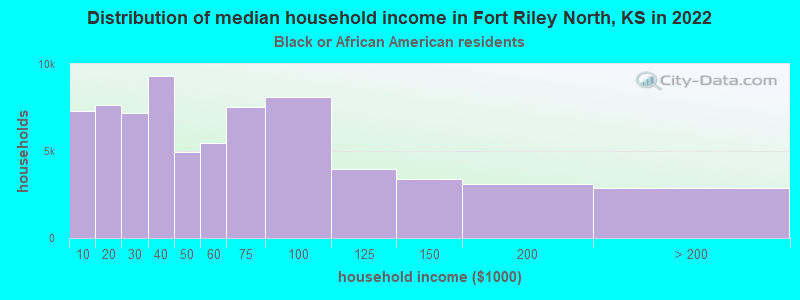
- $40,438Black householders
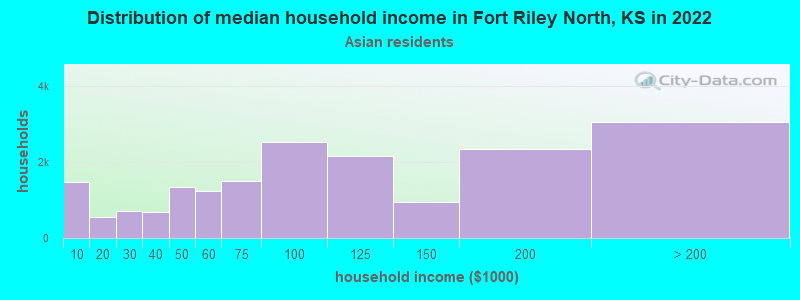
- $90,050Asian householders
- $23,751Some other race householders
- $41,707Two or more races householders
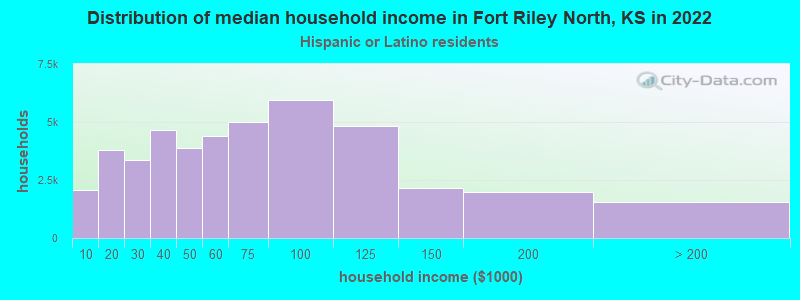
- $32,713Hispanic or Latino race householders
- Median 2022 house value
- $336,265Some other race householders
- $336,265Hispanic or Latino householders
Household income for White non-Hispanic householders
Household income for Black householders
Household income for American Indian and Alaska Native householders

Household income for Asian householders
Household income for Two or more races householders
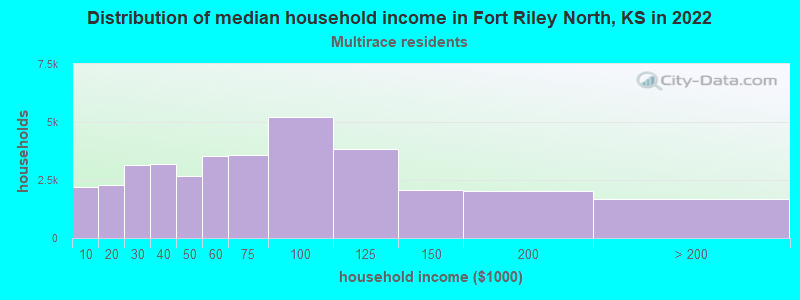
Household income for Hispanic or Latino race householders
Foreign-born residents in Fort Riley North
575 residents are foreign born (3.1% Europe, 2.5% Latin America, 1.4% Asia).
| This city: | 7.1% |
| Kansas: | 5.0% |
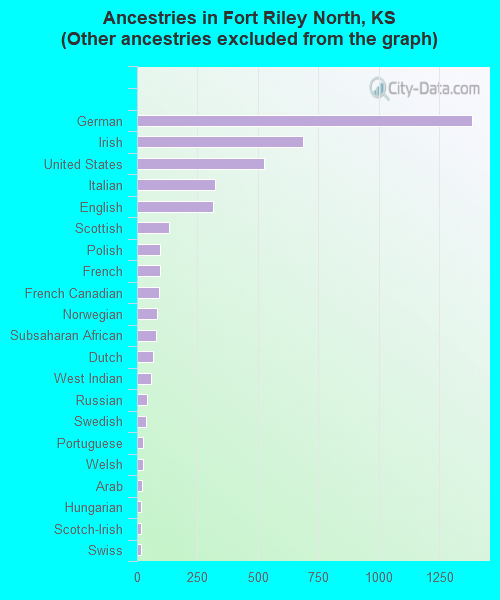
Ancestries in Fort Riley North

- 3,55946.1%Other
- 1,38618.0%German
- 6888.9%Irish
- 5236.8%United States
- 3224.2%Italian
- 3144.1%English
- 1311.7%Scottish
- 951.2%Polish
- 941.2%French
- 911.2%French Canadian
- 821.1%Norwegian
- 801.0%Subsaharan African
- 650.8%Dutch
- 580.8%West Indian
- 430.6%Russian
- 360.5%Swedish
- 260.3%Portuguese
- 230.3%Welsh
- 200.3%Arab
- 180.2%Hungarian
- 180.2%Scotch-Irish
- 180.2%Swiss
- 100.1%Greek
- 90.1%Czech
- 90.1%Ukrainian
Zip codes: 66442.