Races in Forest Park, Georgia (GA) Detailed Stats
Data:
Races - White alone (%)
Races - White alone (% change since 2000)
Races - Black alone (%)
Races - Black alone (% change since 2000)
Races - American Indian alone (%)
Races - American Indian alone (% change since 2000)
Races - Asian alone (%)
Races - Asian alone (% change since 2000)
Races - Hispanic (%)
Races - Hispanic (% change since 2000)
Races - Native Hawaiian and Other Pacific Islander alone (%)
Races - Native Hawaiian and Other Pacific Islander alone (% change since 2000)
Races - Two or more races(%)
Races - Two or more races(% change since 2000)
Races - Other race alone (%)
Races - Other race alone (% change since 2000)
Racial diversity
Place of birth - Born in state of residence (%)
Place of birth - Born in state of residence (%) - White
Place of birth - Born in state of residence (%) - Black or African American
Place of birth - Born in state of residence (%) - Asian
Place of birth - Born in state of residence (%) - Hispanic or Latino
Place of birth - Born in state of residence (%) - American Indian and Alaska Native
Place of birth - Born in state of residence (%) - Multirace
Place of birth - Born in state of residence (%) - Other Race
Place of birth - Born in other state (%)
Place of birth - Born in other state (%) - White
Place of birth - Born in other state (%) - Black or African American
Place of birth - Born in other state (%) - Asian
Place of birth - Born in other state (%) - Hispanic or Latino
Place of birth - Born in other state (%) - American Indian and Alaska Native
Place of birth - Born in other state (%) - Multirace
Place of birth - Born in other state (%) - Other Race
Place of birth - Native, outside of US (%)
Place of birth - Native, outside of US (%) - White
Place of birth - Native, outside of US (%) - Black or African American
Place of birth - Native, outside of US (%) - Asian
Place of birth - Native, outside of US (%) - Hispanic or Latino
Place of birth - Native, outside of US (%) - American Indian and Alaska Native
Place of birth - Native, outside of US (%) - Multirace
Place of birth - Native, outside of US (%) - Other Race
Place of birth - Foreign born (%)
Place of birth - Foreign born (%) - White
Place of birth - Foreign born (%) - Black or African American
Place of birth - Foreign born (%) - Asian
Place of birth - Foreign born (%) - Hispanic or Latino
Place of birth - Foreign born (%) - American Indian and Alaska Native
Place of birth - Foreign born (%) - Multirace
Place of birth - Foreign born (%) - Other Race
Residents speaking English at home (%)
Residents speaking English at home - Born in the United States (%)
Residents speaking English at home - Native, born elsewhere (%)
Residents speaking English at home - Foreign born (%)
Residents speaking Spanish at home (%)
Residents speaking Spanish at home - Born in the United States (%)
Residents speaking Spanish at home - Native, born elsewhere (%)
Residents speaking Spanish at home - Foreign born (%)
Residents speaking other language at home (%)
Residents speaking other language at home - Born in the United States (%)
Residents speaking other language at home - Native, born elsewhere (%)
Residents speaking other language at home - Foreign born (%)
Marital status - Never married (%)
Marital status - Now married (%)
Marital status - Separated (%)
Marital status - Widowed (%)
Marital status - Divorced (%)
Ancestries Reported - Arab (%)
Ancestries Reported - Czech (%)
Ancestries Reported - Danish (%)
Ancestries Reported - Dutch (%)
Ancestries Reported - English (%)
Ancestries Reported - French (%)
Ancestries Reported - French Canadian (%)
Ancestries Reported - German (%)
Ancestries Reported - Greek (%)
Ancestries Reported - Hungarian (%)
Ancestries Reported - Irish (%)
Ancestries Reported - Italian (%)
Ancestries Reported - Lithuanian (%)
Ancestries Reported - Norwegian (%)
Ancestries Reported - Polish (%)
Ancestries Reported - Portuguese (%)
Ancestries Reported - Russian (%)
Ancestries Reported - Scotch-Irish (%)
Ancestries Reported - Scottish (%)
Ancestries Reported - Slovak (%)
Ancestries Reported - Subsaharan African (%)
Ancestries Reported - Swedish (%)
Ancestries Reported - Swiss (%)
Ancestries Reported - Ukrainian (%)
Ancestries Reported - United States (%)
Ancestries Reported - Welsh (%)
Ancestries Reported - West Indian (%)
Ancestries Reported - Other (%)
Geographical mobility - Same house 1 year ago (%)
Geographical mobility - Same house 1 year ago (%) - White
Geographical mobility - Same house 1 year ago (%) - Black or African American
Geographical mobility - Same house 1 year ago (%) - Asian
Geographical mobility - Same house 1 year ago (%) - Hispanic or Latino
Geographical mobility - Same house 1 year ago (%) - American Indian and Alaska Native
Geographical mobility - Same house 1 year ago (%) - Multirace
Geographical mobility - Same house 1 year ago (%) - Other Race
Geographical mobility - Moved within same county (%)
Geographical mobility - Moved within same county (%) - White
Geographical mobility - Moved within same county (%) - Black or African American
Geographical mobility - Moved within same county (%) - Asian
Geographical mobility - Moved within same county (%) - Hispanic or Latino
Geographical mobility - Moved within same county (%) - American Indian and Alaska Native
Geographical mobility - Moved within same county (%) - Multirace
Geographical mobility - Moved within same county (%) - Other Race
Geographical mobility - Moved from different county within same state (%)
Geographical mobility - Moved from different county within same state (%) - White
Geographical mobility - Moved from different county within same state (%) - Black or African American
Geographical mobility - Moved from different county within same state (%) - Asian
Geographical mobility - Moved from different county within same state (%) - Hispanic or Latino
Geographical mobility - Moved from different county within same state (%) - American Indian and Alaska Native
Geographical mobility - Moved from different county within same state (%) - Multirace
Geographical mobility - Moved from different county within same state (%) - Other Race
Geographical mobility - Moved from different state (%)
Geographical mobility - Moved from different state (%) - White
Geographical mobility - Moved from different state (%) - Black or African American
Geographical mobility - Moved from different state (%) - Asian
Geographical mobility - Moved from different state (%) - Hispanic or Latino
Geographical mobility - Moved from different state (%) - American Indian and Alaska Native
Geographical mobility - Moved from different state (%) - Multirace
Geographical mobility - Moved from different state (%) - Other Race
Geographical mobility - Moved from abroad (%)
Geographical mobility - Moved from abroad (%) - White
Geographical mobility - Moved from abroad (%) - Black or African American
Geographical mobility - Moved from abroad (%) - Asian
Geographical mobility - Moved from abroad (%) - Hispanic or Latino
Geographical mobility - Moved from abroad (%) - American Indian and Alaska Native
Geographical mobility - Moved from abroad (%) - Multirace
Geographical mobility - Moved from abroad (%) - Other Race
Place of birth for the foreign-born population - Ireland (%)
Place of birth for the foreign-born population - Denmark (%)
Place of birth for the foreign-born population - Norway (%)
Place of birth for the foreign-born population - Sweden (%)
Place of birth for the foreign-born population - United Kingdom (%)
Place of birth for the foreign-born population - England (%)
Place of birth for the foreign-born population - Scotland (%)
Place of birth for the foreign-born population - Other Northern Europe (%)
Place of birth for the foreign-born population - Austria (%)
Place of birth for the foreign-born population - Belgium (%)
Place of birth for the foreign-born population - France (%)
Place of birth for the foreign-born population - Germany (%)
Place of birth for the foreign-born population - Netherlands (%)
Place of birth for the foreign-born population - Switzerland (%)
Place of birth for the foreign-born population - Other Western Europe (%)
Place of birth for the foreign-born population - Greece (%)
Place of birth for the foreign-born population - Italy (%)
Place of birth for the foreign-born population - Portugal (%)
Place of birth for the foreign-born population - Spain (%)
Place of birth for the foreign-born population - Other Southern Europe (%)
Place of birth for the foreign-born population - Albania (%)
Place of birth for the foreign-born population - Belarus (%)
Place of birth for the foreign-born population - Bosnia and Herzegovina (%)
Place of birth for the foreign-born population - Bulgaria (%)
Place of birth for the foreign-born population - Croatia (%)
Place of birth for the foreign-born population - Czechoslovakia (%)
Place of birth for the foreign-born population - Hungary (%)
Place of birth for the foreign-born population - Latvia (%)
Place of birth for the foreign-born population - Lithuania (%)
Place of birth for the foreign-born population - North Macedonia (Macedonia) (%)
Place of birth for the foreign-born population - Moldova (%)
Place of birth for the foreign-born population - Poland (%)
Place of birth for the foreign-born population - Romania (%)
Place of birth for the foreign-born population - Russia (%)
Place of birth for the foreign-born population - Serbia (%)
Place of birth for the foreign-born population - Ukraine (%)
Place of birth for the foreign-born population - Other Eastern Europe (%)
Place of birth for the foreign-born population - China (%)
Place of birth for the foreign-born population - Hong Kong (%)
Place of birth for the foreign-born population - Taiwan (%)
Place of birth for the foreign-born population - Japan (%)
Place of birth for the foreign-born population - Korea (%)
Place of birth for the foreign-born population - Other Eastern Asia (%)
Place of birth for the foreign-born population - Afghanistan (%)
Place of birth for the foreign-born population - Bangladesh (%)
Place of birth for the foreign-born population - India (%)
Place of birth for the foreign-born population - Iran (%)
Place of birth for the foreign-born population - Kazakhstan (%)
Place of birth for the foreign-born population - Nepal (%)
Place of birth for the foreign-born population - Pakistan (%)
Place of birth for the foreign-born population - Sri Lanka (%)
Place of birth for the foreign-born population - Uzbekistan (%)
Place of birth for the foreign-born population - Other South Central Asia (%)
Place of birth for the foreign-born population - Burma (%)
Place of birth for the foreign-born population - Cambodia (%)
Place of birth for the foreign-born population - Indonesia (%)
Place of birth for the foreign-born population - Laos (%)
Place of birth for the foreign-born population - Malaysia (%)
Place of birth for the foreign-born population - Philippines (%)
Place of birth for the foreign-born population - Singapore (%)
Place of birth for the foreign-born population - Thailand (%)
Place of birth for the foreign-born population - Vietnam (%)
Place of birth for the foreign-born population - Other South Eastern Asia (%)
Place of birth for the foreign-born population - Armenia (%)
Place of birth for the foreign-born population - Iraq (%)
Place of birth for the foreign-born population - Israel (%)
Place of birth for the foreign-born population - Jordan (%)
Place of birth for the foreign-born population - Kuwait (%)
Place of birth for the foreign-born population - Lebanon (%)
Place of birth for the foreign-born population - Saudi Arabia (%)
Place of birth for the foreign-born population - Syria (%)
Place of birth for the foreign-born population - Turkey (%)
Place of birth for the foreign-born population - Yemen (%)
Place of birth for the foreign-born population - Other Western Asia (%)
Place of birth for the foreign-born population - Eritrea (%)
Place of birth for the foreign-born population - Ethiopia (%)
Place of birth for the foreign-born population - Kenya (%)
Place of birth for the foreign-born population - Somalia (%)
Place of birth for the foreign-born population - Uganda (%)
Place of birth for the foreign-born population - Zimbabwe (%)
Place of birth for the foreign-born population - Other Eastern Africa (%)
Place of birth for the foreign-born population - Cameroon (%)
Place of birth for the foreign-born population - Congo (%)
Place of birth for the foreign-born population - Democratic Republic of Congo (Zaire) (%)
Place of birth for the foreign-born population - Other Middle Africa (%)
Place of birth for the foreign-born population - Egypt (%)
Place of birth for the foreign-born population - Morocco (%)
Place of birth for the foreign-born population - Sudan (%)
Place of birth for the foreign-born population - Other Northern Africa (%)
Place of birth for the foreign-born population - South Africa (%)
Place of birth for the foreign-born population - Other Southern Africa (%)
Place of birth for the foreign-born population - Cabo Verde (%)
Place of birth for the foreign-born population - Ghana (%)
Place of birth for the foreign-born population - Liberia (%)
Place of birth for the foreign-born population - Nigeria (%)
Place of birth for the foreign-born population - Senegal (%)
Place of birth for the foreign-born population - Sierra Leone (%)
Place of birth for the foreign-born population - Other Western Africa (%)
Place of birth for the foreign-born population - Australia (%)
Place of birth for the foreign-born population - New Zealand (%)
Place of birth for the foreign-born population - Fiji (%)
Place of birth for the foreign-born population - Micronesia (%)
Place of birth for the foreign-born population - Bahamas (%)
Place of birth for the foreign-born population - Barbados (%)
Place of birth for the foreign-born population - Cuba (%)
Place of birth for the foreign-born population - Dominica (%)
Place of birth for the foreign-born population - Dominican Republic (%)
Place of birth for the foreign-born population - Grenada (%)
Place of birth for the foreign-born population - Haiti (%)
Place of birth for the foreign-born population - Jamaica (%)
Place of birth for the foreign-born population - St. Vincent and the Grenadines (%)
Place of birth for the foreign-born population - Trinidad and Tobago (%)
Place of birth for the foreign-born population - West Indies (%)
Place of birth for the foreign-born population - Other Caribbean (%)
Place of birth for the foreign-born population - Belize (%)
Place of birth for the foreign-born population - Costa Rica (%)
Place of birth for the foreign-born population - El Salvador (%)
Place of birth for the foreign-born population - Guatemala (%)
Place of birth for the foreign-born population - Honduras (%)
Place of birth for the foreign-born population - Mexico (%)
Place of birth for the foreign-born population - Nicaragua (%)
Place of birth for the foreign-born population - Panama (%)
Place of birth for the foreign-born population - Other Central America (%)
Place of birth for the foreign-born population - Argentina (%)
Place of birth for the foreign-born population - Bolivia (%)
Place of birth for the foreign-born population - Brazil (%)
Place of birth for the foreign-born population - Chile (%)
Place of birth for the foreign-born population - Colombia (%)
Place of birth for the foreign-born population - Ecuador (%)
Place of birth for the foreign-born population - Guyana (%)
Place of birth for the foreign-born population - Peru (%)
Place of birth for the foreign-born population - Uruguay (%)
Place of birth for the foreign-born population - Venezuela (%)
Place of birth for the foreign-born population - Other South America (%)
Place of birth for the foreign-born population - Canada (%)
Place of birth for the foreign-born population - Other Northern America (%)
Place of birth for the foreign-born population - Other (%)
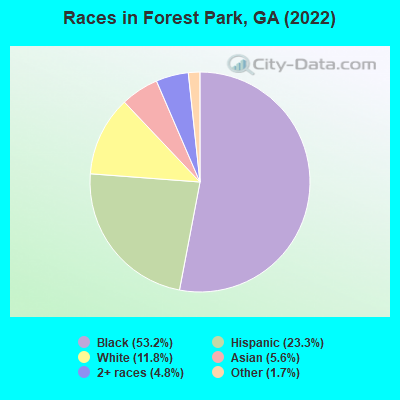
According to 2022 data, the most numerous races in Forest Park, GA are White alone (2,324 residents), Black alone (10,448 residents), and Hispanic (4,568 residents). 70.6% of Forest Park residents speak English at home. 15.9% of Forest Park, GA residents are foreign-born (10.4% born in Latin America, 4.5% born in Asia), which is 37.1% greater than the foreign-born rate of 10.0% across the entire state of Georgia.
Race distribution in Forest Park
2000 2022
5,128,661 62.6% White alone 2,331,465 28.5% Black alone 435,227 5.3% Hispanic 171,513 2.1% Asian alone 87,364 1.1% Two or more races 17,670 0.2% American Indian alone 11,275 0.1% Other race alone 3,278 0.04% Native Hawaiian and Other
5,415,657 49.6% White alone 3,349,240 30.7% Black alone 1,132,604 10.4% Hispanic 479,156 4.4% Asian alone 462,923 4.2% Two or more races 54,416 0.5% Other race alone 11,923 0.1% American Indian alone 6,957 0.06% Native Hawaiian and Other
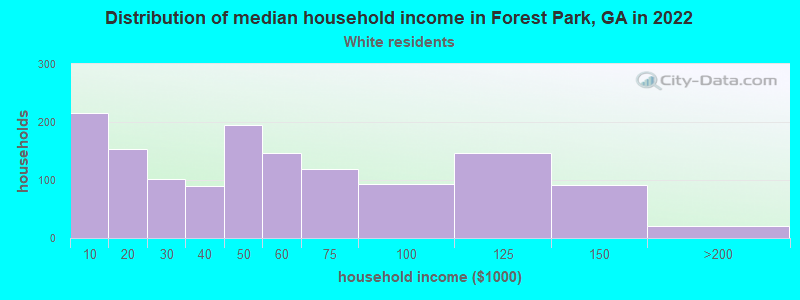
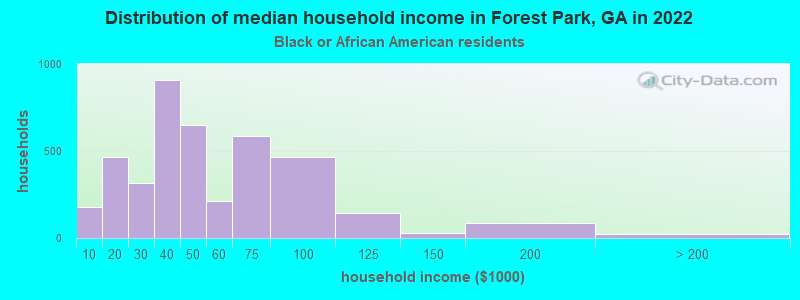
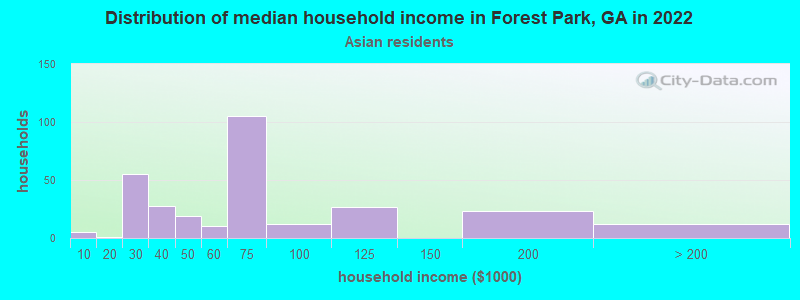
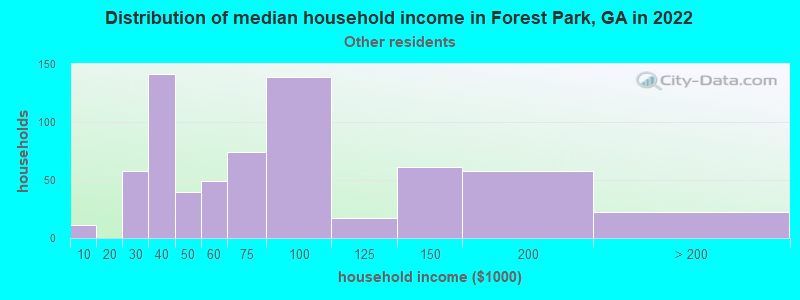
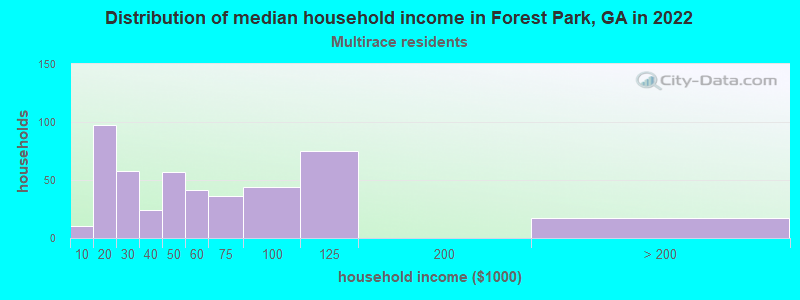
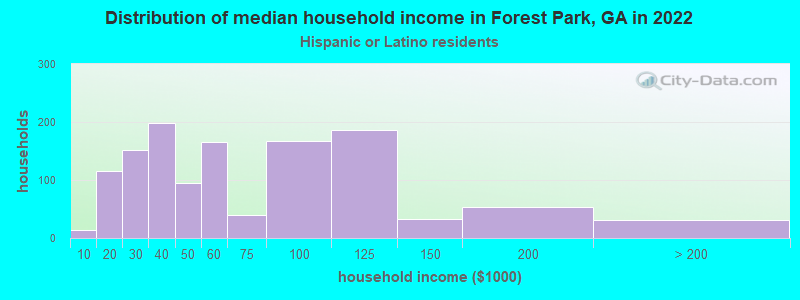
Income and house value in Forest Park Median household income in 2022 $36,668 White non-Hispanic householders$40,328 Black householders$52,924 Asian householders$59,650 Some other race householders$55,124 Two or more races householders$53,788 Hispanic or Latino race householdersMedian 2022 house value $123,377 White Non-Hispanic householders$130,180 Black or African American householders $140,477 Asian householders$148,015 Some other race householders$147,832 Two or more races householders$157,393 Hispanic or Latino householders
Median age by race in Forest Park
49.1 Median age for White residents43.5 51.7 32.0 Median age for Black or African American residents32.2 31.0 -566,666,666.1 Median age for American Indian / Alaska Native residents-560,327,197.8 -508,361,203.5 32.0 Median age for Asian residents33.5 31.2 -657,243,815.6 Median age for Native Hawaiian / Pacific Islander residents-693,227,090.9 -776,776,776.0 20.1 Median age for Other race residents21.1 21.2 27.4 Median age for Two or more races residents26.4 28.4 48.7 Median age for White alone residents37.7 56.7 27.0 Median age for Hispanic or Latino residents27.7 26.3
Owner/renter occupied households by race in Forest Park
House owners and renters - White residents 778 58.2% Owner occupied559 41.8% Renter occupiedHouse owners and renters - Black or African American residents 804 19.2% Owner occupied3,379 80.8% Renter occupiedHouse owners and renters - Asian residents 240 68.2% Owner occupied112 31.8% Renter occupiedHouse owners and renters - Other race residents 318 42.7% Owner occupied427 57.3% Renter occupiedHouse owners and renters - Two or more races residents 371 66.1% Owner occupied190 33.9% Renter occupiedHouse owners and renters - White alone residents 650 58.2% Owner occupied466 41.8% Renter occupiedHouse owners and renters - Hispanic or Latino residents 756 54.7% Owner occupied627 45.3% Renter occupied
Language usage in Forest Park
English speakers - Total 70.6% of residents of Forest Park speak English at home.
21.6% of residents speak Spanish at home 1,911 47.8% Speak English very well2,083 52.2% Speak English less than very well8.0% of residents speak other language at home 743 50.1% Speak English very well740 49.9% Speak English less than very well
English speakers - Born in the United States 86.8% of residents of Forest Park speak English at home.
13.2% of residents speak Spanish at home 353 64.5% Speak English very well194 35.5% Speak English less than very well1.3% of residents speak other language at home 54 100.0% Speak English very well
English speakers - Native, born elsewhere 15.5% of residents of Forest Park speak English at home.
56.6% of residents speak Spanish at home 64 87.7% Speak English very well9 12.3% Speak English less than very well13.2% of residents speak other language at home 17 100.0% Speak English very well
English speakers - Foreign-born 10.5% of residents of Forest Park speak English at home.
57.6% of residents speak Spanish at home 218 11.4% Speak English very well1,696 88.6% Speak English less than very well31.9% of residents speak other language at home 349 33.0% Speak English very well710 67.0% Speak English less than very well
White (Caucasian) - Speak only English Native:
89.1% (2,235)Foreign-born:
5.2% (21)
White (Caucasian) - Speak another language Native:
10.4% (261)Foreign-born:
85.6% (342)
Black or African American - Speak only English Native:
96.3% (9,180)Foreign-born:
38.4% (78)
Black or African American - Speak another language Native:
2.4% (225)Foreign-born:
63.2% (129)
Asian - Speak only English Native:
57.6% (143)Foreign-born:
6.3% (49)
Asian - Speak another language Native:
44.8% (112)Foreign-born:
89.6% (702)
Other race - Speak only English Native:
27.0% (492)Foreign-born:
12.2% (152)
Other race - Speak another language Native:
70.6% (1,286)Foreign-born:
82.7% (1,036)
Two or more races - Speak only English Native:
52.6% (616)Foreign-born:
8.9% (66)
Two or more races - Speak another language Native:
48.3% (565)Foreign-born:
88.8% (651)
White alone - Speak only English Native:
99.2% (2,443)Foreign-born:
32.6% (11)
White alone - Speak another language Native:
0.9% (21)Foreign-born:
67.3% (22)
Hispanic or Latino - Speak only English Native:
8.7% (185)Foreign-born:
9.0% (184)
Hispanic or Latino - Speak another language Native:
92.5% (1,959)Foreign-born:
91.3% (1,874)
Foreign-born residents in Forest Park 3,121 residents are foreign born (10.4% Latin America , 4.5% Asia ).
This city:
15.9%Georgia:
10.4%
Marital status for residents in Forest Park Marital status - White (Caucasian) population 15 years and over
Males 39.8% Never married36.8% Now married2.5% Separated5.6% Widowed15.3% DivorcedFemales 25.3% Never married34.8% Now married4.2% Separated14.3% Widowed21.4% DivorcedWomen who gave birth in the past 12 months Now married:
38.0% (22)Unmarried:
62.0% (36)
Women who did not give birth in the past 12 months Now married:
52.7% (241)Unmarried:
47.3% (217)
Marital status - Black or African American population 15 years and over
Males 54.1% Never married23.0% Now married5.8% Separated6.3% Widowed10.8% DivorcedFemales 50.0% Never married23.6% Now married5.5% Separated7.2% Widowed13.7% DivorcedWomen who gave birth in the past 12 months Now married:
47.3% (67)Unmarried:
52.7% (74)
Women who did not give birth in the past 12 months Now married:
31.0% (689)Unmarried:
69.0% (1,531)
Marital status - Asian population 15 years and over
Males 34.6% Never married51.5% Now married4.5% Separated3.9% Widowed5.4% DivorcedFemales 39.8% Never married44.2% Now married0.0% Separated4.2% Widowed11.8% DivorcedWomen who gave birth in the past 12 months Now married:
100.0% (16)Unmarried:
0.0% (0)
Women who did not give birth in the past 12 months Now married:
38.9% (146)Unmarried:
61.1% (229)
Marital status - Other race population 15 years and over
Males 45.7% Never married43.8% Now married3.1% Separated0.0% Widowed7.4% DivorcedFemales 38.3% Never married52.7% Now married0.0% Separated6.4% Widowed2.6% DivorcedWomen who gave birth in the past 12 months Now married:
0.0% (0)Unmarried:
100.0% (122)
Women who did not give birth in the past 12 months Now married:
68.5% (482)Unmarried:
31.5% (221)
Marital status - Two or more races population 15 years and over
Males 62.8% Never married25.6% Now married0.0% Separated0.0% Widowed11.6% DivorcedFemales 52.4% Never married20.3% Now married7.8% Separated8.3% Widowed11.2% DivorcedWomen who gave birth in the past 12 months Now married:
100.0% (18)Unmarried:
0.0% (0)
Women who did not give birth in the past 12 months Now married:
24.8% (138)Unmarried:
75.2% (418)
Marital status - White alone, not Hispanic / Latino population 15 years and over
Males 36.0% Never married30.2% Now married3.7% Separated8.3% Widowed21.8% DivorcedFemales 21.7% Never married28.4% Now married5.0% Separated19.8% Widowed25.1% DivorcedWomen who gave birth in the past 12 months Now married:
16.2% (10)Unmarried:
83.8% (49)
Women who did not give birth in the past 12 months Now married:
53.4% (161)Unmarried:
46.6% (140)
Marital status - Hispanic or Latino population 15 years and over
Males 45.3% Never married47.0% Now married1.6% Separated0.0% Widowed6.1% DivorcedFemales 40.6% Never married45.8% Now married3.6% Separated3.0% Widowed7.1% DivorcedWomen who gave birth in the past 12 months Now married:
32.7% (39)Unmarried:
67.3% (80)
Women who did not give birth in the past 12 months Now married:
53.5% (597)Unmarried:
46.5% (518)
Ancestries in Forest Park
1,043 7.5% American286 2.0% Irish202 1.4% English179 1.3% African152 1.1% Jamaican78 0.6% European75 0.5% Nigerian66 0.5% Haitian58 0.4% Italian37 0.3% Scotch-Irish35 0.3% Hungarian34 0.2% Israeli28 0.2% German20 0.1% Polish18 0.1% French18 0.1% West Indian11 0.08% Eastern European11 0.08% Welsh10 0.07% Portuguese9 0.06% Scottish8 0.06% Slavic4 0.03% Dutch4 0.03% Cape Verdean
Geographical mobility in Forest Park Same house 1 year ago 2,428 86.7% White (Caucasian)9,845 95.2% Black or African American36 99.5% American Indian / Alaska Native1,089 100.0% Asian3,515 100.0% Other race1,748 90.8% Two or more races2,021 87.7% White alone, not Hispanic / Latino4,281 95.5% Hispanic or LatinoMoved within same county 4 0.2% White / Caucasian123 1.2% Black or African American141 7.3% Two or more races6 0.3% White alone, not Hispanic / LatinoMoved within same state 129 4.6% White / Caucasian408 3.9% Black or African American14 1.3% Asian51 1.5% Other race30 1.6% Two or more races91 3.9% White alone, not Hispanic / Latino76 1.7% Hispanic or LatinoMoved from different state 94 3.4% White / Caucasian72 0.7% Black or African American58 2.5% White alone, not Hispanic / Latino11 0.2% Hispanic or LatinoMoved from abroad 17 0.6% White93 0.9% Black or African American16 0.5% Other race9 0.4% White alone, not Hispanic / Latino23 0.5% Hispanic or Latino
Children Nativity (place of birth) in Forest Park
Children under 6 years - Living with two parents Both parents native 219 100.0% NativeBoth parents foreign-born 141 100.0% NativeOne native, one foreign-born parent 57 100.0% NativeChildren under 6 years - Living with one parent Native parent 732 100.0% NativeForeign-born parent 233 100.0% NativeChildren 6 to 17 years - Living with two parents Both parents native 358 87.5% Native51 12.5% Foreign-bornBoth parents foreign-born 940 94.2% Native58 5.8% Foreign-bornOne native, one foreign-born parent 308 100.0% NativeChildren 6 to 17 years - Living with one parent Native parent 1,887 100.0% NativeForeign-born parent 243 49.8% Native246 50.2% Foreign-born
Grandparents responsible for own grandchildren in Forest Park
Grandparents (30 to 59 years) White / Caucasian 31 40.4% Responsible for grandchildren46 59.6% Not responsible for grandchildrenBlack or African American 69 87.6% Responsible for grandchildren10 12.4% Not responsible for grandchildrenOther race 35 69.6% Responsible for grandchildren15 30.4% Not responsible for grandchildrenTwo or more races 16 100.0% Responsible for grandchildrenWhite alone, not Hispanic / Latino 18 26.8% Responsible for grandchildren49 73.2% Not responsible for grandchildrenHispanic or Latino 55 100.0% Responsible for grandchildrenGrandparents (60 years and over) White / Caucasian 25 23.6% Responsible for grandchildren80 76.4% Not responsible for grandchildrenBlack or African American 21 37.2% Responsible for grandchildren35 62.8% Not responsible for grandchildrenOther race 49 100.0% Responsible for grandchildrenTwo or more races 23 100.0% Not responsible for grandchildrenWhite alone, not Hispanic / Latino 25 33.7% Responsible for grandchildren49 66.3% Not responsible for grandchildrenHispanic or Latino 46 57.5% Responsible for grandchildren34 42.5% Not responsible for grandchildren