Races in Forest City, North Carolina (NC) Detailed Stats
Data:
Races - White alone (%)
Races - White alone (% change since 2000)
Races - Black alone (%)
Races - Black alone (% change since 2000)
Races - American Indian alone (%)
Races - American Indian alone (% change since 2000)
Races - Asian alone (%)
Races - Asian alone (% change since 2000)
Races - Hispanic (%)
Races - Hispanic (% change since 2000)
Races - Native Hawaiian and Other Pacific Islander alone (%)
Races - Native Hawaiian and Other Pacific Islander alone (% change since 2000)
Races - Two or more races(%)
Races - Two or more races(% change since 2000)
Races - Other race alone (%)
Races - Other race alone (% change since 2000)
Racial diversity
Place of birth - Born in state of residence (%)
Place of birth - Born in state of residence (%) - White
Place of birth - Born in state of residence (%) - Black or African American
Place of birth - Born in state of residence (%) - Asian
Place of birth - Born in state of residence (%) - Hispanic or Latino
Place of birth - Born in state of residence (%) - American Indian and Alaska Native
Place of birth - Born in state of residence (%) - Multirace
Place of birth - Born in state of residence (%) - Other Race
Place of birth - Born in other state (%)
Place of birth - Born in other state (%) - White
Place of birth - Born in other state (%) - Black or African American
Place of birth - Born in other state (%) - Asian
Place of birth - Born in other state (%) - Hispanic or Latino
Place of birth - Born in other state (%) - American Indian and Alaska Native
Place of birth - Born in other state (%) - Multirace
Place of birth - Born in other state (%) - Other Race
Place of birth - Native, outside of US (%)
Place of birth - Native, outside of US (%) - White
Place of birth - Native, outside of US (%) - Black or African American
Place of birth - Native, outside of US (%) - Asian
Place of birth - Native, outside of US (%) - Hispanic or Latino
Place of birth - Native, outside of US (%) - American Indian and Alaska Native
Place of birth - Native, outside of US (%) - Multirace
Place of birth - Native, outside of US (%) - Other Race
Place of birth - Foreign born (%)
Place of birth - Foreign born (%) - White
Place of birth - Foreign born (%) - Black or African American
Place of birth - Foreign born (%) - Asian
Place of birth - Foreign born (%) - Hispanic or Latino
Place of birth - Foreign born (%) - American Indian and Alaska Native
Place of birth - Foreign born (%) - Multirace
Place of birth - Foreign born (%) - Other Race
Residents speaking English at home (%)
Residents speaking English at home - Born in the United States (%)
Residents speaking English at home - Native, born elsewhere (%)
Residents speaking English at home - Foreign born (%)
Residents speaking Spanish at home (%)
Residents speaking Spanish at home - Born in the United States (%)
Residents speaking Spanish at home - Native, born elsewhere (%)
Residents speaking Spanish at home - Foreign born (%)
Residents speaking other language at home (%)
Residents speaking other language at home - Born in the United States (%)
Residents speaking other language at home - Native, born elsewhere (%)
Residents speaking other language at home - Foreign born (%)
Marital status - Never married (%)
Marital status - Now married (%)
Marital status - Separated (%)
Marital status - Widowed (%)
Marital status - Divorced (%)
Ancestries Reported - Arab (%)
Ancestries Reported - Czech (%)
Ancestries Reported - Danish (%)
Ancestries Reported - Dutch (%)
Ancestries Reported - English (%)
Ancestries Reported - French (%)
Ancestries Reported - French Canadian (%)
Ancestries Reported - German (%)
Ancestries Reported - Greek (%)
Ancestries Reported - Hungarian (%)
Ancestries Reported - Irish (%)
Ancestries Reported - Italian (%)
Ancestries Reported - Lithuanian (%)
Ancestries Reported - Norwegian (%)
Ancestries Reported - Polish (%)
Ancestries Reported - Portuguese (%)
Ancestries Reported - Russian (%)
Ancestries Reported - Scotch-Irish (%)
Ancestries Reported - Scottish (%)
Ancestries Reported - Slovak (%)
Ancestries Reported - Subsaharan African (%)
Ancestries Reported - Swedish (%)
Ancestries Reported - Swiss (%)
Ancestries Reported - Ukrainian (%)
Ancestries Reported - United States (%)
Ancestries Reported - Welsh (%)
Ancestries Reported - West Indian (%)
Ancestries Reported - Other (%)
Geographical mobility - Same house 1 year ago (%)
Geographical mobility - Same house 1 year ago (%) - White
Geographical mobility - Same house 1 year ago (%) - Black or African American
Geographical mobility - Same house 1 year ago (%) - Asian
Geographical mobility - Same house 1 year ago (%) - Hispanic or Latino
Geographical mobility - Same house 1 year ago (%) - American Indian and Alaska Native
Geographical mobility - Same house 1 year ago (%) - Multirace
Geographical mobility - Same house 1 year ago (%) - Other Race
Geographical mobility - Moved within same county (%)
Geographical mobility - Moved within same county (%) - White
Geographical mobility - Moved within same county (%) - Black or African American
Geographical mobility - Moved within same county (%) - Asian
Geographical mobility - Moved within same county (%) - Hispanic or Latino
Geographical mobility - Moved within same county (%) - American Indian and Alaska Native
Geographical mobility - Moved within same county (%) - Multirace
Geographical mobility - Moved within same county (%) - Other Race
Geographical mobility - Moved from different county within same state (%)
Geographical mobility - Moved from different county within same state (%) - White
Geographical mobility - Moved from different county within same state (%) - Black or African American
Geographical mobility - Moved from different county within same state (%) - Asian
Geographical mobility - Moved from different county within same state (%) - Hispanic or Latino
Geographical mobility - Moved from different county within same state (%) - American Indian and Alaska Native
Geographical mobility - Moved from different county within same state (%) - Multirace
Geographical mobility - Moved from different county within same state (%) - Other Race
Geographical mobility - Moved from different state (%)
Geographical mobility - Moved from different state (%) - White
Geographical mobility - Moved from different state (%) - Black or African American
Geographical mobility - Moved from different state (%) - Asian
Geographical mobility - Moved from different state (%) - Hispanic or Latino
Geographical mobility - Moved from different state (%) - American Indian and Alaska Native
Geographical mobility - Moved from different state (%) - Multirace
Geographical mobility - Moved from different state (%) - Other Race
Geographical mobility - Moved from abroad (%)
Geographical mobility - Moved from abroad (%) - White
Geographical mobility - Moved from abroad (%) - Black or African American
Geographical mobility - Moved from abroad (%) - Asian
Geographical mobility - Moved from abroad (%) - Hispanic or Latino
Geographical mobility - Moved from abroad (%) - American Indian and Alaska Native
Geographical mobility - Moved from abroad (%) - Multirace
Geographical mobility - Moved from abroad (%) - Other Race
Place of birth for the foreign-born population - Ireland (%)
Place of birth for the foreign-born population - Denmark (%)
Place of birth for the foreign-born population - Norway (%)
Place of birth for the foreign-born population - Sweden (%)
Place of birth for the foreign-born population - United Kingdom (%)
Place of birth for the foreign-born population - England (%)
Place of birth for the foreign-born population - Scotland (%)
Place of birth for the foreign-born population - Other Northern Europe (%)
Place of birth for the foreign-born population - Austria (%)
Place of birth for the foreign-born population - Belgium (%)
Place of birth for the foreign-born population - France (%)
Place of birth for the foreign-born population - Germany (%)
Place of birth for the foreign-born population - Netherlands (%)
Place of birth for the foreign-born population - Switzerland (%)
Place of birth for the foreign-born population - Other Western Europe (%)
Place of birth for the foreign-born population - Greece (%)
Place of birth for the foreign-born population - Italy (%)
Place of birth for the foreign-born population - Portugal (%)
Place of birth for the foreign-born population - Spain (%)
Place of birth for the foreign-born population - Other Southern Europe (%)
Place of birth for the foreign-born population - Albania (%)
Place of birth for the foreign-born population - Belarus (%)
Place of birth for the foreign-born population - Bosnia and Herzegovina (%)
Place of birth for the foreign-born population - Bulgaria (%)
Place of birth for the foreign-born population - Croatia (%)
Place of birth for the foreign-born population - Czechoslovakia (%)
Place of birth for the foreign-born population - Hungary (%)
Place of birth for the foreign-born population - Latvia (%)
Place of birth for the foreign-born population - Lithuania (%)
Place of birth for the foreign-born population - North Macedonia (Macedonia) (%)
Place of birth for the foreign-born population - Moldova (%)
Place of birth for the foreign-born population - Poland (%)
Place of birth for the foreign-born population - Romania (%)
Place of birth for the foreign-born population - Russia (%)
Place of birth for the foreign-born population - Serbia (%)
Place of birth for the foreign-born population - Ukraine (%)
Place of birth for the foreign-born population - Other Eastern Europe (%)
Place of birth for the foreign-born population - China (%)
Place of birth for the foreign-born population - Hong Kong (%)
Place of birth for the foreign-born population - Taiwan (%)
Place of birth for the foreign-born population - Japan (%)
Place of birth for the foreign-born population - Korea (%)
Place of birth for the foreign-born population - Other Eastern Asia (%)
Place of birth for the foreign-born population - Afghanistan (%)
Place of birth for the foreign-born population - Bangladesh (%)
Place of birth for the foreign-born population - India (%)
Place of birth for the foreign-born population - Iran (%)
Place of birth for the foreign-born population - Kazakhstan (%)
Place of birth for the foreign-born population - Nepal (%)
Place of birth for the foreign-born population - Pakistan (%)
Place of birth for the foreign-born population - Sri Lanka (%)
Place of birth for the foreign-born population - Uzbekistan (%)
Place of birth for the foreign-born population - Other South Central Asia (%)
Place of birth for the foreign-born population - Burma (%)
Place of birth for the foreign-born population - Cambodia (%)
Place of birth for the foreign-born population - Indonesia (%)
Place of birth for the foreign-born population - Laos (%)
Place of birth for the foreign-born population - Malaysia (%)
Place of birth for the foreign-born population - Philippines (%)
Place of birth for the foreign-born population - Singapore (%)
Place of birth for the foreign-born population - Thailand (%)
Place of birth for the foreign-born population - Vietnam (%)
Place of birth for the foreign-born population - Other South Eastern Asia (%)
Place of birth for the foreign-born population - Armenia (%)
Place of birth for the foreign-born population - Iraq (%)
Place of birth for the foreign-born population - Israel (%)
Place of birth for the foreign-born population - Jordan (%)
Place of birth for the foreign-born population - Kuwait (%)
Place of birth for the foreign-born population - Lebanon (%)
Place of birth for the foreign-born population - Saudi Arabia (%)
Place of birth for the foreign-born population - Syria (%)
Place of birth for the foreign-born population - Turkey (%)
Place of birth for the foreign-born population - Yemen (%)
Place of birth for the foreign-born population - Other Western Asia (%)
Place of birth for the foreign-born population - Eritrea (%)
Place of birth for the foreign-born population - Ethiopia (%)
Place of birth for the foreign-born population - Kenya (%)
Place of birth for the foreign-born population - Somalia (%)
Place of birth for the foreign-born population - Uganda (%)
Place of birth for the foreign-born population - Zimbabwe (%)
Place of birth for the foreign-born population - Other Eastern Africa (%)
Place of birth for the foreign-born population - Cameroon (%)
Place of birth for the foreign-born population - Congo (%)
Place of birth for the foreign-born population - Democratic Republic of Congo (Zaire) (%)
Place of birth for the foreign-born population - Other Middle Africa (%)
Place of birth for the foreign-born population - Egypt (%)
Place of birth for the foreign-born population - Morocco (%)
Place of birth for the foreign-born population - Sudan (%)
Place of birth for the foreign-born population - Other Northern Africa (%)
Place of birth for the foreign-born population - South Africa (%)
Place of birth for the foreign-born population - Other Southern Africa (%)
Place of birth for the foreign-born population - Cabo Verde (%)
Place of birth for the foreign-born population - Ghana (%)
Place of birth for the foreign-born population - Liberia (%)
Place of birth for the foreign-born population - Nigeria (%)
Place of birth for the foreign-born population - Senegal (%)
Place of birth for the foreign-born population - Sierra Leone (%)
Place of birth for the foreign-born population - Other Western Africa (%)
Place of birth for the foreign-born population - Australia (%)
Place of birth for the foreign-born population - New Zealand (%)
Place of birth for the foreign-born population - Fiji (%)
Place of birth for the foreign-born population - Micronesia (%)
Place of birth for the foreign-born population - Bahamas (%)
Place of birth for the foreign-born population - Barbados (%)
Place of birth for the foreign-born population - Cuba (%)
Place of birth for the foreign-born population - Dominica (%)
Place of birth for the foreign-born population - Dominican Republic (%)
Place of birth for the foreign-born population - Grenada (%)
Place of birth for the foreign-born population - Haiti (%)
Place of birth for the foreign-born population - Jamaica (%)
Place of birth for the foreign-born population - St. Vincent and the Grenadines (%)
Place of birth for the foreign-born population - Trinidad and Tobago (%)
Place of birth for the foreign-born population - West Indies (%)
Place of birth for the foreign-born population - Other Caribbean (%)
Place of birth for the foreign-born population - Belize (%)
Place of birth for the foreign-born population - Costa Rica (%)
Place of birth for the foreign-born population - El Salvador (%)
Place of birth for the foreign-born population - Guatemala (%)
Place of birth for the foreign-born population - Honduras (%)
Place of birth for the foreign-born population - Mexico (%)
Place of birth for the foreign-born population - Nicaragua (%)
Place of birth for the foreign-born population - Panama (%)
Place of birth for the foreign-born population - Other Central America (%)
Place of birth for the foreign-born population - Argentina (%)
Place of birth for the foreign-born population - Bolivia (%)
Place of birth for the foreign-born population - Brazil (%)
Place of birth for the foreign-born population - Chile (%)
Place of birth for the foreign-born population - Colombia (%)
Place of birth for the foreign-born population - Ecuador (%)
Place of birth for the foreign-born population - Guyana (%)
Place of birth for the foreign-born population - Peru (%)
Place of birth for the foreign-born population - Uruguay (%)
Place of birth for the foreign-born population - Venezuela (%)
Place of birth for the foreign-born population - Other South America (%)
Place of birth for the foreign-born population - Canada (%)
Place of birth for the foreign-born population - Other Northern America (%)
Place of birth for the foreign-born population - Other (%)
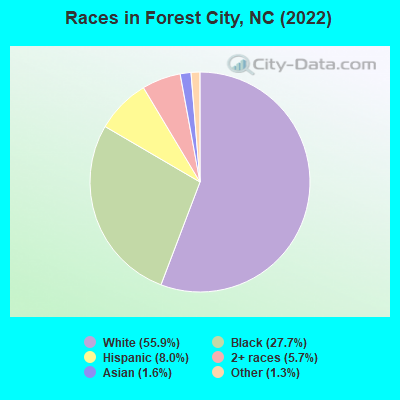
According to 2022 data, the most numerous races in Forest City, NC are White alone (4,203 residents), Black alone (2,085 residents), and Hispanic (600 residents). 92.4% of Forest City residents speak English at home. 3.4% of Forest City, NC residents are foreign-born (1.6% born in Asia, 1.6% born in Latin America), which is 133.1% less than the foreign-born rate of 8.0% across the entire state of North Carolina.
Race distribution in Forest City
2000 2022
5,647,155 70.2% White alone 1,723,301 21.4% Black alone 378,963 4.7% Hispanic 112,416 1.4% Asian alone 95,333 1.2% American Indian alone 79,965 1.0% Two or more races 9,015 0.1% Other race alone 3,165 0.04% Native Hawaiian and Other
6,497,519 60.7% White alone 2,155,650 20.1% Black alone 1,114,799 10.4% Hispanic 438,061 4.1% Two or more races 341,052 3.2% Asian alone 91,758 0.9% American Indian alone 50,180 0.5% Other race alone 9,954 0.09% Native Hawaiian and Other
Income and house value in Forest City Median household income in 2022 $36,917 White non-Hispanic householders$30,943 Black householders$27,934 Two or more races householdersMedian 2022 house value $169,787 White Non-Hispanic householders$143,076 Black or African American householders$251,242 American Indian or Alaska Native householders$171,903 Some other race householders$213,688 Two or more races householders$127,737 Hispanic or Latino householders
Median age by race in Forest City
38.0 Median age for White residents33.4 39.8 29.1 Median age for Black or African American residents18.7 35.0 -666,666,666.0 Median age for American Indian / Alaska Native residents-668,604,650.5 -682,971,013.8 -685,606,059.9 Median age for Asian residents-682,080,924.2 -689,075,629.6 -609,884,331.7 Median age for Native Hawaiian / Pacific Islander residents-611,708,482.1 -612,403,100.2 18.2 Median age for Other race residents17.8 35.4 30.7 Median age for Two or more races residents29.6 31.9 38.0 Median age for White alone residents34.6 41.4 19.4 Median age for Hispanic or Latino residents18.1 35.5
Owner/renter occupied households by race in Forest City
House owners and renters - White residents 958 54.7% Owner occupied792 45.3% Renter occupiedHouse owners and renters - Black or African American residents 249 36.1% Owner occupied440 63.9% Renter occupiedHouse owners and renters - Asian residents 55 100.0% Renter occupiedHouse owners and renters - Other race residents 22 11.6% Owner occupied165 88.4% Renter occupiedHouse owners and renters - Two or more races residents 24 20.2% Owner occupied94 79.8% Renter occupiedHouse owners and renters - White alone residents 928 53.1% Owner occupied819 46.9% Renter occupiedHouse owners and renters - Hispanic or Latino residents 45 23.4% Owner occupied146 76.6% Renter occupied
Language usage in Forest City
English speakers - Total 92.4% of residents of Forest City speak English at home.
4.9% of residents speak Spanish at home 264 78.3% Speak English very well73 21.7% Speak English less than very well2.4% of residents speak other language at home 98 59.8% Speak English very well66 40.2% Speak English less than very well
English speakers - Born in the United States 89.0% of residents of Forest City speak English at home.
10.5% of residents speak Spanish at home 179 100.0% Speak English very well
English speakers - Native, born elsewhere 98.5% of residents of Forest City speak English at home.
English speakers - Foreign-born 10.1% of residents of Forest City speak English at home.
42.6% of residents speak Spanish at home 39 35.5% Speak English very well71 64.5% Speak English less than very well46.1% of residents speak other language at home 55 46.2% Speak English very well64 53.8% Speak English less than very well
White (Caucasian) - Speak only English Native:
99.9% (3,986)Foreign-born:
32.2% (17)
White (Caucasian) - Speak another language Native:
0.7% (29)Foreign-born:
64.6% (35)
Other race - Speak another language Native:
77.8% (280)Foreign-born:
100.0% (28)
Two or more races - Speak only English Native:
97.0% (357)Foreign-born:
20.0% (11)
White alone - Speak only English Native:
99.9% (3,845)Foreign-born:
100.0% (18)
Hispanic or Latino - Speak another language Native:
55.0% (274)Foreign-born:
99.8% (112)
Foreign-born residents in Forest City 258 residents are foreign born (1.6% Asia , 1.6% Latin America ).
This city:
3.4%North Carolina:
8.3%
Marital status for residents in Forest City Marital status - White (Caucasian) population 15 years and over
Males 39.0% Never married40.3% Now married2.3% Separated6.7% Widowed11.7% DivorcedFemales 23.4% Never married32.6% Now married8.1% Separated14.1% Widowed21.8% DivorcedWomen who gave birth in the past 12 months Now married:
30.5% (28)Unmarried:
69.5% (64)
Women who did not give birth in the past 12 months Now married:
42.6% (338)Unmarried:
57.4% (454)
Marital status - Black or African American population 15 years and over
Males 65.8% Never married8.0% Now married9.0% Separated0.0% Widowed17.2% DivorcedFemales 44.1% Never married8.9% Now married0.0% Separated7.9% Widowed39.1% DivorcedWomen who gave birth in the past 12 months Now married:
0.0% (0)Unmarried:
100.0% (209)
Women who did not give birth in the past 12 months Now married:
16.6% (74)Unmarried:
83.4% (370)
Marital status - Other race population 15 years and over
Males 85.7% Never married0.0% Now married14.3% Separated0.0% Widowed0.0% DivorcedFemales 100.0% Never married0.0% Now married0.0% Separated0.0% Widowed0.0% DivorcedWomen who gave birth in the past 12 months Now married:
0.0% (0)Unmarried:
100.0% (22)
Women who did not give birth in the past 12 months Now married:
0.0% (0)Unmarried:
100.0% (136)
Marital status - Two or more races population 15 years and over
Males 31.3% Never married48.5% Now married8.1% Separated8.1% Widowed4.0% DivorcedFemales 33.5% Never married56.3% Now married3.0% Separated7.2% Widowed0.0% DivorcedWomen who did not give birth in the past 12 months Now married:
5.1% (4)Unmarried:
94.9% (77)
Marital status - White alone, not Hispanic / Latino population 15 years and over
Males 38.8% Never married39.8% Now married2.4% Separated6.9% Widowed12.2% DivorcedFemales 23.3% Never married32.7% Now married8.3% Separated14.1% Widowed21.6% DivorcedWomen who gave birth in the past 12 months Now married:
30.5% (29)Unmarried:
69.5% (66)
Women who did not give birth in the past 12 months Now married:
42.8% (336)Unmarried:
57.2% (450)
Marital status - Hispanic or Latino population 15 years and over
Males 60.1% Never married31.6% Now married8.3% Separated0.0% Widowed0.0% DivorcedFemales 70.9% Never married17.1% Now married0.0% Separated4.4% Widowed7.6% DivorcedWomen who did not give birth in the past 12 months Now married:
9.8% (14)Unmarried:
90.2% (129)
Ancestries in Forest City
559 13.3% American356 8.4% German213 5.1% Irish162 3.8% English69 1.6% Scotch-Irish54 1.3% Scottish43 1.0% African37 0.9% Italian19 0.5% French13 0.3% Estonian12 0.3% Welsh10 0.2% Trinidadian and Tobagonian8 0.2% Eastern European4 0.09% British
Children Nativity (place of birth) in Forest City
Children under 6 years - Living with two parents Both parents native 207 100.0% NativeChildren under 6 years - Living with one parent Native parent 491 100.0% NativeChildren 6 to 17 years - Living with two parents Both parents native 437 100.0% NativeChildren 6 to 17 years - Living with one parent Native parent 806 95.9% Native34 4.1% Foreign-bornForeign-born parent 75 76.0% Native24 24.0% Foreign-born
Place of birth for residents in Forest City 125 Asia125 South Eastern Asia125 Americas125 Latin America91 South America23 Central America10 Caribbean7 Europe7 Eastern Europe
Grandparents responsible for own grandchildren in Forest City
Grandparents (30 to 59 years) White / Caucasian 28 100.0% Responsible for grandchildrenBlack or African American 80 67.7% Responsible for grandchildren38 32.3% Not responsible for grandchildrenWhite alone, not Hispanic / Latino 30 100.0% Responsible for grandchildrenGrandparents (60 years and over) White / Caucasian 41 65.7% Responsible for grandchildren21 34.3% Not responsible for grandchildrenBlack or African American 57 53.6% Responsible for grandchildren49 46.4% Not responsible for grandchildrenWhite alone, not Hispanic / Latino 42 79.4% Responsible for grandchildren11 20.6% Not responsible for grandchildren