Races in Flowood, Mississippi (MS) Detailed Stats
Data:
Races - White alone (%)
Races - White alone (% change since 2000)
Races - Black alone (%)
Races - Black alone (% change since 2000)
Races - American Indian alone (%)
Races - American Indian alone (% change since 2000)
Races - Asian alone (%)
Races - Asian alone (% change since 2000)
Races - Hispanic (%)
Races - Hispanic (% change since 2000)
Races - Native Hawaiian and Other Pacific Islander alone (%)
Races - Native Hawaiian and Other Pacific Islander alone (% change since 2000)
Races - Two or more races(%)
Races - Two or more races(% change since 2000)
Races - Other race alone (%)
Races - Other race alone (% change since 2000)
Racial diversity
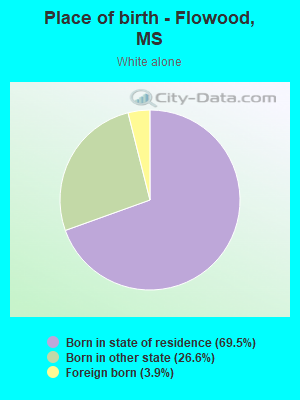
Place of birth - Born in state of residence (%)
Place of birth - Born in state of residence (%) - White
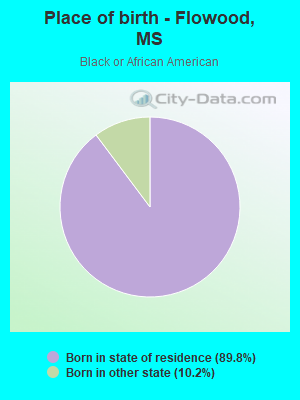
Place of birth - Born in state of residence (%) - Black or African American
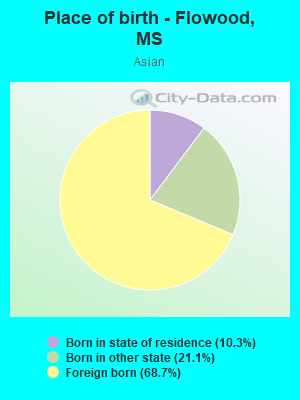
Place of birth - Born in state of residence (%) - Asian
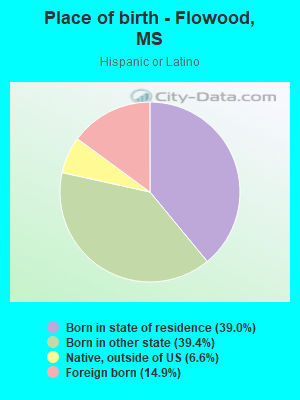
Place of birth - Born in state of residence (%) - Hispanic or Latino
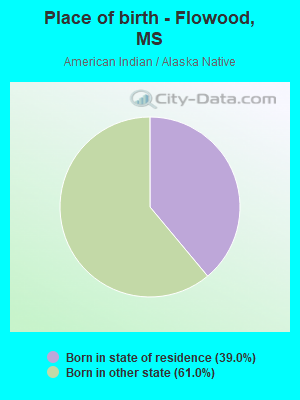
Place of birth - Born in state of residence (%) - American Indian and Alaska Native
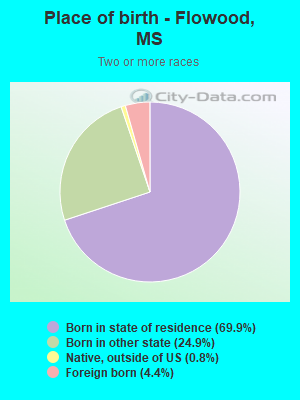
Place of birth - Born in state of residence (%) - Multirace
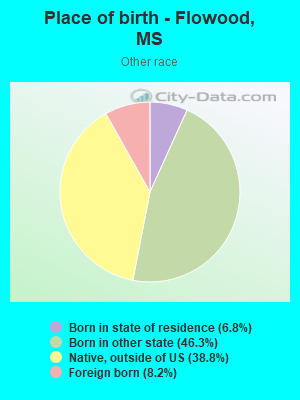
Place of birth - Born in state of residence (%) - Other Race
Place of birth - Born in other state (%)
Place of birth - Born in other state (%) - White
Place of birth - Born in other state (%) - Black or African American
Place of birth - Born in other state (%) - Asian
Place of birth - Born in other state (%) - Hispanic or Latino
Place of birth - Born in other state (%) - American Indian and Alaska Native
Place of birth - Born in other state (%) - Multirace
Place of birth - Born in other state (%) - Other Race
Place of birth - Native, outside of US (%)
Place of birth - Native, outside of US (%) - White
Place of birth - Native, outside of US (%) - Black or African American
Place of birth - Native, outside of US (%) - Asian
Place of birth - Native, outside of US (%) - Hispanic or Latino
Place of birth - Native, outside of US (%) - American Indian and Alaska Native
Place of birth - Native, outside of US (%) - Multirace
Place of birth - Native, outside of US (%) - Other Race
Place of birth - Foreign born (%)
Place of birth - Foreign born (%) - White
Place of birth - Foreign born (%) - Black or African American
Place of birth - Foreign born (%) - Asian
Place of birth - Foreign born (%) - Hispanic or Latino
Place of birth - Foreign born (%) - American Indian and Alaska Native
Place of birth - Foreign born (%) - Multirace
Place of birth - Foreign born (%) - Other Race
Residents speaking English at home (%)
Residents speaking English at home - Born in the United States (%)
Residents speaking English at home - Native, born elsewhere (%)
Residents speaking English at home - Foreign born (%)
Residents speaking Spanish at home (%)
Residents speaking Spanish at home - Born in the United States (%)
Residents speaking Spanish at home - Native, born elsewhere (%)
Residents speaking Spanish at home - Foreign born (%)
Residents speaking other language at home (%)
Residents speaking other language at home - Born in the United States (%)
Residents speaking other language at home - Native, born elsewhere (%)
Residents speaking other language at home - Foreign born (%)
Marital status - Never married (%)
Marital status - Now married (%)
Marital status - Separated (%)
Marital status - Widowed (%)
Marital status - Divorced (%)
Ancestries Reported - Arab (%)
Ancestries Reported - Czech (%)
Ancestries Reported - Danish (%)
Ancestries Reported - Dutch (%)
Ancestries Reported - English (%)
Ancestries Reported - French (%)
Ancestries Reported - French Canadian (%)
Ancestries Reported - German (%)
Ancestries Reported - Greek (%)
Ancestries Reported - Hungarian (%)
Ancestries Reported - Irish (%)
Ancestries Reported - Italian (%)
Ancestries Reported - Lithuanian (%)
Ancestries Reported - Norwegian (%)
Ancestries Reported - Polish (%)
Ancestries Reported - Portuguese (%)
Ancestries Reported - Russian (%)
Ancestries Reported - Scotch-Irish (%)
Ancestries Reported - Scottish (%)
Ancestries Reported - Slovak (%)
Ancestries Reported - Subsaharan African (%)
Ancestries Reported - Swedish (%)
Ancestries Reported - Swiss (%)
Ancestries Reported - Ukrainian (%)
Ancestries Reported - United States (%)
Ancestries Reported - Welsh (%)
Ancestries Reported - West Indian (%)
Ancestries Reported - Other (%)
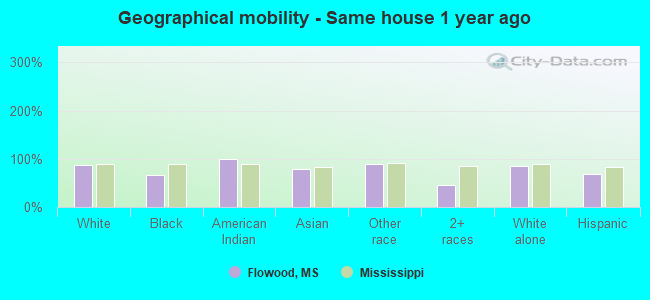
Geographical mobility - Same house 1 year ago (%)
Geographical mobility - Same house 1 year ago (%) - White
Geographical mobility - Same house 1 year ago (%) - Black or African American
Geographical mobility - Same house 1 year ago (%) - Asian
Geographical mobility - Same house 1 year ago (%) - Hispanic or Latino
Geographical mobility - Same house 1 year ago (%) - American Indian and Alaska Native
Geographical mobility - Same house 1 year ago (%) - Multirace
Geographical mobility - Same house 1 year ago (%) - Other Race
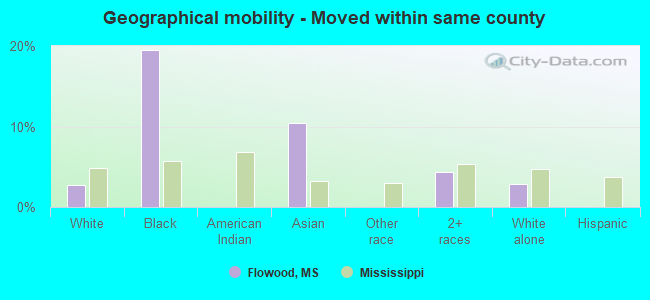
Geographical mobility - Moved within same county (%)
Geographical mobility - Moved within same county (%) - White
Geographical mobility - Moved within same county (%) - Black or African American
Geographical mobility - Moved within same county (%) - Asian
Geographical mobility - Moved within same county (%) - Hispanic or Latino
Geographical mobility - Moved within same county (%) - American Indian and Alaska Native
Geographical mobility - Moved within same county (%) - Multirace
Geographical mobility - Moved within same county (%) - Other Race
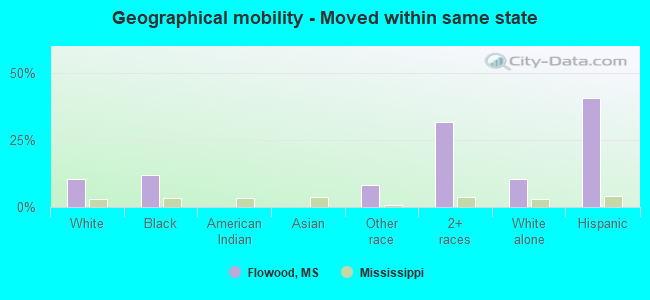
Geographical mobility - Moved from different county within same state (%)
Geographical mobility - Moved from different county within same state (%) - White
Geographical mobility - Moved from different county within same state (%) - Black or African American
Geographical mobility - Moved from different county within same state (%) - Asian
Geographical mobility - Moved from different county within same state (%) - Hispanic or Latino
Geographical mobility - Moved from different county within same state (%) - American Indian and Alaska Native
Geographical mobility - Moved from different county within same state (%) - Multirace
Geographical mobility - Moved from different county within same state (%) - Other Race
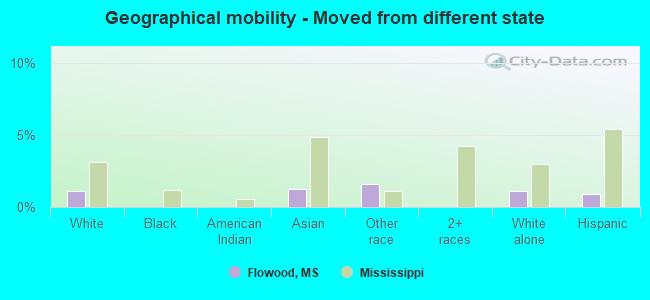
Geographical mobility - Moved from different state (%)
Geographical mobility - Moved from different state (%) - White
Geographical mobility - Moved from different state (%) - Black or African American
Geographical mobility - Moved from different state (%) - Asian
Geographical mobility - Moved from different state (%) - Hispanic or Latino
Geographical mobility - Moved from different state (%) - American Indian and Alaska Native
Geographical mobility - Moved from different state (%) - Multirace
Geographical mobility - Moved from different state (%) - Other Race
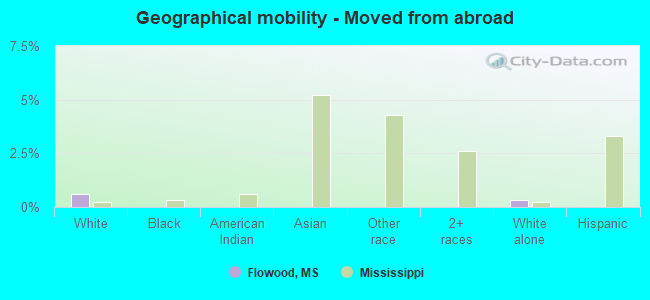
Geographical mobility - Moved from abroad (%)
Geographical mobility - Moved from abroad (%) - White
Geographical mobility - Moved from abroad (%) - Black or African American
Geographical mobility - Moved from abroad (%) - Asian
Geographical mobility - Moved from abroad (%) - Hispanic or Latino
Geographical mobility - Moved from abroad (%) - American Indian and Alaska Native
Geographical mobility - Moved from abroad (%) - Multirace
Geographical mobility - Moved from abroad (%) - Other Race
Place of birth for the foreign-born population - Ireland (%)
Place of birth for the foreign-born population - Denmark (%)
Place of birth for the foreign-born population - Norway (%)
Place of birth for the foreign-born population - Sweden (%)
Place of birth for the foreign-born population - United Kingdom (%)
Place of birth for the foreign-born population - England (%)
Place of birth for the foreign-born population - Scotland (%)
Place of birth for the foreign-born population - Other Northern Europe (%)
Place of birth for the foreign-born population - Austria (%)
Place of birth for the foreign-born population - Belgium (%)
Place of birth for the foreign-born population - France (%)
Place of birth for the foreign-born population - Germany (%)
Place of birth for the foreign-born population - Netherlands (%)
Place of birth for the foreign-born population - Switzerland (%)
Place of birth for the foreign-born population - Other Western Europe (%)
Place of birth for the foreign-born population - Greece (%)
Place of birth for the foreign-born population - Italy (%)
Place of birth for the foreign-born population - Portugal (%)
Place of birth for the foreign-born population - Spain (%)
Place of birth for the foreign-born population - Other Southern Europe (%)
Place of birth for the foreign-born population - Albania (%)
Place of birth for the foreign-born population - Belarus (%)
Place of birth for the foreign-born population - Bosnia and Herzegovina (%)
Place of birth for the foreign-born population - Bulgaria (%)
Place of birth for the foreign-born population - Croatia (%)
Place of birth for the foreign-born population - Czechoslovakia (%)
Place of birth for the foreign-born population - Hungary (%)
Place of birth for the foreign-born population - Latvia (%)
Place of birth for the foreign-born population - Lithuania (%)
Place of birth for the foreign-born population - North Macedonia (Macedonia) (%)
Place of birth for the foreign-born population - Moldova (%)
Place of birth for the foreign-born population - Poland (%)
Place of birth for the foreign-born population - Romania (%)
Place of birth for the foreign-born population - Russia (%)
Place of birth for the foreign-born population - Serbia (%)
Place of birth for the foreign-born population - Ukraine (%)
Place of birth for the foreign-born population - Other Eastern Europe (%)
Place of birth for the foreign-born population - China (%)
Place of birth for the foreign-born population - Hong Kong (%)
Place of birth for the foreign-born population - Taiwan (%)
Place of birth for the foreign-born population - Japan (%)
Place of birth for the foreign-born population - Korea (%)
Place of birth for the foreign-born population - Other Eastern Asia (%)
Place of birth for the foreign-born population - Afghanistan (%)
Place of birth for the foreign-born population - Bangladesh (%)
Place of birth for the foreign-born population - India (%)
Place of birth for the foreign-born population - Iran (%)
Place of birth for the foreign-born population - Kazakhstan (%)
Place of birth for the foreign-born population - Nepal (%)
Place of birth for the foreign-born population - Pakistan (%)
Place of birth for the foreign-born population - Sri Lanka (%)
Place of birth for the foreign-born population - Uzbekistan (%)
Place of birth for the foreign-born population - Other South Central Asia (%)
Place of birth for the foreign-born population - Burma (%)
Place of birth for the foreign-born population - Cambodia (%)
Place of birth for the foreign-born population - Indonesia (%)
Place of birth for the foreign-born population - Laos (%)
Place of birth for the foreign-born population - Malaysia (%)
Place of birth for the foreign-born population - Philippines (%)
Place of birth for the foreign-born population - Singapore (%)
Place of birth for the foreign-born population - Thailand (%)
Place of birth for the foreign-born population - Vietnam (%)
Place of birth for the foreign-born population - Other South Eastern Asia (%)
Place of birth for the foreign-born population - Armenia (%)
Place of birth for the foreign-born population - Iraq (%)
Place of birth for the foreign-born population - Israel (%)
Place of birth for the foreign-born population - Jordan (%)
Place of birth for the foreign-born population - Kuwait (%)
Place of birth for the foreign-born population - Lebanon (%)
Place of birth for the foreign-born population - Saudi Arabia (%)
Place of birth for the foreign-born population - Syria (%)
Place of birth for the foreign-born population - Turkey (%)
Place of birth for the foreign-born population - Yemen (%)
Place of birth for the foreign-born population - Other Western Asia (%)
Place of birth for the foreign-born population - Eritrea (%)
Place of birth for the foreign-born population - Ethiopia (%)
Place of birth for the foreign-born population - Kenya (%)
Place of birth for the foreign-born population - Somalia (%)
Place of birth for the foreign-born population - Uganda (%)
Place of birth for the foreign-born population - Zimbabwe (%)
Place of birth for the foreign-born population - Other Eastern Africa (%)
Place of birth for the foreign-born population - Cameroon (%)
Place of birth for the foreign-born population - Congo (%)
Place of birth for the foreign-born population - Democratic Republic of Congo (Zaire) (%)
Place of birth for the foreign-born population - Other Middle Africa (%)
Place of birth for the foreign-born population - Egypt (%)
Place of birth for the foreign-born population - Morocco (%)
Place of birth for the foreign-born population - Sudan (%)
Place of birth for the foreign-born population - Other Northern Africa (%)
Place of birth for the foreign-born population - South Africa (%)
Place of birth for the foreign-born population - Other Southern Africa (%)
Place of birth for the foreign-born population - Cabo Verde (%)
Place of birth for the foreign-born population - Ghana (%)
Place of birth for the foreign-born population - Liberia (%)
Place of birth for the foreign-born population - Nigeria (%)
Place of birth for the foreign-born population - Senegal (%)
Place of birth for the foreign-born population - Sierra Leone (%)
Place of birth for the foreign-born population - Other Western Africa (%)
Place of birth for the foreign-born population - Australia (%)
Place of birth for the foreign-born population - New Zealand (%)
Place of birth for the foreign-born population - Fiji (%)
Place of birth for the foreign-born population - Micronesia (%)
Place of birth for the foreign-born population - Bahamas (%)
Place of birth for the foreign-born population - Barbados (%)
Place of birth for the foreign-born population - Cuba (%)
Place of birth for the foreign-born population - Dominica (%)
Place of birth for the foreign-born population - Dominican Republic (%)
Place of birth for the foreign-born population - Grenada (%)
Place of birth for the foreign-born population - Haiti (%)
Place of birth for the foreign-born population - Jamaica (%)
Place of birth for the foreign-born population - St. Vincent and the Grenadines (%)
Place of birth for the foreign-born population - Trinidad and Tobago (%)
Place of birth for the foreign-born population - West Indies (%)
Place of birth for the foreign-born population - Other Caribbean (%)
Place of birth for the foreign-born population - Belize (%)
Place of birth for the foreign-born population - Costa Rica (%)
Place of birth for the foreign-born population - El Salvador (%)
Place of birth for the foreign-born population - Guatemala (%)
Place of birth for the foreign-born population - Honduras (%)
Place of birth for the foreign-born population - Mexico (%)
Place of birth for the foreign-born population - Nicaragua (%)
Place of birth for the foreign-born population - Panama (%)
Place of birth for the foreign-born population - Other Central America (%)
Place of birth for the foreign-born population - Argentina (%)
Place of birth for the foreign-born population - Bolivia (%)
Place of birth for the foreign-born population - Brazil (%)
Place of birth for the foreign-born population - Chile (%)
Place of birth for the foreign-born population - Colombia (%)
Place of birth for the foreign-born population - Ecuador (%)
Place of birth for the foreign-born population - Guyana (%)
Place of birth for the foreign-born population - Peru (%)
Place of birth for the foreign-born population - Uruguay (%)
Place of birth for the foreign-born population - Venezuela (%)
Place of birth for the foreign-born population - Other South America (%)
Place of birth for the foreign-born population - Canada (%)
Place of birth for the foreign-born population - Other Northern America (%)
Place of birth for the foreign-born population - Other (%)
Latest news about races in Flowood, MS collected exclusively by city-data.com from local newspapers, TV, and radio stations
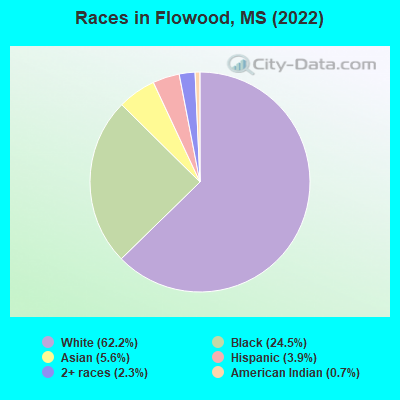
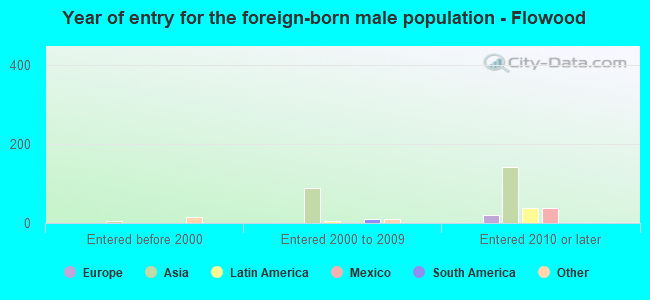
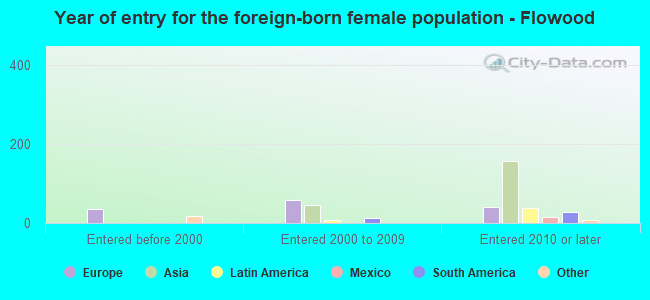
According to 2022 data, the most numerous races in Flowood, MS are White alone (6,303 residents), Black alone (2,485 residents), and Hispanic (400 residents). 89.2% of Flowood residents speak English at home. 7.0% of Flowood, MS residents are foreign-born (4.0% born in Asia, 1.5% born in Europe, 0.9% born in Latin America), which is 71.6% greater than the foreign-born rate of 2.0% across the entire state of Mississippi.
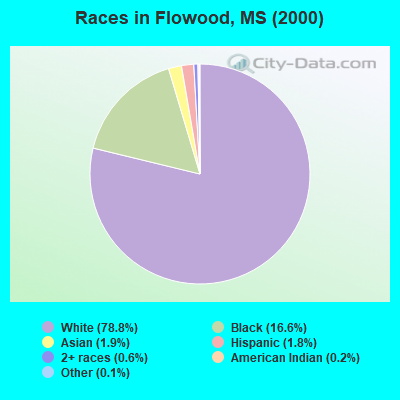
Race distribution in Flowood
2000 2022
1,727,908 60.7% White alone 1,028,473 36.2% Black alone 39,569 1.4% Hispanic 17,272 0.6% Two or more races 18,349 0.6% Asian alone 11,224 0.4% American Indian alone 1,294 0.05% Other race alone 569 0.02% Native Hawaiian and Other
1,625,979 55.3% White alone 1,072,962 36.5% Black alone 97,177 3.3% Hispanic 96,367 3.3% Two or more races 25,217 0.9% Asian alone 12,457 0.4% American Indian alone 9,501 0.3% Other race alone 397 0.01% Native Hawaiian and Other
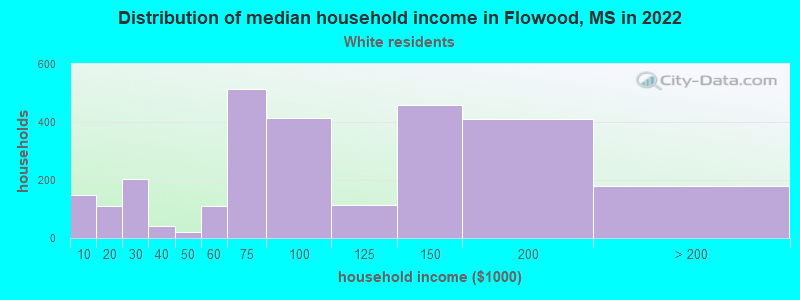
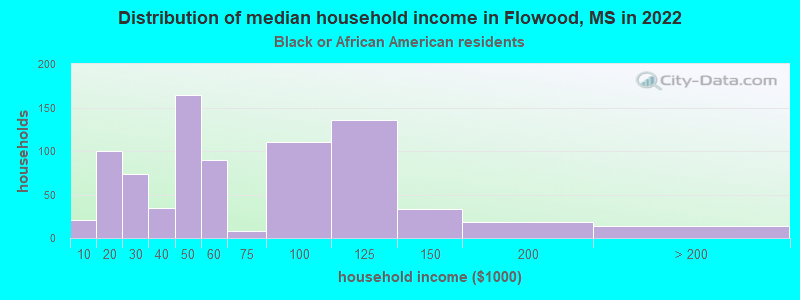
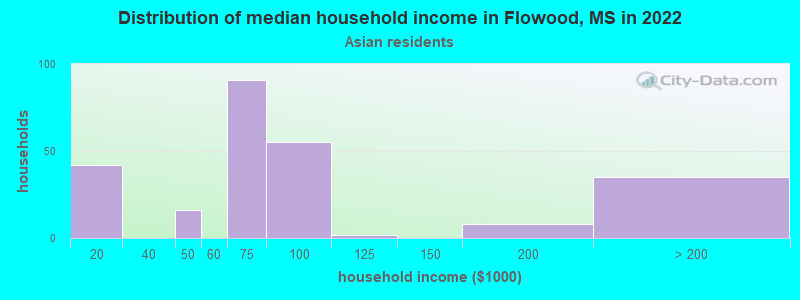
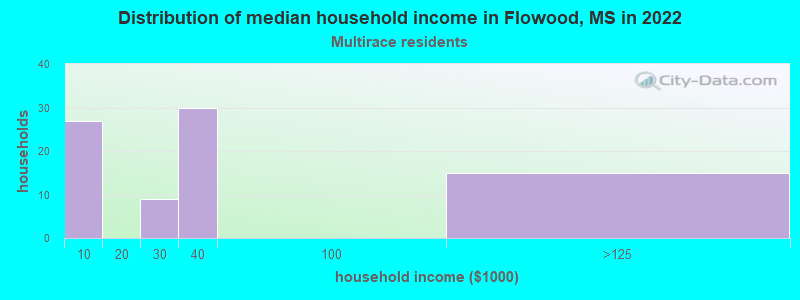
Income and house value in Flowood Median household income in 2022 $87,577 White non-Hispanic householders$69,354 Black householders$61,045 Asian householders$25,847 Two or more races householdersMedian 2022 house value $293,791 White Non-Hispanic householders$146,503 Black or African American householders$117,725 Two or more races householders
Median age by race in Flowood
42.2 Median age for White residents41.5 42.8 27.5 Median age for Black or African American residents28.3 27.6 30.5 Median age for American Indian / Alaska Native residents-751,111,110.4 -710,601,718.5 26.7 Median age for Asian residents27.7 32.4 -666,666,666.0 Median age for Native Hawaiian / Pacific Islander residents-666,666,666.0 -666,666,666.0 36.0 Median age for Other race residents52.4 -453,416,148.6 6.0 Median age for Two or more races residents8.3 4.5 42.3 Median age for White alone residents41.5 44.2 23.6 Median age for Hispanic or Latino residents32.6 28.1
Owner/renter occupied households by race in Flowood
House owners and renters - White residents 1,668 58.5% Owner occupied1,185 41.5% Renter occupiedHouse owners and renters - Black or African American residents 272 33.3% Owner occupied545 66.7% Renter occupiedHouse owners and renters - Asian residents 71 35.5% Owner occupied129 64.5% Renter occupiedHouse owners and renters - Other race residents 56 100.0% Owner occupiedHouse owners and renters - Two or more races residents 49 58.6% Owner occupied34 41.4% Renter occupiedHouse owners and renters - White alone residents 1,660 59.8% Owner occupied1,118 40.2% Renter occupiedHouse owners and renters - Hispanic or Latino residents 43 30.1% Owner occupied100 69.9% Renter occupied
Language usage in Flowood
English speakers - Total 89.2% of residents of Flowood speak English at home.
1.7% of residents speak Spanish at home 130 79.3% Speak English very well34 20.7% Speak English less than very well9.9% of residents speak other language at home 578 61.0% Speak English very well369 39.0% Speak English less than very well
English speakers - Born in the United States 89.5% of residents of Flowood speak English at home.
4.6% of residents speak Spanish at home 74 70.5% Speak English very well31 29.5% Speak English less than very well9.0% of residents speak other language at home 157 77.0% Speak English very well47 23.0% Speak English less than very well
English speakers - Native, born elsewhere 13.3% of residents of Flowood speak English at home.
143.3% of residents speak other language at home 43 100.0% Speak English very well
English speakers - Foreign-born 8.2% of residents of Flowood speak English at home.
6.2% of residents speak Spanish at home 25 59.5% Speak English very well17 40.5% Speak English less than very well106.7% of residents speak other language at home 495 68.8% Speak English very well224 31.2% Speak English less than very well
White (Caucasian) - Speak only English Native:
97.1% (5,876)Foreign-born:
20.0% (46)
White (Caucasian) - Speak another language Native:
2.8% (167)Foreign-born:
100.0% (231)
Asian - Speak another language Native:
80.7% (154)Foreign-born:
93.8% (404)
Other race - Speak another language Native:
48.7% (60)Foreign-born:
100.0% (11)
Two or more races - Speak only English Native:
100.0% (304)Foreign-born:
40.6% (10)
White alone - Speak only English Native:
98.0% (5,879)Foreign-born:
19.4% (48)
White alone - Speak another language Native:
2.1% (127)Foreign-born:
100.0% (250)
Hispanic or Latino - Speak another language Native:
37.1% (102)Foreign-born:
100.0% (63)
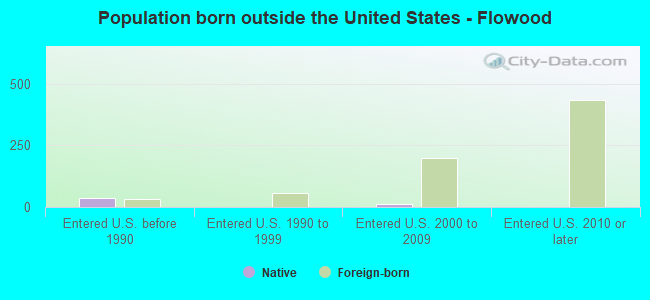
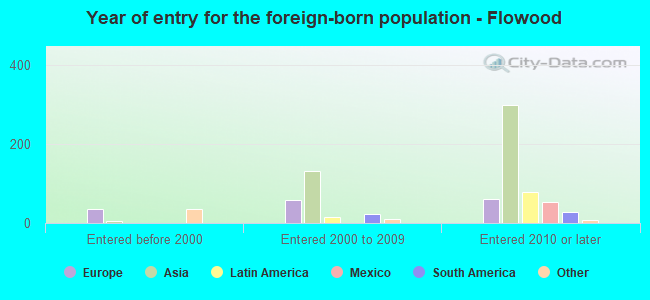
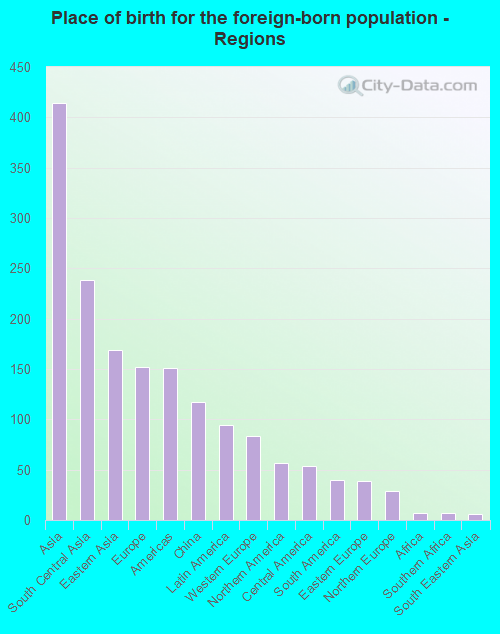
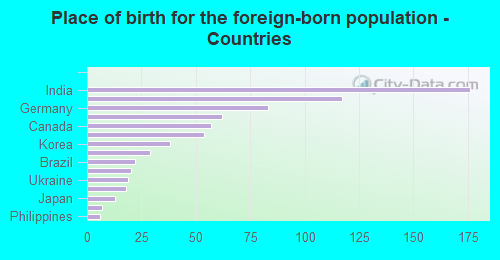
Foreign-born residents in Flowood 726 residents are foreign born (4.0% Asia , 1.5% Europe , 0.9% Latin America ).
This city:
7.0%Mississippi:
2.3%
Marital status for residents in Flowood Marital status - White (Caucasian) population 15 years and over
Males 31.6% Never married61.2% Now married1.0% Separated2.1% Widowed4.0% DivorcedFemales 21.0% Never married56.3% Now married0.0% Separated10.5% Widowed12.2% DivorcedWomen who gave birth in the past 12 months Now married:
73.1% (19)Unmarried:
26.9% (7)
Women who did not give birth in the past 12 months Now married:
57.7% (912)Unmarried:
42.3% (668)
Marital status - Black or African American population 15 years and over
Males 30.8% Never married60.1% Now married3.6% Separated1.7% Widowed3.8% DivorcedFemales 29.9% Never married46.8% Now married14.5% Separated1.1% Widowed7.7% DivorcedWomen who gave birth in the past 12 months Now married:
100.0% (46)Unmarried:
0.0% (0)
Women who did not give birth in the past 12 months Now married:
64.9% (444)Unmarried:
35.1% (240)
Marital status - American Indian / Alaska Native population 15 years and over
Males 0.0% Never married100.0% Now married0.0% Separated0.0% Widowed0.0% DivorcedFemales 100.0% Never married0.0% Now married0.0% Separated0.0% Widowed0.0% DivorcedWomen who did not give birth in the past 12 months Now married:
0.0% (0)Unmarried:
100.0% (10)
Marital status - Asian population 15 years and over
Males 22.9% Never married53.9% Now married0.0% Separated0.0% Widowed23.2% DivorcedFemales 19.0% Never married81.0% Now married0.0% Separated0.0% Widowed0.0% DivorcedWomen who gave birth in the past 12 months Now married:
100.0% (31)Unmarried:
0.0% (0)
Women who did not give birth in the past 12 months Now married:
78.1% (157)Unmarried:
21.9% (44)
Marital status - Other race population 15 years and over
Males 13.2% Never married5.7% Now married0.0% Separated0.0% Widowed81.1% DivorcedFemales 0.0% Never married16.7% Now married0.0% Separated0.0% Widowed83.3% DivorcedWomen who did not give birth in the past 12 months Now married:
100.0% (13)Unmarried:
0.0% (0)
Marital status - Two or more races population 15 years and over
Males 0.0% Never married42.2% Now married0.0% Separated37.8% Widowed20.0% DivorcedFemales 4.7% Never married62.5% Now married0.0% Separated23.4% Widowed9.4% DivorcedWomen who gave birth in the past 12 months Now married:
100.0% (17)Unmarried:
0.0% (0)
Women who did not give birth in the past 12 months Now married:
62.5% (51)Unmarried:
37.5% (30)
Marital status - White alone, not Hispanic / Latino population 15 years and over
Males 31.9% Never married60.8% Now married1.1% Separated2.2% Widowed4.1% DivorcedFemales 21.6% Never married54.9% Now married0.0% Separated10.8% Widowed12.6% DivorcedWomen who gave birth in the past 12 months Now married:
73.1% (19)Unmarried:
26.9% (7)
Women who did not give birth in the past 12 months Now married:
55.3% (833)Unmarried:
44.7% (674)
Marital status - Hispanic or Latino population 15 years and over
Males 7.9% Never married43.8% Now married0.0% Separated0.0% Widowed48.3% DivorcedFemales 1.9% Never married61.1% Now married0.0% Separated9.3% Widowed27.8% DivorcedWomen who did not give birth in the past 12 months Now married:
84.6% (107)Unmarried:
15.4% (20)
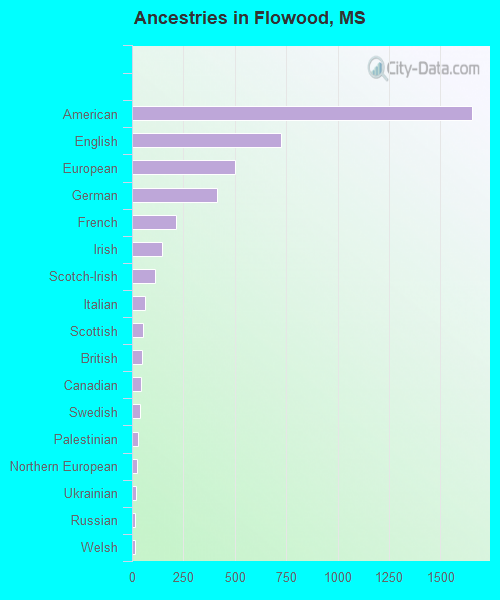
Ancestries in Flowood
1,654 21.9% American724 9.6% English500 6.6% European412 5.5% German212 2.8% French147 1.9% Irish110 1.5% Scotch-Irish62 0.8% Italian55 0.7% Scottish51 0.7% British43 0.6% Canadian41 0.5% Swedish30 0.4% Palestinian25 0.3% Northern European21 0.3% Ukrainian17 0.2% Russian16 0.2% Welsh10 0.1% South African9 0.1% Greek7 0.09% Polish6 0.08% African1 0.01% Cajun
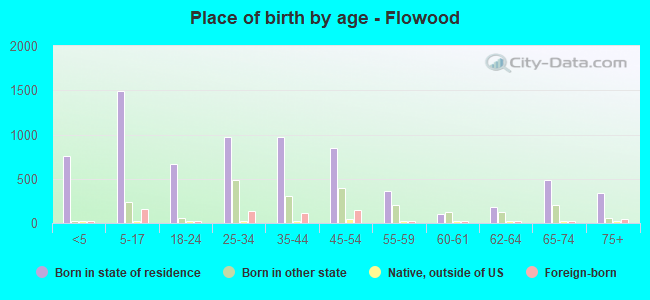
Children Nativity (place of birth) in Flowood
Children under 6 years - Living with two parents Both parents native 447 100.0% NativeBoth parents foreign-born 20 100.0% NativeOne native, one foreign-born parent 16 100.0% NativeChildren under 6 years - Living with one parent Native parent 414 100.0% NativeChildren 6 to 17 years - Living with two parents Both parents native 1,018 100.0% NativeBoth parents foreign-born 46 38.6% Native72 61.4% Foreign-bornOne native, one foreign-born parent 68 87.3% Native10 12.7% Foreign-bornChildren 6 to 17 years - Living with one parent Native parent 385 100.0% NativeForeign-born parent 35 46.3% Native41 53.7% Foreign-born
Grandparents responsible for own grandchildren in Flowood
Grandparents (30 to 59 years) Black or African American 23 100.0% Not responsible for grandchildren
Grandparents (60 years and over)