Races in Florida City, Florida (FL) Detailed Stats
Data:
Races - White alone (%)
Races - White alone (% change since 2000)
Races - Black alone (%)
Races - Black alone (% change since 2000)
Races - American Indian alone (%)
Races - American Indian alone (% change since 2000)
Races - Asian alone (%)
Races - Asian alone (% change since 2000)
Races - Hispanic (%)
Races - Hispanic (% change since 2000)
Races - Native Hawaiian and Other Pacific Islander alone (%)
Races - Native Hawaiian and Other Pacific Islander alone (% change since 2000)
Races - Two or more races(%)
Races - Two or more races(% change since 2000)
Races - Other race alone (%)
Races - Other race alone (% change since 2000)
Racial diversity
Place of birth - Born in state of residence (%)
Place of birth - Born in state of residence (%) - White
Place of birth - Born in state of residence (%) - Black or African American
Place of birth - Born in state of residence (%) - Asian
Place of birth - Born in state of residence (%) - Hispanic or Latino
Place of birth - Born in state of residence (%) - American Indian and Alaska Native
Place of birth - Born in state of residence (%) - Multirace
Place of birth - Born in state of residence (%) - Other Race
Place of birth - Born in other state (%)
Place of birth - Born in other state (%) - White
Place of birth - Born in other state (%) - Black or African American
Place of birth - Born in other state (%) - Asian
Place of birth - Born in other state (%) - Hispanic or Latino
Place of birth - Born in other state (%) - American Indian and Alaska Native
Place of birth - Born in other state (%) - Multirace
Place of birth - Born in other state (%) - Other Race
Place of birth - Native, outside of US (%)
Place of birth - Native, outside of US (%) - White
Place of birth - Native, outside of US (%) - Black or African American
Place of birth - Native, outside of US (%) - Asian
Place of birth - Native, outside of US (%) - Hispanic or Latino
Place of birth - Native, outside of US (%) - American Indian and Alaska Native
Place of birth - Native, outside of US (%) - Multirace
Place of birth - Native, outside of US (%) - Other Race
Place of birth - Foreign born (%)
Place of birth - Foreign born (%) - White
Place of birth - Foreign born (%) - Black or African American
Place of birth - Foreign born (%) - Asian
Place of birth - Foreign born (%) - Hispanic or Latino
Place of birth - Foreign born (%) - American Indian and Alaska Native
Place of birth - Foreign born (%) - Multirace
Place of birth - Foreign born (%) - Other Race
Residents speaking English at home (%)
Residents speaking English at home - Born in the United States (%)
Residents speaking English at home - Native, born elsewhere (%)
Residents speaking English at home - Foreign born (%)
Residents speaking Spanish at home (%)
Residents speaking Spanish at home - Born in the United States (%)
Residents speaking Spanish at home - Native, born elsewhere (%)
Residents speaking Spanish at home - Foreign born (%)
Residents speaking other language at home (%)
Residents speaking other language at home - Born in the United States (%)
Residents speaking other language at home - Native, born elsewhere (%)
Residents speaking other language at home - Foreign born (%)
Marital status - Never married (%)
Marital status - Now married (%)
Marital status - Separated (%)
Marital status - Widowed (%)
Marital status - Divorced (%)
Ancestries Reported - Arab (%)
Ancestries Reported - Czech (%)
Ancestries Reported - Danish (%)
Ancestries Reported - Dutch (%)
Ancestries Reported - English (%)
Ancestries Reported - French (%)
Ancestries Reported - French Canadian (%)
Ancestries Reported - German (%)
Ancestries Reported - Greek (%)
Ancestries Reported - Hungarian (%)
Ancestries Reported - Irish (%)
Ancestries Reported - Italian (%)
Ancestries Reported - Lithuanian (%)
Ancestries Reported - Norwegian (%)
Ancestries Reported - Polish (%)
Ancestries Reported - Portuguese (%)
Ancestries Reported - Russian (%)
Ancestries Reported - Scotch-Irish (%)
Ancestries Reported - Scottish (%)
Ancestries Reported - Slovak (%)
Ancestries Reported - Subsaharan African (%)
Ancestries Reported - Swedish (%)
Ancestries Reported - Swiss (%)
Ancestries Reported - Ukrainian (%)
Ancestries Reported - United States (%)
Ancestries Reported - Welsh (%)
Ancestries Reported - West Indian (%)
Ancestries Reported - Other (%)
Geographical mobility - Same house 1 year ago (%)
Geographical mobility - Same house 1 year ago (%) - White
Geographical mobility - Same house 1 year ago (%) - Black or African American
Geographical mobility - Same house 1 year ago (%) - Asian
Geographical mobility - Same house 1 year ago (%) - Hispanic or Latino
Geographical mobility - Same house 1 year ago (%) - American Indian and Alaska Native
Geographical mobility - Same house 1 year ago (%) - Multirace
Geographical mobility - Same house 1 year ago (%) - Other Race
Geographical mobility - Moved within same county (%)
Geographical mobility - Moved within same county (%) - White
Geographical mobility - Moved within same county (%) - Black or African American
Geographical mobility - Moved within same county (%) - Asian
Geographical mobility - Moved within same county (%) - Hispanic or Latino
Geographical mobility - Moved within same county (%) - American Indian and Alaska Native
Geographical mobility - Moved within same county (%) - Multirace
Geographical mobility - Moved within same county (%) - Other Race
Geographical mobility - Moved from different county within same state (%)
Geographical mobility - Moved from different county within same state (%) - White
Geographical mobility - Moved from different county within same state (%) - Black or African American
Geographical mobility - Moved from different county within same state (%) - Asian
Geographical mobility - Moved from different county within same state (%) - Hispanic or Latino
Geographical mobility - Moved from different county within same state (%) - American Indian and Alaska Native
Geographical mobility - Moved from different county within same state (%) - Multirace
Geographical mobility - Moved from different county within same state (%) - Other Race
Geographical mobility - Moved from different state (%)
Geographical mobility - Moved from different state (%) - White
Geographical mobility - Moved from different state (%) - Black or African American
Geographical mobility - Moved from different state (%) - Asian
Geographical mobility - Moved from different state (%) - Hispanic or Latino
Geographical mobility - Moved from different state (%) - American Indian and Alaska Native
Geographical mobility - Moved from different state (%) - Multirace
Geographical mobility - Moved from different state (%) - Other Race
Geographical mobility - Moved from abroad (%)
Geographical mobility - Moved from abroad (%) - White
Geographical mobility - Moved from abroad (%) - Black or African American
Geographical mobility - Moved from abroad (%) - Asian
Geographical mobility - Moved from abroad (%) - Hispanic or Latino
Geographical mobility - Moved from abroad (%) - American Indian and Alaska Native
Geographical mobility - Moved from abroad (%) - Multirace
Geographical mobility - Moved from abroad (%) - Other Race
Place of birth for the foreign-born population - Ireland (%)
Place of birth for the foreign-born population - Denmark (%)
Place of birth for the foreign-born population - Norway (%)
Place of birth for the foreign-born population - Sweden (%)
Place of birth for the foreign-born population - United Kingdom (%)
Place of birth for the foreign-born population - England (%)
Place of birth for the foreign-born population - Scotland (%)
Place of birth for the foreign-born population - Other Northern Europe (%)
Place of birth for the foreign-born population - Austria (%)
Place of birth for the foreign-born population - Belgium (%)
Place of birth for the foreign-born population - France (%)
Place of birth for the foreign-born population - Germany (%)
Place of birth for the foreign-born population - Netherlands (%)
Place of birth for the foreign-born population - Switzerland (%)
Place of birth for the foreign-born population - Other Western Europe (%)
Place of birth for the foreign-born population - Greece (%)
Place of birth for the foreign-born population - Italy (%)
Place of birth for the foreign-born population - Portugal (%)
Place of birth for the foreign-born population - Spain (%)
Place of birth for the foreign-born population - Other Southern Europe (%)
Place of birth for the foreign-born population - Albania (%)
Place of birth for the foreign-born population - Belarus (%)
Place of birth for the foreign-born population - Bosnia and Herzegovina (%)
Place of birth for the foreign-born population - Bulgaria (%)
Place of birth for the foreign-born population - Croatia (%)
Place of birth for the foreign-born population - Czechoslovakia (%)
Place of birth for the foreign-born population - Hungary (%)
Place of birth for the foreign-born population - Latvia (%)
Place of birth for the foreign-born population - Lithuania (%)
Place of birth for the foreign-born population - North Macedonia (Macedonia) (%)
Place of birth for the foreign-born population - Moldova (%)
Place of birth for the foreign-born population - Poland (%)
Place of birth for the foreign-born population - Romania (%)
Place of birth for the foreign-born population - Russia (%)
Place of birth for the foreign-born population - Serbia (%)
Place of birth for the foreign-born population - Ukraine (%)
Place of birth for the foreign-born population - Other Eastern Europe (%)
Place of birth for the foreign-born population - China (%)
Place of birth for the foreign-born population - Hong Kong (%)
Place of birth for the foreign-born population - Taiwan (%)
Place of birth for the foreign-born population - Japan (%)
Place of birth for the foreign-born population - Korea (%)
Place of birth for the foreign-born population - Other Eastern Asia (%)
Place of birth for the foreign-born population - Afghanistan (%)
Place of birth for the foreign-born population - Bangladesh (%)
Place of birth for the foreign-born population - India (%)
Place of birth for the foreign-born population - Iran (%)
Place of birth for the foreign-born population - Kazakhstan (%)
Place of birth for the foreign-born population - Nepal (%)
Place of birth for the foreign-born population - Pakistan (%)
Place of birth for the foreign-born population - Sri Lanka (%)
Place of birth for the foreign-born population - Uzbekistan (%)
Place of birth for the foreign-born population - Other South Central Asia (%)
Place of birth for the foreign-born population - Burma (%)
Place of birth for the foreign-born population - Cambodia (%)
Place of birth for the foreign-born population - Indonesia (%)
Place of birth for the foreign-born population - Laos (%)
Place of birth for the foreign-born population - Malaysia (%)
Place of birth for the foreign-born population - Philippines (%)
Place of birth for the foreign-born population - Singapore (%)
Place of birth for the foreign-born population - Thailand (%)
Place of birth for the foreign-born population - Vietnam (%)
Place of birth for the foreign-born population - Other South Eastern Asia (%)
Place of birth for the foreign-born population - Armenia (%)
Place of birth for the foreign-born population - Iraq (%)
Place of birth for the foreign-born population - Israel (%)
Place of birth for the foreign-born population - Jordan (%)
Place of birth for the foreign-born population - Kuwait (%)
Place of birth for the foreign-born population - Lebanon (%)
Place of birth for the foreign-born population - Saudi Arabia (%)
Place of birth for the foreign-born population - Syria (%)
Place of birth for the foreign-born population - Turkey (%)
Place of birth for the foreign-born population - Yemen (%)
Place of birth for the foreign-born population - Other Western Asia (%)
Place of birth for the foreign-born population - Eritrea (%)
Place of birth for the foreign-born population - Ethiopia (%)
Place of birth for the foreign-born population - Kenya (%)
Place of birth for the foreign-born population - Somalia (%)
Place of birth for the foreign-born population - Uganda (%)
Place of birth for the foreign-born population - Zimbabwe (%)
Place of birth for the foreign-born population - Other Eastern Africa (%)
Place of birth for the foreign-born population - Cameroon (%)
Place of birth for the foreign-born population - Congo (%)
Place of birth for the foreign-born population - Democratic Republic of Congo (Zaire) (%)
Place of birth for the foreign-born population - Other Middle Africa (%)
Place of birth for the foreign-born population - Egypt (%)
Place of birth for the foreign-born population - Morocco (%)
Place of birth for the foreign-born population - Sudan (%)
Place of birth for the foreign-born population - Other Northern Africa (%)
Place of birth for the foreign-born population - South Africa (%)
Place of birth for the foreign-born population - Other Southern Africa (%)
Place of birth for the foreign-born population - Cabo Verde (%)
Place of birth for the foreign-born population - Ghana (%)
Place of birth for the foreign-born population - Liberia (%)
Place of birth for the foreign-born population - Nigeria (%)
Place of birth for the foreign-born population - Senegal (%)
Place of birth for the foreign-born population - Sierra Leone (%)
Place of birth for the foreign-born population - Other Western Africa (%)
Place of birth for the foreign-born population - Australia (%)
Place of birth for the foreign-born population - New Zealand (%)
Place of birth for the foreign-born population - Fiji (%)
Place of birth for the foreign-born population - Micronesia (%)
Place of birth for the foreign-born population - Bahamas (%)
Place of birth for the foreign-born population - Barbados (%)
Place of birth for the foreign-born population - Cuba (%)
Place of birth for the foreign-born population - Dominica (%)
Place of birth for the foreign-born population - Dominican Republic (%)
Place of birth for the foreign-born population - Grenada (%)
Place of birth for the foreign-born population - Haiti (%)
Place of birth for the foreign-born population - Jamaica (%)
Place of birth for the foreign-born population - St. Vincent and the Grenadines (%)
Place of birth for the foreign-born population - Trinidad and Tobago (%)
Place of birth for the foreign-born population - West Indies (%)
Place of birth for the foreign-born population - Other Caribbean (%)
Place of birth for the foreign-born population - Belize (%)
Place of birth for the foreign-born population - Costa Rica (%)
Place of birth for the foreign-born population - El Salvador (%)
Place of birth for the foreign-born population - Guatemala (%)
Place of birth for the foreign-born population - Honduras (%)
Place of birth for the foreign-born population - Mexico (%)
Place of birth for the foreign-born population - Nicaragua (%)
Place of birth for the foreign-born population - Panama (%)
Place of birth for the foreign-born population - Other Central America (%)
Place of birth for the foreign-born population - Argentina (%)
Place of birth for the foreign-born population - Bolivia (%)
Place of birth for the foreign-born population - Brazil (%)
Place of birth for the foreign-born population - Chile (%)
Place of birth for the foreign-born population - Colombia (%)
Place of birth for the foreign-born population - Ecuador (%)
Place of birth for the foreign-born population - Guyana (%)
Place of birth for the foreign-born population - Peru (%)
Place of birth for the foreign-born population - Uruguay (%)
Place of birth for the foreign-born population - Venezuela (%)
Place of birth for the foreign-born population - Other South America (%)
Place of birth for the foreign-born population - Canada (%)
Place of birth for the foreign-born population - Other Northern America (%)
Place of birth for the foreign-born population - Other (%)
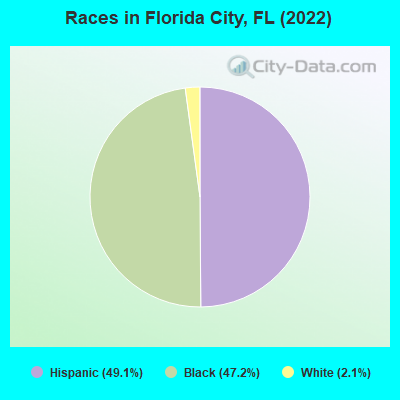
According to 2022 data, the most numerous races in Florida City, FL are White alone (262 residents), Hispanic (6,271 residents), and Black alone (6,032 residents). 45.3% of Florida City residents speak English at home. 33.6% of Florida City, FL residents are foreign-born (33.3% born in Latin America), which is 37.5% greater than the foreign-born rate of 21.0% across the entire state of Florida.
Race distribution in Florida City
2000 2022
10,458,509 65.4% White alone 2,682,715 16.8% Hispanic 2,264,268 14.2% Black alone 261,693 1.6% Asian alone 236,954 1.5% Two or more races 42,358 0.3% American Indian alone 28,994 0.2% Other race alone 6,887 0.04% Native Hawaiian and Other
11,309,403 50.8% White alone 6,025,039 27.1% Hispanic 3,241,015 14.6% Black alone 861,630 3.9% Two or more races 623,692 2.8% Asian alone 152,054 0.7% Other race alone 22,504 0.1% American Indian alone 9,486 0.04% Native Hawaiian and Other
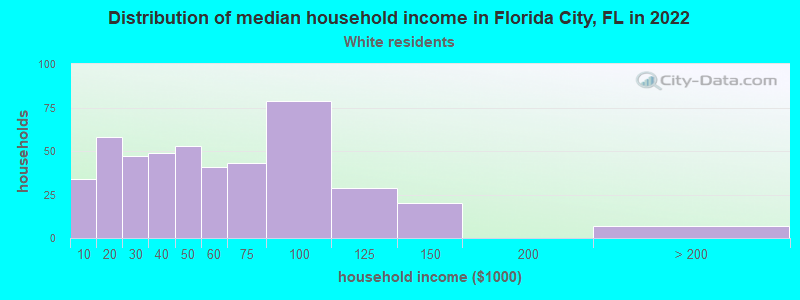
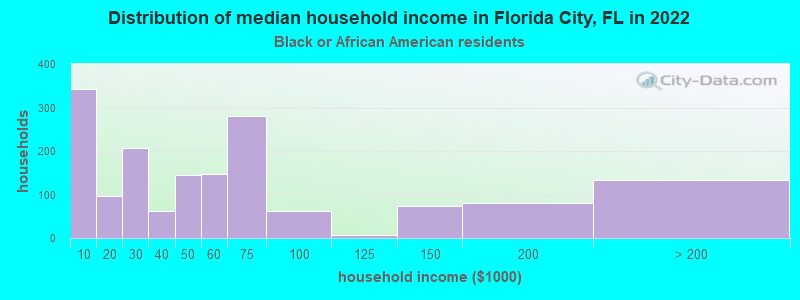
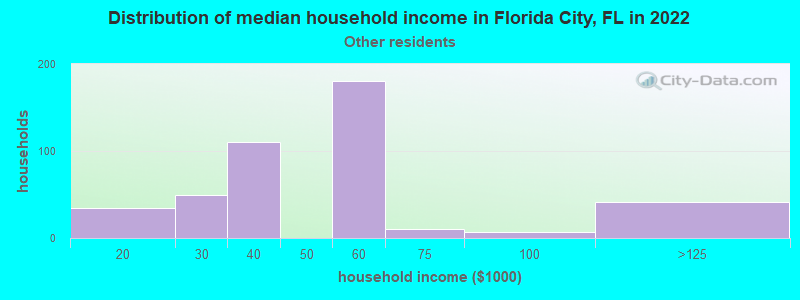
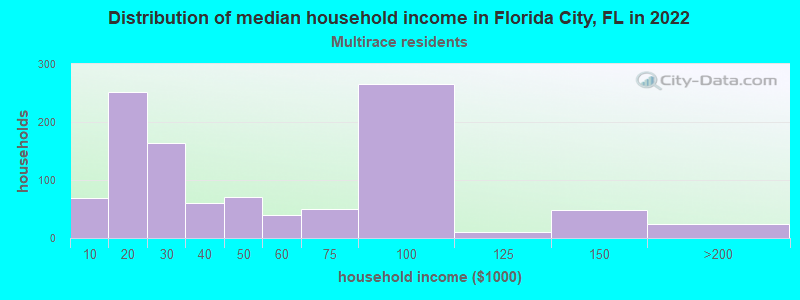
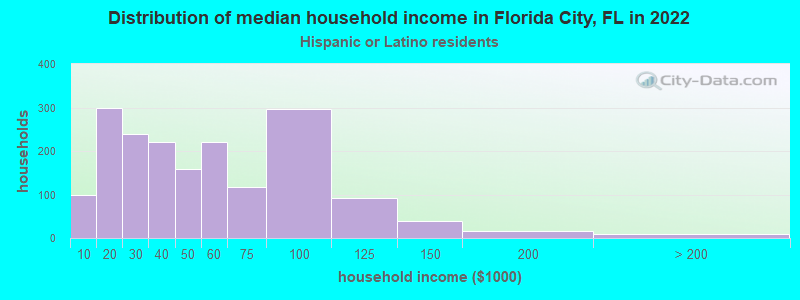
Income and house value in Florida City Median household income in 2022 $92,977 White non-Hispanic householders$51,000 Black householders$41,653 Some other race householders$42,047 Hispanic or Latino race householdersMedian 2022 house value $321,881 White Non-Hispanic householders$246,641 Black or African American householders $341,999 Asian householders$308,603 Some other race householders$354,069 Two or more races householders$326,709 Hispanic or Latino householders
Median age by race in Florida City
25.3 Median age for White residents25.4 25.9 25.6 Median age for Black or African American residents22.8 26.8 -653,446,647.1 Median age for American Indian / Alaska Native residents-543,352,600.6 -762,696,213.5 -673,333,332.7 Median age for Asian residents-697,674,417.9 -653,626,731.2 -679,849,340.2 Median age for Native Hawaiian / Pacific Islander residents-858,307,848.3 -443,298,968.6 28.8 Median age for Other race residents26.6 40.1 44.6 Median age for Two or more races residents50.4 44.2 35.4 Median age for White alone residents34.5 35.5 30.6 Median age for Hispanic or Latino residents29.0 32.0
Owner/renter occupied households by race in Florida City
House owners and renters - White residents 130 26.2% Owner occupied366 73.8% Renter occupiedHouse owners and renters - Black or African American residents 352 20.8% Owner occupied1,337 79.2% Renter occupiedHouse owners and renters - Other race residents 113 23.8% Owner occupied361 76.2% Renter occupiedHouse owners and renters - Two or more races residents 338 30.6% Owner occupied765 69.4% Renter occupiedHouse owners and renters - White alone residents 42 42.9% Owner occupied55 57.1% Renter occupiedHouse owners and renters - Hispanic or Latino residents 468 25.4% Owner occupied1,374 74.6% Renter occupied
Language usage in Florida City
English speakers - Total 45.3% of residents of Florida City speak English at home.
46.3% of residents speak Spanish at home 2,595 48.7% Speak English very well2,729 51.3% Speak English less than very well8.6% of residents speak other language at home 640 64.6% Speak English very well351 35.4% Speak English less than very well
English speakers - Born in the United States 83.6% of residents of Florida City speak English at home.
16.0% of residents speak Spanish at home 131 85.1% Speak English very well23 14.9% Speak English less than very well
English speakers - Native, born elsewhere 62.6% of residents of Florida City speak English at home.
46.8% of residents speak Spanish at home 41 23.4% Speak English very well134 76.6% Speak English less than very well
English speakers - Foreign-born 6.5% of residents of Florida City speak English at home.
75.8% of residents speak Spanish at home 885 27.8% Speak English very well2,300 72.2% Speak English less than very well17.8% of residents speak other language at home 409 54.7% Speak English very well339 45.3% Speak English less than very well
White (Caucasian) - Speak only English Native:
34.1% (433)Foreign-born:
3.7% (23)
White (Caucasian) - Speak another language Native:
58.6% (743)Foreign-born:
94.2% (598)
Black or African American - Speak only English Native:
93.6% (4,123)Foreign-born:
17.4% (154)
Black or African American - Speak another language Native:
6.4% (283)Foreign-born:
81.4% (723)
Other race - Speak only English Native:
9.0% (85)Foreign-born:
13.4% (95)
Other race - Speak another language Native:
90.9% (858)Foreign-born:
86.5% (616)
Two or more races - Speak another language Native:
92.0% (340)Foreign-born:
99.4% (1,991)
Hispanic or Latino - Speak only English Native:
17.3% (440)Foreign-born:
3.5% (114)
Hispanic or Latino - Speak another language Native:
82.7% (2,101)Foreign-born:
96.5% (3,175)
Foreign-born residents in Florida City 4,291 residents are foreign born (33.3% Latin America ).
This city:
33.6%Florida:
21.1%
Marital status for residents in Florida City Marital status - White (Caucasian) population 15 years and over
Males 51.2% Never married37.5% Now married2.7% Separated0.0% Widowed8.7% DivorcedFemales 44.4% Never married38.8% Now married3.7% Separated2.3% Widowed10.7% DivorcedWomen who gave birth in the past 12 months Now married:
15.7% (7)Unmarried:
84.3% (38)
Women who did not give birth in the past 12 months Now married:
34.7% (120)Unmarried:
65.3% (225)
Marital status - Black or African American population 15 years and over
Males 61.5% Never married36.0% Now married0.9% Separated0.7% Widowed0.9% DivorcedFemales 62.3% Never married23.3% Now married3.0% Separated6.3% Widowed5.1% DivorcedWomen who gave birth in the past 12 months Now married:
30.2% (50)Unmarried:
69.8% (116)
Women who did not give birth in the past 12 months Now married:
18.2% (278)Unmarried:
81.8% (1,251)
Marital status - Other race population 15 years and over
Males 73.6% Never married25.6% Now married0.0% Separated0.0% Widowed0.8% DivorcedFemales 56.6% Never married33.6% Now married0.0% Separated7.5% Widowed2.3% DivorcedWomen who did not give birth in the past 12 months Now married:
32.2% (164)Unmarried:
67.8% (347)
Marital status - Two or more races population 15 years and over
Males 36.7% Never married38.8% Now married0.0% Separated1.6% Widowed22.9% DivorcedFemales 26.1% Never married38.9% Now married3.5% Separated15.2% Widowed16.3% DivorcedWomen who gave birth in the past 12 months Now married:
100.0% (21)Unmarried:
0.0% (0)
Women who did not give birth in the past 12 months Now married:
33.6% (212)Unmarried:
66.4% (419)
Marital status - White alone, not Hispanic / Latino population 15 years and over
Males 78.0% Never married7.9% Now married0.0% Separated0.0% Widowed14.0% DivorcedFemales 60.3% Never married0.0% Now married0.0% Separated0.0% Widowed39.7% DivorcedWomen who did not give birth in the past 12 months Now married:
0.0% (0)Unmarried:
100.0% (26)
Marital status - Hispanic or Latino population 15 years and over
Males 51.2% Never married36.6% Now married1.4% Separated0.4% Widowed10.3% DivorcedFemales 42.8% Never married38.4% Now married2.8% Separated6.9% Widowed9.2% DivorcedWomen who gave birth in the past 12 months Now married:
42.1% (50)Unmarried:
57.9% (68)
Women who did not give birth in the past 12 months Now married:
33.1% (471)Unmarried:
66.9% (954)
Ancestries in Florida City
1,009 10.2% Haitian179 1.8% American31 0.3% Bahamian22 0.2% Polish10 0.1% Jamaican9 0.09% European5 0.05% British3 0.03% English
Children Nativity (place of birth) in Florida City
Children under 6 years - Living with two parents Both parents native 49 100.0% NativeBoth parents foreign-born 226 79.9% Native57 20.1% Foreign-bornOne native, one foreign-born parent 58 100.0% NativeChildren under 6 years - Living with one parent Native parent 1,063 99.8% Native2 0.2% Foreign-bornForeign-born parent 187 83.6% Native37 16.4% Foreign-bornChildren 6 to 17 years - Living with two parents Both parents native 130 100.0% NativeBoth parents foreign-born 496 87.8% Native69 12.2% Foreign-bornOne native, one foreign-born parent 83 70.2% Native35 29.8% Foreign-bornChildren 6 to 17 years - Living with one parent Native parent 888 100.0% NativeForeign-born parent 485 52.7% Native435 47.3% Foreign-born
Grandparents responsible for own grandchildren in Florida City
Grandparents (30 to 59 years) White / Caucasian 28 100.0% Not responsible for grandchildrenBlack or African American 36 34.3% Responsible for grandchildren70 65.7% Not responsible for grandchildrenOther race 44 100.0% Not responsible for grandchildrenTwo or more races 111 63.8% Responsible for grandchildren63 36.2% Not responsible for grandchildrenHispanic or Latino 59 35.2% Responsible for grandchildren108 64.8% Not responsible for grandchildrenGrandparents (60 years and over) White / Caucasian 13 100.0% Not responsible for grandchildrenBlack or African American 155 73.0% Responsible for grandchildren57 27.0% Not responsible for grandchildrenHispanic or Latino 17 100.0% Not responsible for grandchildren