Races in Faribault, Minnesota (MN) Detailed Stats
Data:
Races - White alone (%)
Races - White alone (% change since 2000)
Races - Black alone (%)
Races - Black alone (% change since 2000)
Races - American Indian alone (%)
Races - American Indian alone (% change since 2000)
Races - Asian alone (%)
Races - Asian alone (% change since 2000)
Races - Hispanic (%)
Races - Hispanic (% change since 2000)
Races - Native Hawaiian and Other Pacific Islander alone (%)
Races - Native Hawaiian and Other Pacific Islander alone (% change since 2000)
Races - Two or more races(%)
Races - Two or more races(% change since 2000)
Races - Other race alone (%)
Races - Other race alone (% change since 2000)
Racial diversity
Place of birth - Born in state of residence (%)
Place of birth - Born in state of residence (%) - White
Place of birth - Born in state of residence (%) - Black or African American
Place of birth - Born in state of residence (%) - Asian
Place of birth - Born in state of residence (%) - Hispanic or Latino
Place of birth - Born in state of residence (%) - American Indian and Alaska Native
Place of birth - Born in state of residence (%) - Multirace
Place of birth - Born in state of residence (%) - Other Race
Place of birth - Born in other state (%)
Place of birth - Born in other state (%) - White
Place of birth - Born in other state (%) - Black or African American
Place of birth - Born in other state (%) - Asian
Place of birth - Born in other state (%) - Hispanic or Latino
Place of birth - Born in other state (%) - American Indian and Alaska Native
Place of birth - Born in other state (%) - Multirace
Place of birth - Born in other state (%) - Other Race
Place of birth - Native, outside of US (%)
Place of birth - Native, outside of US (%) - White
Place of birth - Native, outside of US (%) - Black or African American
Place of birth - Native, outside of US (%) - Asian
Place of birth - Native, outside of US (%) - Hispanic or Latino
Place of birth - Native, outside of US (%) - American Indian and Alaska Native
Place of birth - Native, outside of US (%) - Multirace
Place of birth - Native, outside of US (%) - Other Race
Place of birth - Foreign born (%)
Place of birth - Foreign born (%) - White
Place of birth - Foreign born (%) - Black or African American
Place of birth - Foreign born (%) - Asian
Place of birth - Foreign born (%) - Hispanic or Latino
Place of birth - Foreign born (%) - American Indian and Alaska Native
Place of birth - Foreign born (%) - Multirace
Place of birth - Foreign born (%) - Other Race
Residents speaking English at home (%)
Residents speaking English at home - Born in the United States (%)
Residents speaking English at home - Native, born elsewhere (%)
Residents speaking English at home - Foreign born (%)
Residents speaking Spanish at home (%)
Residents speaking Spanish at home - Born in the United States (%)
Residents speaking Spanish at home - Native, born elsewhere (%)
Residents speaking Spanish at home - Foreign born (%)
Residents speaking other language at home (%)
Residents speaking other language at home - Born in the United States (%)
Residents speaking other language at home - Native, born elsewhere (%)
Residents speaking other language at home - Foreign born (%)
Marital status - Never married (%)
Marital status - Now married (%)
Marital status - Separated (%)
Marital status - Widowed (%)
Marital status - Divorced (%)
Ancestries Reported - Arab (%)
Ancestries Reported - Czech (%)
Ancestries Reported - Danish (%)
Ancestries Reported - Dutch (%)
Ancestries Reported - English (%)
Ancestries Reported - French (%)
Ancestries Reported - French Canadian (%)
Ancestries Reported - German (%)
Ancestries Reported - Greek (%)
Ancestries Reported - Hungarian (%)
Ancestries Reported - Irish (%)
Ancestries Reported - Italian (%)
Ancestries Reported - Lithuanian (%)
Ancestries Reported - Norwegian (%)
Ancestries Reported - Polish (%)
Ancestries Reported - Portuguese (%)
Ancestries Reported - Russian (%)
Ancestries Reported - Scotch-Irish (%)
Ancestries Reported - Scottish (%)
Ancestries Reported - Slovak (%)
Ancestries Reported - Subsaharan African (%)
Ancestries Reported - Swedish (%)
Ancestries Reported - Swiss (%)
Ancestries Reported - Ukrainian (%)
Ancestries Reported - United States (%)
Ancestries Reported - Welsh (%)
Ancestries Reported - West Indian (%)
Ancestries Reported - Other (%)
Geographical mobility - Same house 1 year ago (%)
Geographical mobility - Same house 1 year ago (%) - White
Geographical mobility - Same house 1 year ago (%) - Black or African American
Geographical mobility - Same house 1 year ago (%) - Asian
Geographical mobility - Same house 1 year ago (%) - Hispanic or Latino
Geographical mobility - Same house 1 year ago (%) - American Indian and Alaska Native
Geographical mobility - Same house 1 year ago (%) - Multirace
Geographical mobility - Same house 1 year ago (%) - Other Race
Geographical mobility - Moved within same county (%)
Geographical mobility - Moved within same county (%) - White
Geographical mobility - Moved within same county (%) - Black or African American
Geographical mobility - Moved within same county (%) - Asian
Geographical mobility - Moved within same county (%) - Hispanic or Latino
Geographical mobility - Moved within same county (%) - American Indian and Alaska Native
Geographical mobility - Moved within same county (%) - Multirace
Geographical mobility - Moved within same county (%) - Other Race
Geographical mobility - Moved from different county within same state (%)
Geographical mobility - Moved from different county within same state (%) - White
Geographical mobility - Moved from different county within same state (%) - Black or African American
Geographical mobility - Moved from different county within same state (%) - Asian
Geographical mobility - Moved from different county within same state (%) - Hispanic or Latino
Geographical mobility - Moved from different county within same state (%) - American Indian and Alaska Native
Geographical mobility - Moved from different county within same state (%) - Multirace
Geographical mobility - Moved from different county within same state (%) - Other Race
Geographical mobility - Moved from different state (%)
Geographical mobility - Moved from different state (%) - White
Geographical mobility - Moved from different state (%) - Black or African American
Geographical mobility - Moved from different state (%) - Asian
Geographical mobility - Moved from different state (%) - Hispanic or Latino
Geographical mobility - Moved from different state (%) - American Indian and Alaska Native
Geographical mobility - Moved from different state (%) - Multirace
Geographical mobility - Moved from different state (%) - Other Race
Geographical mobility - Moved from abroad (%)
Geographical mobility - Moved from abroad (%) - White
Geographical mobility - Moved from abroad (%) - Black or African American
Geographical mobility - Moved from abroad (%) - Asian
Geographical mobility - Moved from abroad (%) - Hispanic or Latino
Geographical mobility - Moved from abroad (%) - American Indian and Alaska Native
Geographical mobility - Moved from abroad (%) - Multirace
Geographical mobility - Moved from abroad (%) - Other Race
Place of birth for the foreign-born population - Ireland (%)
Place of birth for the foreign-born population - Denmark (%)
Place of birth for the foreign-born population - Norway (%)
Place of birth for the foreign-born population - Sweden (%)
Place of birth for the foreign-born population - United Kingdom (%)
Place of birth for the foreign-born population - England (%)
Place of birth for the foreign-born population - Scotland (%)
Place of birth for the foreign-born population - Other Northern Europe (%)
Place of birth for the foreign-born population - Austria (%)
Place of birth for the foreign-born population - Belgium (%)
Place of birth for the foreign-born population - France (%)
Place of birth for the foreign-born population - Germany (%)
Place of birth for the foreign-born population - Netherlands (%)
Place of birth for the foreign-born population - Switzerland (%)
Place of birth for the foreign-born population - Other Western Europe (%)
Place of birth for the foreign-born population - Greece (%)
Place of birth for the foreign-born population - Italy (%)
Place of birth for the foreign-born population - Portugal (%)
Place of birth for the foreign-born population - Spain (%)
Place of birth for the foreign-born population - Other Southern Europe (%)
Place of birth for the foreign-born population - Albania (%)
Place of birth for the foreign-born population - Belarus (%)
Place of birth for the foreign-born population - Bosnia and Herzegovina (%)
Place of birth for the foreign-born population - Bulgaria (%)
Place of birth for the foreign-born population - Croatia (%)
Place of birth for the foreign-born population - Czechoslovakia (%)
Place of birth for the foreign-born population - Hungary (%)
Place of birth for the foreign-born population - Latvia (%)
Place of birth for the foreign-born population - Lithuania (%)
Place of birth for the foreign-born population - North Macedonia (Macedonia) (%)
Place of birth for the foreign-born population - Moldova (%)
Place of birth for the foreign-born population - Poland (%)
Place of birth for the foreign-born population - Romania (%)
Place of birth for the foreign-born population - Russia (%)
Place of birth for the foreign-born population - Serbia (%)
Place of birth for the foreign-born population - Ukraine (%)
Place of birth for the foreign-born population - Other Eastern Europe (%)
Place of birth for the foreign-born population - China (%)
Place of birth for the foreign-born population - Hong Kong (%)
Place of birth for the foreign-born population - Taiwan (%)
Place of birth for the foreign-born population - Japan (%)
Place of birth for the foreign-born population - Korea (%)
Place of birth for the foreign-born population - Other Eastern Asia (%)
Place of birth for the foreign-born population - Afghanistan (%)
Place of birth for the foreign-born population - Bangladesh (%)
Place of birth for the foreign-born population - India (%)
Place of birth for the foreign-born population - Iran (%)
Place of birth for the foreign-born population - Kazakhstan (%)
Place of birth for the foreign-born population - Nepal (%)
Place of birth for the foreign-born population - Pakistan (%)
Place of birth for the foreign-born population - Sri Lanka (%)
Place of birth for the foreign-born population - Uzbekistan (%)
Place of birth for the foreign-born population - Other South Central Asia (%)
Place of birth for the foreign-born population - Burma (%)
Place of birth for the foreign-born population - Cambodia (%)
Place of birth for the foreign-born population - Indonesia (%)
Place of birth for the foreign-born population - Laos (%)
Place of birth for the foreign-born population - Malaysia (%)
Place of birth for the foreign-born population - Philippines (%)
Place of birth for the foreign-born population - Singapore (%)
Place of birth for the foreign-born population - Thailand (%)
Place of birth for the foreign-born population - Vietnam (%)
Place of birth for the foreign-born population - Other South Eastern Asia (%)
Place of birth for the foreign-born population - Armenia (%)
Place of birth for the foreign-born population - Iraq (%)
Place of birth for the foreign-born population - Israel (%)
Place of birth for the foreign-born population - Jordan (%)
Place of birth for the foreign-born population - Kuwait (%)
Place of birth for the foreign-born population - Lebanon (%)
Place of birth for the foreign-born population - Saudi Arabia (%)
Place of birth for the foreign-born population - Syria (%)
Place of birth for the foreign-born population - Turkey (%)
Place of birth for the foreign-born population - Yemen (%)
Place of birth for the foreign-born population - Other Western Asia (%)
Place of birth for the foreign-born population - Eritrea (%)
Place of birth for the foreign-born population - Ethiopia (%)
Place of birth for the foreign-born population - Kenya (%)
Place of birth for the foreign-born population - Somalia (%)
Place of birth for the foreign-born population - Uganda (%)
Place of birth for the foreign-born population - Zimbabwe (%)
Place of birth for the foreign-born population - Other Eastern Africa (%)
Place of birth for the foreign-born population - Cameroon (%)
Place of birth for the foreign-born population - Congo (%)
Place of birth for the foreign-born population - Democratic Republic of Congo (Zaire) (%)
Place of birth for the foreign-born population - Other Middle Africa (%)
Place of birth for the foreign-born population - Egypt (%)
Place of birth for the foreign-born population - Morocco (%)
Place of birth for the foreign-born population - Sudan (%)
Place of birth for the foreign-born population - Other Northern Africa (%)
Place of birth for the foreign-born population - South Africa (%)
Place of birth for the foreign-born population - Other Southern Africa (%)
Place of birth for the foreign-born population - Cabo Verde (%)
Place of birth for the foreign-born population - Ghana (%)
Place of birth for the foreign-born population - Liberia (%)
Place of birth for the foreign-born population - Nigeria (%)
Place of birth for the foreign-born population - Senegal (%)
Place of birth for the foreign-born population - Sierra Leone (%)
Place of birth for the foreign-born population - Other Western Africa (%)
Place of birth for the foreign-born population - Australia (%)
Place of birth for the foreign-born population - New Zealand (%)
Place of birth for the foreign-born population - Fiji (%)
Place of birth for the foreign-born population - Micronesia (%)
Place of birth for the foreign-born population - Bahamas (%)
Place of birth for the foreign-born population - Barbados (%)
Place of birth for the foreign-born population - Cuba (%)
Place of birth for the foreign-born population - Dominica (%)
Place of birth for the foreign-born population - Dominican Republic (%)
Place of birth for the foreign-born population - Grenada (%)
Place of birth for the foreign-born population - Haiti (%)
Place of birth for the foreign-born population - Jamaica (%)
Place of birth for the foreign-born population - St. Vincent and the Grenadines (%)
Place of birth for the foreign-born population - Trinidad and Tobago (%)
Place of birth for the foreign-born population - West Indies (%)
Place of birth for the foreign-born population - Other Caribbean (%)
Place of birth for the foreign-born population - Belize (%)
Place of birth for the foreign-born population - Costa Rica (%)
Place of birth for the foreign-born population - El Salvador (%)
Place of birth for the foreign-born population - Guatemala (%)
Place of birth for the foreign-born population - Honduras (%)
Place of birth for the foreign-born population - Mexico (%)
Place of birth for the foreign-born population - Nicaragua (%)
Place of birth for the foreign-born population - Panama (%)
Place of birth for the foreign-born population - Other Central America (%)
Place of birth for the foreign-born population - Argentina (%)
Place of birth for the foreign-born population - Bolivia (%)
Place of birth for the foreign-born population - Brazil (%)
Place of birth for the foreign-born population - Chile (%)
Place of birth for the foreign-born population - Colombia (%)
Place of birth for the foreign-born population - Ecuador (%)
Place of birth for the foreign-born population - Guyana (%)
Place of birth for the foreign-born population - Peru (%)
Place of birth for the foreign-born population - Uruguay (%)
Place of birth for the foreign-born population - Venezuela (%)
Place of birth for the foreign-born population - Other South America (%)
Place of birth for the foreign-born population - Canada (%)
Place of birth for the foreign-born population - Other Northern America (%)
Place of birth for the foreign-born population - Other (%)
Latest news about races in Faribault, MN collected exclusively by city-data.com from local newspapers, TV, and radio stations
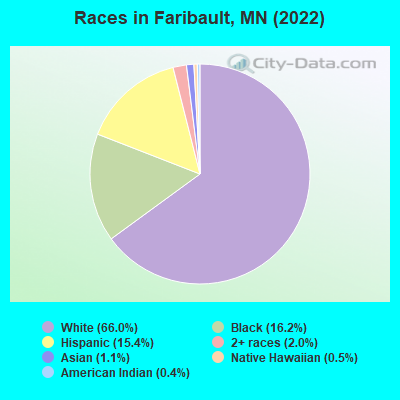
According to 2022 data, the most numerous races in Faribault, MN are White alone (16,244 residents), Black alone (3,993 residents), and Hispanic (3,780 residents). 79.0% of Faribault residents speak English at home. 15.3% of Faribault, MN residents are foreign-born (8.9% born in Africa, 4.9% born in Latin America), which is 47.8% greater than the foreign-born rate of 8.0% across the entire state of Minnesota.
Race distribution in Faribault
2000 2022
4,337,143 88.2% White alone 168,813 3.4% Black alone 143,382 2.9% Hispanic 141,083 2.9% Asian alone 70,304 1.4% Two or more races 52,009 1.1% American Indian alone 5,031 0.1% Other race alone 1,714 0.03% Native Hawaiian and Other
4,356,347 76.2% White alone 395,179 6.9% Black alone 333,830 5.8% Hispanic 294,800 5.2% Asian alone 259,649 4.5% Two or more races 42,125 0.7% American Indian alone 32,976 0.6% Other race alone 2,278 0.04% Native Hawaiian and Other
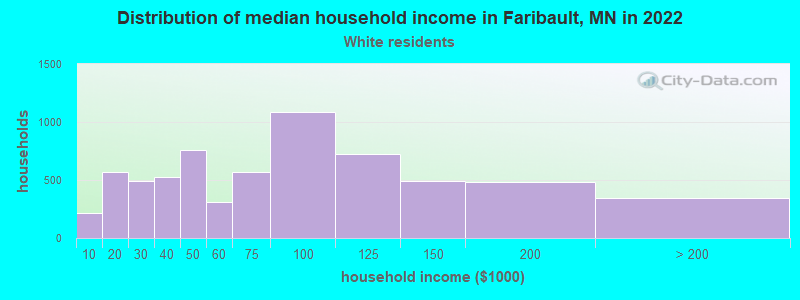
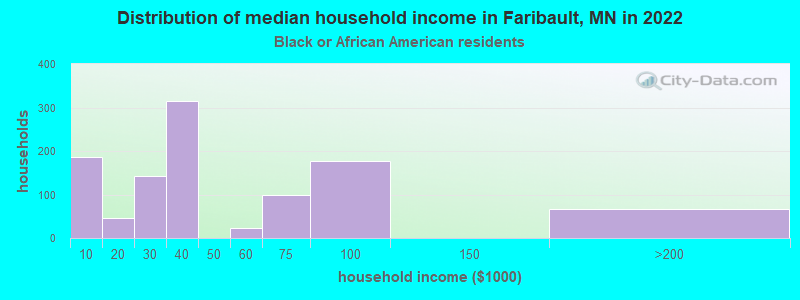
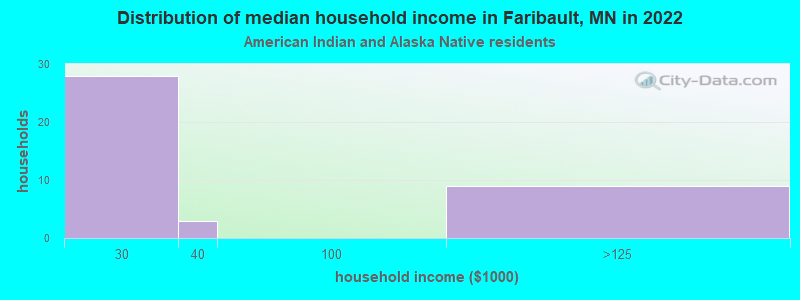
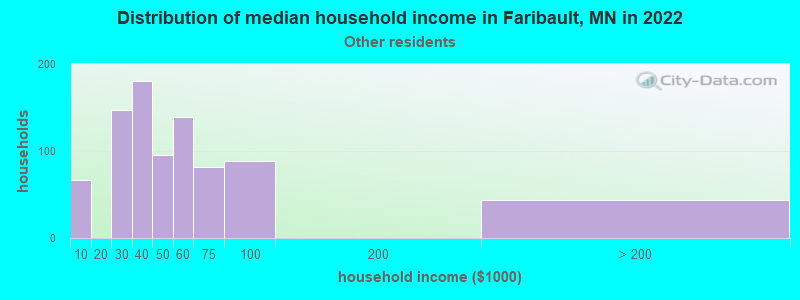
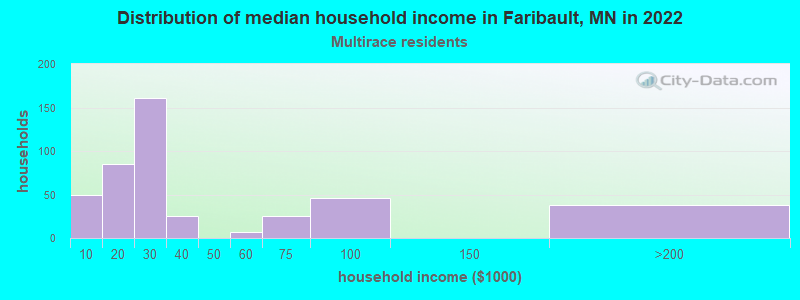
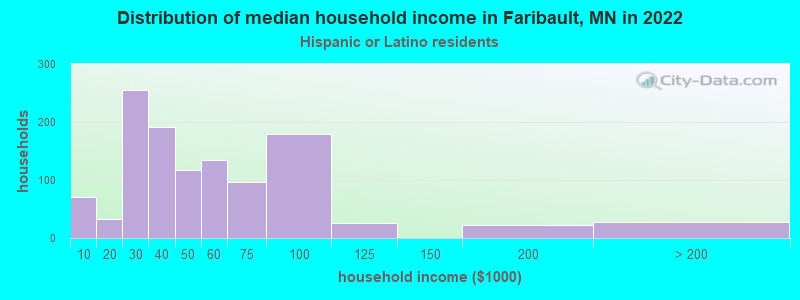
Income and house value in Faribault Median household income in 2022 $66,517 White non-Hispanic householders$25,890 Black householders$23,780 Some other race householders$22,513 Two or more races householders$45,727 Hispanic or Latino race householdersMedian 2022 house value $245,119 White Non-Hispanic householders$317,662 Black or African American householders$127,064 American Indian or Alaska Native householders $245,581 Asian householders$292,480 Some other race householders$183,666 Two or more races householders$215,548 Hispanic or Latino householders
Median age by race in Faribault
46.8 Median age for White residents44.2 50.2 28.6 Median age for Black or African American residents34.5 25.1 32.8 Median age for American Indian / Alaska Native residents33.0 14.8 21.3 Median age for Asian residents24.2 20.4 63.3 Median age for Native Hawaiian / Pacific Islander residents35.6 -534,959,349.1 30.6 Median age for Other race residents16.9 32.7 26.8 Median age for Two or more races residents26.6 27.7 48.0 Median age for White alone residents45.0 51.1 34.1 Median age for Hispanic or Latino residents30.8 32.4
Owner/renter occupied households by race in Faribault
House owners and renters - White residents 4,923 75.3% Owner occupied1,613 24.7% Renter occupiedHouse owners and renters - Black or African American residents 143 13.8% Owner occupied897 86.2% Renter occupiedHouse owners and renters - American Indian / Alaska Native residents 36 100.0% Owner occupiedHouse owners and renters - Asian residents 13 100.0% Owner occupiedHouse owners and renters - Other race residents 234 33.5% Owner occupied465 66.5% Renter occupiedHouse owners and renters - Two or more races residents 295 54.2% Owner occupied249 45.8% Renter occupiedHouse owners and renters - White alone residents 4,832 75.3% Owner occupied1,585 24.7% Renter occupiedHouse owners and renters - Hispanic or Latino residents 664 46.9% Owner occupied751 53.1% Renter occupied
Language usage in Faribault
English speakers - Total 79.0% of residents of Faribault speak English at home.
8.4% of residents speak Spanish at home 1,094 55.9% Speak English very well863 44.1% Speak English less than very well11.8% of residents speak other language at home 1,025 37.4% Speak English very well1,719 62.6% Speak English less than very well
English speakers - Born in the United States 85.5% of residents of Faribault speak English at home.
11.0% of residents speak Spanish at home 262 58.7% Speak English very well184 41.3% Speak English less than very well1.5% of residents speak other language at home 51 85.0% Speak English very well9 15.0% Speak English less than very well
English speakers - Native, born elsewhere 77.8% of residents of Faribault speak English at home.
53.2% of residents speak Spanish at home 72 85.7% Speak English very well12 14.3% Speak English less than very well
English speakers - Foreign-born 9.1% of residents of Faribault speak English at home.
17.5% of residents speak Spanish at home 196 28.5% Speak English very well492 71.5% Speak English less than very well58.6% of residents speak other language at home 754 32.8% Speak English very well1,543 67.2% Speak English less than very well
White (Caucasian) - Speak only English Native:
96.3% (15,643)Foreign-born:
27.8% (39)
White (Caucasian) - Speak another language Native:
3.3% (535)Foreign-born:
69.6% (97)
Black or African American - Speak only English Native:
81.7% (866)Foreign-born:
6.3% (146)
Black or African American - Speak another language Native:
18.7% (198)Foreign-born:
95.1% (2,200)
American Indian / Alaska Native - Speak only English Native:
71.5% (131)Foreign-born:
37.9% (22)
American Indian / Alaska Native - Speak another language Native:
28.2% (52)Foreign-born:
47.9% (28)
Asian - Speak only English Native:
94.8% (71)Foreign-born:
28.3% (52)
Asian - Speak another language Native:
10.8% (8)Foreign-born:
71.6% (132)
Native Hawaiian / Pacific Islander - Speak only English Native:
100.0% (41)Foreign-born:
49.4% (6)
Other race - Speak only English Native:
20.0% (191)Foreign-born:
2.7% (28)
Other race - Speak another language Native:
75.9% (723)Foreign-born:
95.3% (964)
Two or more races - Speak only English Native:
57.3% (675)Foreign-born:
14.6% (53)
Two or more races - Speak another language Native:
45.6% (536)Foreign-born:
44.9% (162)
White alone - Speak only English Native:
98.2% (15,399)Foreign-born:
30.9% (22)
White alone - Speak another language Native:
1.8% (275)Foreign-born:
68.6% (50)
Hispanic or Latino - Speak only English Native:
44.2% (1,039)Foreign-born:
12.1% (140)
Hispanic or Latino - Speak another language Native:
47.5% (1,115)Foreign-born:
59.6% (692)
Foreign-born residents in Faribault 3,769 residents are foreign born (8.9% Africa , 4.9% Latin America ).
This city:
15.3%Minnesota:
8.5%
Marital status for residents in Faribault Marital status - White (Caucasian) population 15 years and over
Males 38.3% Never married41.2% Now married2.5% Separated4.9% Widowed13.1% DivorcedFemales 26.7% Never married41.9% Now married1.5% Separated13.0% Widowed17.0% DivorcedWomen who gave birth in the past 12 months Now married:
11.1% (31)Unmarried:
88.9% (249)
Women who did not give birth in the past 12 months Now married:
39.2% (1,107)Unmarried:
60.8% (1,717)
Marital status - Black or African American population 15 years and over
Males 58.4% Never married31.5% Now married1.5% Separated0.4% Widowed8.1% DivorcedFemales 45.8% Never married49.8% Now married2.8% Separated0.0% Widowed1.5% DivorcedWomen who gave birth in the past 12 months Now married:
100.0% (222)Unmarried:
0.0% (0)
Women who did not give birth in the past 12 months Now married:
38.5% (177)Unmarried:
61.5% (284)
Marital status - American Indian / Alaska Native population 15 years and over
Males 86.6% Never married13.4% Now married0.0% Separated0.0% Widowed0.0% DivorcedFemales 0.0% Never married14.6% Now married52.1% Separated0.0% Widowed33.3% DivorcedWomen who did not give birth in the past 12 months Now married:
66.7% (33)Unmarried:
33.3% (17)
Marital status - Asian population 15 years and over
Males 93.3% Never married6.7% Now married0.0% Separated0.0% Widowed0.0% DivorcedFemales 54.5% Never married28.5% Now married0.0% Separated17.0% Widowed0.0% DivorcedWomen who did not give birth in the past 12 months Now married:
9.2% (12)Unmarried:
90.8% (122)
Marital status - Native Hawaiian / Pacific Islander population 15 years and over
Males 66.7% Never married33.3% Now married0.0% Separated0.0% Widowed0.0% DivorcedFemales 0.0% Never married100.0% Now married0.0% Separated0.0% Widowed0.0% DivorcedMarital status - Other race population 15 years and over
Males 54.6% Never married45.4% Now married0.0% Separated0.0% Widowed0.0% DivorcedFemales 27.5% Never married68.5% Now married4.0% Separated0.0% Widowed0.0% DivorcedWomen who gave birth in the past 12 months Now married:
100.0% (24)Unmarried:
0.0% (0)
Women who did not give birth in the past 12 months Now married:
59.8% (268)Unmarried:
40.2% (181)
Marital status - Two or more races population 15 years and over
Males 53.7% Never married31.9% Now married2.2% Separated0.0% Widowed12.2% DivorcedFemales 36.2% Never married45.9% Now married6.9% Separated0.0% Widowed10.9% DivorcedWomen who gave birth in the past 12 months Now married:
100.0% (13)Unmarried:
0.0% (0)
Women who did not give birth in the past 12 months Now married:
51.7% (161)Unmarried:
48.3% (151)
Marital status - White alone, not Hispanic / Latino population 15 years and over
Males 37.4% Never married41.4% Now married2.6% Separated5.1% Widowed13.5% DivorcedFemales 25.5% Never married42.2% Now married1.1% Separated13.5% Widowed17.7% DivorcedWomen who gave birth in the past 12 months Now married:
11.9% (32)Unmarried:
88.1% (235)
Women who did not give birth in the past 12 months Now married:
39.9% (1,064)Unmarried:
60.1% (1,600)
Marital status - Hispanic or Latino population 15 years and over
Males 56.7% Never married42.9% Now married0.0% Separated0.0% Widowed0.4% DivorcedFemales 34.2% Never married54.1% Now married8.4% Separated0.0% Widowed3.3% DivorcedWomen who gave birth in the past 12 months Now married:
58.3% (37)Unmarried:
41.7% (26)
Women who did not give birth in the past 12 months Now married:
52.3% (544)Unmarried:
47.7% (496)
Ancestries in Faribault
2,411 17.8% Somali2,386 17.7% German970 7.2% American826 6.1% Norwegian498 3.7% English352 2.6% Irish291 2.2% Czech256 1.9% European182 1.3% French Canadian135 1.0% French129 1.0% Sudanese113 0.8% Polish111 0.8% Scandinavian86 0.6% Eastern European81 0.6% Ethiopian62 0.5% Scotch-Irish58 0.4% Swedish51 0.4% Czechoslovakian30 0.2% Greek27 0.2% Ukrainian26 0.2% African22 0.2% Nigerian19 0.1% Scottish19 0.1% Italian19 0.1% Northern European17 0.1% Russian17 0.1% Slovene15 0.1% Dutch15 0.1% Finnish12 0.09% Slovak11 0.08% Liberian10 0.07% Danish9 0.07% Egyptian6 0.04% Kenyan1 0.01% Moroccan
Geographical mobility in Faribault Same house 1 year ago 14,665 87.8% White (Caucasian)3,105 84.1% Black or African American196 86.3% American Indian / Alaska Native354 99.0% Asian6 12.4% Native Hawaiian / Pacific Islander1,739 88.3% Other race1,403 85.4% Two or more races14,103 87.8% White alone, not Hispanic / Latino3,086 86.6% Hispanic or LatinoMoved within same county 787 4.7% White / Caucasian21 0.6% Black or African American1 0.4% American Indian / Alaska Native150 7.6% Other race171 10.4% Two or more races721 4.5% White alone, not Hispanic / Latino362 10.2% Hispanic or LatinoMoved within same state 1,030 6.2% White / Caucasian285 7.7% Black or African American36 15.9% American Indian / Alaska Native7 2.0% Asian48 92.0% Native Hawaiian / Pacific Islander38 2.3% Two or more races1,019 6.3% White alone, not Hispanic / Latino19 0.5% Hispanic or LatinoMoved from different state 119 0.7% White / Caucasian351 9.5% Black or African American18 1.1% Two or more races122 0.8% White alone, not Hispanic / LatinoMoved from abroad 20 0.1% White96 4.9% Other race20 0.1% White alone, not Hispanic / Latino97 2.7% Hispanic or Latino
Children Nativity (place of birth) in Faribault
Children under 6 years - Living with two parents Both parents native 267 98.8% Native3 1.2% Foreign-bornBoth parents foreign-born 354 83.6% Native69 16.4% Foreign-bornOne native, one foreign-born parent 172 100.0% NativeChildren under 6 years - Living with one parent Native parent 443 100.0% NativeForeign-born parent 222 73.7% Native79 26.3% Foreign-bornChildren 6 to 17 years - Living with two parents Both parents native 1,414 97.0% Native44 3.0% Foreign-bornBoth parents foreign-born 291 45.1% Native355 54.9% Foreign-bornOne native, one foreign-born parent 227 100.0% NativeChildren 6 to 17 years - Living with one parent Native parent 875 100.0% NativeForeign-born parent 382 60.9% Native245 39.1% Foreign-born
Grandparents responsible for own grandchildren in Faribault
Grandparents (30 to 59 years) White / Caucasian 42 46.7% Responsible for grandchildren48 53.3% Not responsible for grandchildrenAsian 28 100.0% Not responsible for grandchildrenWhite alone, not Hispanic / Latino 44 46.8% Responsible for grandchildren49 53.2% Not responsible for grandchildren
Grandparents (60 years and over) White / Caucasian 69 100.0% Responsible for grandchildrenWhite alone, not Hispanic / Latino 71 100.0% Responsible for grandchildren