Races in Fallon, Nevada (NV) Detailed Stats Ancestries, Foreign-born residents, place of birth
Data:
Races - White alone (%)
Races - White alone (% change since 2000)
Races - Black alone (%)
Races - Black alone (% change since 2000)
Races - American Indian alone (%)
Races - American Indian alone (% change since 2000)
Races - Asian alone (%)
Races - Asian alone (% change since 2000)
Races - Hispanic (%)
Races - Hispanic (% change since 2000)
Races - Native Hawaiian and Other Pacific Islander alone (%)
Races - Native Hawaiian and Other Pacific Islander alone (% change since 2000)
Races - Two or more races(%)
Races - Two or more races(% change since 2000)
Races - Other race alone (%)
Races - Other race alone (% change since 2000)
Racial diversity
Place of birth - Born in state of residence (%)
Place of birth - Born in state of residence (%) - White
Place of birth - Born in state of residence (%) - Black or African American
Place of birth - Born in state of residence (%) - Asian
Place of birth - Born in state of residence (%) - Hispanic or Latino
Place of birth - Born in state of residence (%) - American Indian and Alaska Native
Place of birth - Born in state of residence (%) - Multirace
Place of birth - Born in state of residence (%) - Other Race
Place of birth - Born in other state (%)
Place of birth - Born in other state (%) - White
Place of birth - Born in other state (%) - Black or African American
Place of birth - Born in other state (%) - Asian
Place of birth - Born in other state (%) - Hispanic or Latino
Place of birth - Born in other state (%) - American Indian and Alaska Native
Place of birth - Born in other state (%) - Multirace
Place of birth - Born in other state (%) - Other Race
Place of birth - Native, outside of US (%)
Place of birth - Native, outside of US (%) - White
Place of birth - Native, outside of US (%) - Black or African American
Place of birth - Native, outside of US (%) - Asian
Place of birth - Native, outside of US (%) - Hispanic or Latino
Place of birth - Native, outside of US (%) - American Indian and Alaska Native
Place of birth - Native, outside of US (%) - Multirace
Place of birth - Native, outside of US (%) - Other Race
Place of birth - Foreign born (%)
Place of birth - Foreign born (%) - White
Place of birth - Foreign born (%) - Black or African American
Place of birth - Foreign born (%) - Asian
Place of birth - Foreign born (%) - Hispanic or Latino
Place of birth - Foreign born (%) - American Indian and Alaska Native
Place of birth - Foreign born (%) - Multirace
Place of birth - Foreign born (%) - Other Race
Residents speaking English at home (%)
Residents speaking English at home - Born in the United States (%)
Residents speaking English at home - Native, born elsewhere (%)
Residents speaking English at home - Foreign born (%)
Residents speaking Spanish at home (%)
Residents speaking Spanish at home - Born in the United States (%)
Residents speaking Spanish at home - Native, born elsewhere (%)
Residents speaking Spanish at home - Foreign born (%)
Residents speaking other language at home (%)
Residents speaking other language at home - Born in the United States (%)
Residents speaking other language at home - Native, born elsewhere (%)
Residents speaking other language at home - Foreign born (%)
Marital status - Never married (%)
Marital status - Now married (%)
Marital status - Separated (%)
Marital status - Widowed (%)
Marital status - Divorced (%)
Ancestries Reported - Arab (%)
Ancestries Reported - Czech (%)
Ancestries Reported - Danish (%)
Ancestries Reported - Dutch (%)
Ancestries Reported - English (%)
Ancestries Reported - French (%)
Ancestries Reported - French Canadian (%)
Ancestries Reported - German (%)
Ancestries Reported - Greek (%)
Ancestries Reported - Hungarian (%)
Ancestries Reported - Irish (%)
Ancestries Reported - Italian (%)
Ancestries Reported - Lithuanian (%)
Ancestries Reported - Norwegian (%)
Ancestries Reported - Polish (%)
Ancestries Reported - Portuguese (%)
Ancestries Reported - Russian (%)
Ancestries Reported - Scotch-Irish (%)
Ancestries Reported - Scottish (%)
Ancestries Reported - Slovak (%)
Ancestries Reported - Subsaharan African (%)
Ancestries Reported - Swedish (%)
Ancestries Reported - Swiss (%)
Ancestries Reported - Ukrainian (%)
Ancestries Reported - United States (%)
Ancestries Reported - Welsh (%)
Ancestries Reported - West Indian (%)
Ancestries Reported - Other (%)
Geographical mobility - Same house 1 year ago (%)
Geographical mobility - Same house 1 year ago (%) - White
Geographical mobility - Same house 1 year ago (%) - Black or African American
Geographical mobility - Same house 1 year ago (%) - Asian
Geographical mobility - Same house 1 year ago (%) - Hispanic or Latino
Geographical mobility - Same house 1 year ago (%) - American Indian and Alaska Native
Geographical mobility - Same house 1 year ago (%) - Multirace
Geographical mobility - Same house 1 year ago (%) - Other Race
Geographical mobility - Moved within same county (%)
Geographical mobility - Moved within same county (%) - White
Geographical mobility - Moved within same county (%) - Black or African American
Geographical mobility - Moved within same county (%) - Asian
Geographical mobility - Moved within same county (%) - Hispanic or Latino
Geographical mobility - Moved within same county (%) - American Indian and Alaska Native
Geographical mobility - Moved within same county (%) - Multirace
Geographical mobility - Moved within same county (%) - Other Race
Geographical mobility - Moved from different county within same state (%)
Geographical mobility - Moved from different county within same state (%) - White
Geographical mobility - Moved from different county within same state (%) - Black or African American
Geographical mobility - Moved from different county within same state (%) - Asian
Geographical mobility - Moved from different county within same state (%) - Hispanic or Latino
Geographical mobility - Moved from different county within same state (%) - American Indian and Alaska Native
Geographical mobility - Moved from different county within same state (%) - Multirace
Geographical mobility - Moved from different county within same state (%) - Other Race
Geographical mobility - Moved from different state (%)
Geographical mobility - Moved from different state (%) - White
Geographical mobility - Moved from different state (%) - Black or African American
Geographical mobility - Moved from different state (%) - Asian
Geographical mobility - Moved from different state (%) - Hispanic or Latino
Geographical mobility - Moved from different state (%) - American Indian and Alaska Native
Geographical mobility - Moved from different state (%) - Multirace
Geographical mobility - Moved from different state (%) - Other Race
Geographical mobility - Moved from abroad (%)
Geographical mobility - Moved from abroad (%) - White
Geographical mobility - Moved from abroad (%) - Black or African American
Geographical mobility - Moved from abroad (%) - Asian
Geographical mobility - Moved from abroad (%) - Hispanic or Latino
Geographical mobility - Moved from abroad (%) - American Indian and Alaska Native
Geographical mobility - Moved from abroad (%) - Multirace
Geographical mobility - Moved from abroad (%) - Other Race
Place of birth for the foreign-born population - Ireland (%)
Place of birth for the foreign-born population - Denmark (%)
Place of birth for the foreign-born population - Norway (%)
Place of birth for the foreign-born population - Sweden (%)
Place of birth for the foreign-born population - United Kingdom (%)
Place of birth for the foreign-born population - England (%)
Place of birth for the foreign-born population - Scotland (%)
Place of birth for the foreign-born population - Other Northern Europe (%)
Place of birth for the foreign-born population - Austria (%)
Place of birth for the foreign-born population - Belgium (%)
Place of birth for the foreign-born population - France (%)
Place of birth for the foreign-born population - Germany (%)
Place of birth for the foreign-born population - Netherlands (%)
Place of birth for the foreign-born population - Switzerland (%)
Place of birth for the foreign-born population - Other Western Europe (%)
Place of birth for the foreign-born population - Greece (%)
Place of birth for the foreign-born population - Italy (%)
Place of birth for the foreign-born population - Portugal (%)
Place of birth for the foreign-born population - Spain (%)
Place of birth for the foreign-born population - Other Southern Europe (%)
Place of birth for the foreign-born population - Albania (%)
Place of birth for the foreign-born population - Belarus (%)
Place of birth for the foreign-born population - Bosnia and Herzegovina (%)
Place of birth for the foreign-born population - Bulgaria (%)
Place of birth for the foreign-born population - Croatia (%)
Place of birth for the foreign-born population - Czechoslovakia (%)
Place of birth for the foreign-born population - Hungary (%)
Place of birth for the foreign-born population - Latvia (%)
Place of birth for the foreign-born population - Lithuania (%)
Place of birth for the foreign-born population - North Macedonia (Macedonia) (%)
Place of birth for the foreign-born population - Moldova (%)
Place of birth for the foreign-born population - Poland (%)
Place of birth for the foreign-born population - Romania (%)
Place of birth for the foreign-born population - Russia (%)
Place of birth for the foreign-born population - Serbia (%)
Place of birth for the foreign-born population - Ukraine (%)
Place of birth for the foreign-born population - Other Eastern Europe (%)
Place of birth for the foreign-born population - China (%)
Place of birth for the foreign-born population - Hong Kong (%)
Place of birth for the foreign-born population - Taiwan (%)
Place of birth for the foreign-born population - Japan (%)
Place of birth for the foreign-born population - Korea (%)
Place of birth for the foreign-born population - Other Eastern Asia (%)
Place of birth for the foreign-born population - Afghanistan (%)
Place of birth for the foreign-born population - Bangladesh (%)
Place of birth for the foreign-born population - India (%)
Place of birth for the foreign-born population - Iran (%)
Place of birth for the foreign-born population - Kazakhstan (%)
Place of birth for the foreign-born population - Nepal (%)
Place of birth for the foreign-born population - Pakistan (%)
Place of birth for the foreign-born population - Sri Lanka (%)
Place of birth for the foreign-born population - Uzbekistan (%)
Place of birth for the foreign-born population - Other South Central Asia (%)
Place of birth for the foreign-born population - Burma (%)
Place of birth for the foreign-born population - Cambodia (%)
Place of birth for the foreign-born population - Indonesia (%)
Place of birth for the foreign-born population - Laos (%)
Place of birth for the foreign-born population - Malaysia (%)
Place of birth for the foreign-born population - Philippines (%)
Place of birth for the foreign-born population - Singapore (%)
Place of birth for the foreign-born population - Thailand (%)
Place of birth for the foreign-born population - Vietnam (%)
Place of birth for the foreign-born population - Other South Eastern Asia (%)
Place of birth for the foreign-born population - Armenia (%)
Place of birth for the foreign-born population - Iraq (%)
Place of birth for the foreign-born population - Israel (%)
Place of birth for the foreign-born population - Jordan (%)
Place of birth for the foreign-born population - Kuwait (%)
Place of birth for the foreign-born population - Lebanon (%)
Place of birth for the foreign-born population - Saudi Arabia (%)
Place of birth for the foreign-born population - Syria (%)
Place of birth for the foreign-born population - Turkey (%)
Place of birth for the foreign-born population - Yemen (%)
Place of birth for the foreign-born population - Other Western Asia (%)
Place of birth for the foreign-born population - Eritrea (%)
Place of birth for the foreign-born population - Ethiopia (%)
Place of birth for the foreign-born population - Kenya (%)
Place of birth for the foreign-born population - Somalia (%)
Place of birth for the foreign-born population - Uganda (%)
Place of birth for the foreign-born population - Zimbabwe (%)
Place of birth for the foreign-born population - Other Eastern Africa (%)
Place of birth for the foreign-born population - Cameroon (%)
Place of birth for the foreign-born population - Congo (%)
Place of birth for the foreign-born population - Democratic Republic of Congo (Zaire) (%)
Place of birth for the foreign-born population - Other Middle Africa (%)
Place of birth for the foreign-born population - Egypt (%)
Place of birth for the foreign-born population - Morocco (%)
Place of birth for the foreign-born population - Sudan (%)
Place of birth for the foreign-born population - Other Northern Africa (%)
Place of birth for the foreign-born population - South Africa (%)
Place of birth for the foreign-born population - Other Southern Africa (%)
Place of birth for the foreign-born population - Cabo Verde (%)
Place of birth for the foreign-born population - Ghana (%)
Place of birth for the foreign-born population - Liberia (%)
Place of birth for the foreign-born population - Nigeria (%)
Place of birth for the foreign-born population - Senegal (%)
Place of birth for the foreign-born population - Sierra Leone (%)
Place of birth for the foreign-born population - Other Western Africa (%)
Place of birth for the foreign-born population - Australia (%)
Place of birth for the foreign-born population - New Zealand (%)
Place of birth for the foreign-born population - Fiji (%)
Place of birth for the foreign-born population - Micronesia (%)
Place of birth for the foreign-born population - Bahamas (%)
Place of birth for the foreign-born population - Barbados (%)
Place of birth for the foreign-born population - Cuba (%)
Place of birth for the foreign-born population - Dominica (%)
Place of birth for the foreign-born population - Dominican Republic (%)
Place of birth for the foreign-born population - Grenada (%)
Place of birth for the foreign-born population - Haiti (%)
Place of birth for the foreign-born population - Jamaica (%)
Place of birth for the foreign-born population - St. Vincent and the Grenadines (%)
Place of birth for the foreign-born population - Trinidad and Tobago (%)
Place of birth for the foreign-born population - West Indies (%)
Place of birth for the foreign-born population - Other Caribbean (%)
Place of birth for the foreign-born population - Belize (%)
Place of birth for the foreign-born population - Costa Rica (%)
Place of birth for the foreign-born population - El Salvador (%)
Place of birth for the foreign-born population - Guatemala (%)
Place of birth for the foreign-born population - Honduras (%)
Place of birth for the foreign-born population - Mexico (%)
Place of birth for the foreign-born population - Nicaragua (%)
Place of birth for the foreign-born population - Panama (%)
Place of birth for the foreign-born population - Other Central America (%)
Place of birth for the foreign-born population - Argentina (%)
Place of birth for the foreign-born population - Bolivia (%)
Place of birth for the foreign-born population - Brazil (%)
Place of birth for the foreign-born population - Chile (%)
Place of birth for the foreign-born population - Colombia (%)
Place of birth for the foreign-born population - Ecuador (%)
Place of birth for the foreign-born population - Guyana (%)
Place of birth for the foreign-born population - Peru (%)
Place of birth for the foreign-born population - Uruguay (%)
Place of birth for the foreign-born population - Venezuela (%)
Place of birth for the foreign-born population - Other South America (%)
Place of birth for the foreign-born population - Canada (%)
Place of birth for the foreign-born population - Other Northern America (%)
Place of birth for the foreign-born population - Other (%)
Latest news about races in Fallon, NV collected exclusively by city-data.com from local newspapers, TV, and radio stations
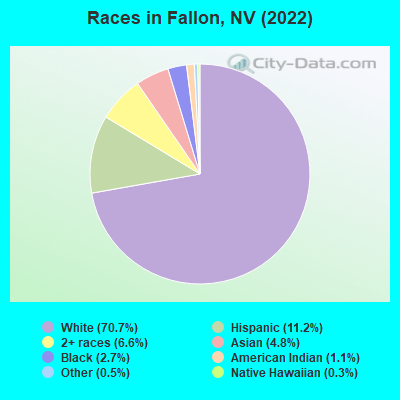
According to 2022 data, the most numerous races in Fallon, NV are White alone (6,690 residents), Hispanic (1,062 residents), and Black alone (259 residents). 91.1% of Fallon residents speak English at home. 8.0% of Fallon, NV residents are foreign-born (3.9% born in Latin America, 3.8% born in Asia), which is 125.5% less than the foreign-born rate of 18.0% across the entire state of Nevada.
Race distribution in Fallon
2000
2022
1,303,001 65.2% White alone
393,970 19.7% Hispanic
131,509 6.6% Black alone
88,593 4.4% Asian alone
49,231 2.5% Two or more races
21,397 1.1% American Indian alone
7,769 0.4% Native Hawaiian and Other Pacific Islander alone
2,787 0.1% Other race alone
1,410,145 44.4% White alone
961,357 30.3% Hispanic
286,471 9.0% Black alone
281,149 8.8% Asian alone
182,151 5.7% Two or more races
20,102 0.6% Native Hawaiian and Other Pacific Islander alone
18,781 0.6% Other race alone
17,616 0.6% American Indian alone
Income and house value in Fallon Median household income in 2022 $61,035 White non-Hispanic householders
$101,328 American Indian and Alaska Native householders
$46,769 Hispanic or Latino race householders
Median 2022 house value $275,009 White Non-Hispanic householders
$216,429 Black or African American householders
$279,337 American Indian or Alaska Native householders
$304,443 Asian householders
$238,937 Two or more races householders
$287,417 Hispanic or Latino householders
Median age by race in Fallon
41.3 Median age for White residents41.0 Males43.0 Females29.2 Median age for Black or African American residents29.2 Males-676,356,588.5 Females50.8 Median age for American Indian / Alaska Native residents33.3 Males54.6 Females41.2 Median age for Asian residents28.6 Males48.1 Females-690,618,761.8 Median age for Native Hawaiian / Pacific Islander residents-648,090,814.6 Males-725,146,198.1 Females26.0 Median age for Other race residents25.7 Males26.1 Females31.0 Median age for Two or more races residents41.6 Males19.3 Females40.2 Median age for White alone residents39.7 Males42.5 Females25.2 Median age for Hispanic or Latino residents25.5 Males24.8 Females
Owner/renter occupied households by race in Fallon
House owners and renters - White residents 1,540 52.9% Owner occupied1,374 47.1% Renter occupiedHouse owners and renters - Black or African American residents 223 100.0% Renter occupiedHouse owners and renters - American Indian / Alaska Native residents 8 5.8% Owner occupied126 94.2% Renter occupiedHouse owners and renters - Asian residents 113 67.5% Owner occupied54 32.5% Renter occupiedHouse owners and renters - Other race residents 38 17.2% Owner occupied185 82.8% Renter occupiedHouse owners and renters - Two or more races residents 169 62.4% Owner occupied102 37.6% Renter occupiedHouse owners and renters - White alone residents 1,554 52.1% Owner occupied1,428 47.9% Renter occupiedHouse owners and renters - Hispanic or Latino residents 110 28.5% Owner occupied276 71.5% Renter occupied
Language usage in Fallon
English speakers - Total 91.1% of residents of Fallon speak English at home.
5.2% of residents speak Spanish at home 391 84.6% Speak English very well71 15.4% Speak English less than very well3.6% of residents speak other language at home 246 76.4% Speak English very well76 23.6% Speak English less than very well
English speakers - Born in the United States 97.0% of residents of Fallon speak English at home.
0.5% of residents speak Spanish at home 22 88.0% Speak English very well3 12.0% Speak English less than very well2.4% of residents speak other language at home 127 100.0% Speak English very well
English speakers - Native, born elsewhere 92.1% of residents of Fallon speak English at home.
English speakers - Foreign-born 27.0% of residents of Fallon speak English at home.
50.5% of residents speak Spanish at home 328 85.9% Speak English very well54 14.1% Speak English less than very well22.9% of residents speak other language at home 98 56.6% Speak English very well75 43.4% Speak English less than very well
White (Caucasian) - Speak only English Native:
100.0% (6,303)Foreign-born:
38.4% (27)
White (Caucasian) - Speak another language Native:
1.5% (93)Foreign-born:
63.0% (44)
American Indian / Alaska Native - Speak another language Native:
13.4% (26)Foreign-born:
100.0% (10)
Asian - Speak only English Native:
67.6% (77)Foreign-born:
48.6% (166)
Asian - Speak another language Native:
31.9% (37)Foreign-born:
52.8% (180)
Other race - Speak only English Native:
90.7% (172)Foreign-born:
6.2% (18)
Other race - Speak another language Native:
7.0% (13)Foreign-born:
93.9% (282)
Two or more races - Speak only English Native:
90.5% (640)Foreign-born:
21.5% (7)
Two or more races - Speak another language Native:
4.8% (34)Foreign-born:
76.8% (26)
White alone - Speak only English Native:
98.9% (6,155)Foreign-born:
98.2% (30)
Hispanic or Latino - Speak another language Native:
12.2% (84)Foreign-born:
100.0% (374)
Foreign-born residents in Fallon 755 residents are foreign born (3.9% Latin America , 3.8% Asia ).
This city:
8.0%Nevada:
19.1%
Marital status for residents in Fallon Marital status - White (Caucasian) population 15 years and over
Males 31.7% Never married37.2% Now married2.5% Separated2.6% Widowed26.0% DivorcedFemales 26.6% Never married33.7% Now married2.3% Separated12.5% Widowed24.8% DivorcedWomen who gave birth in the past 12 months Now married:
0.0% (0)Unmarried:
100.0% (58)
Women who did not give birth in the past 12 months Now married:
37.5% (520)Unmarried:
62.5% (868)
Marital status - Black or African American population 15 years and over
Males 64.9% Never married35.1% Now married0.0% Separated0.0% Widowed0.0% DivorcedFemales 100.0% Never married0.0% Now married0.0% Separated0.0% Widowed0.0% DivorcedMarital status - American Indian / Alaska Native population 15 years and over
Males 71.2% Never married18.2% Now married0.0% Separated0.0% Widowed10.6% DivorcedFemales 10.2% Never married25.4% Now married0.0% Separated4.2% Widowed60.2% DivorcedWomen who did not give birth in the past 12 months Now married:
0.0% (0)Unmarried:
100.0% (18)
Marital status - Asian population 15 years and over
Males 55.4% Never married37.6% Now married0.0% Separated7.0% Widowed0.0% DivorcedFemales 0.0% Never married68.8% Now married0.0% Separated5.0% Widowed26.2% DivorcedWomen who did not give birth in the past 12 months Now married:
100.0% (73)Unmarried:
0.0% (0)
Marital status - Other race population 15 years and over
Males 79.8% Never married3.3% Now married0.0% Separated0.0% Widowed16.9% DivorcedFemales 66.2% Never married14.0% Now married0.0% Separated14.7% Widowed5.1% DivorcedWomen who did not give birth in the past 12 months Now married:
16.4% (21)Unmarried:
83.6% (105)
Marital status - Two or more races population 15 years and over
Males 56.2% Never married11.0% Now married0.0% Separated0.0% Widowed32.8% DivorcedFemales 78.4% Never married10.3% Now married0.0% Separated0.0% Widowed11.3% DivorcedWomen who gave birth in the past 12 months Now married:
0.0% (0)Unmarried:
100.0% (53)
Women who did not give birth in the past 12 months Now married:
10.4% (21)Unmarried:
89.6% (181)
Marital status - White alone, not Hispanic / Latino population 15 years and over
Males 32.9% Never married35.3% Now married2.7% Separated2.4% Widowed26.7% DivorcedFemales 25.2% Never married34.0% Now married2.5% Separated13.3% Widowed25.0% DivorcedWomen who gave birth in the past 12 months Now married:
0.0% (0)Unmarried:
100.0% (64)
Women who did not give birth in the past 12 months Now married:
38.7% (536)Unmarried:
61.3% (851)
Marital status - Hispanic or Latino population 15 years and over
Males 55.5% Never married28.3% Now married0.0% Separated1.7% Widowed14.5% DivorcedFemales 58.9% Never married19.9% Now married0.0% Separated8.3% Widowed12.9% DivorcedWomen who did not give birth in the past 12 months Now married:
20.5% (61)Unmarried:
79.5% (236)
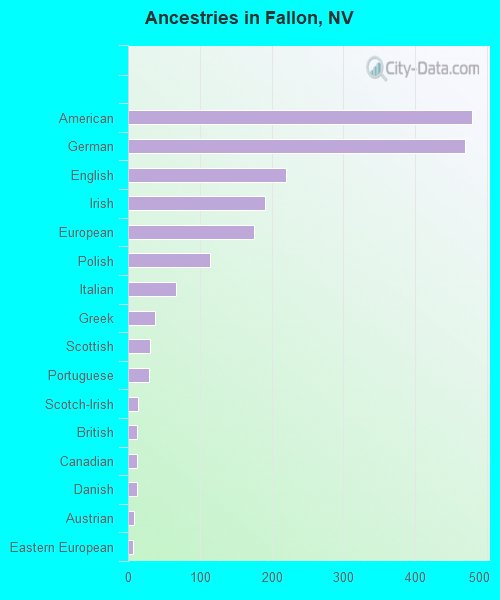
Ancestries in Fallon
479 12.6% American
470 12.4% German
220 5.8% English
191 5.0% Irish
176 4.6% European
114 3.0% Polish
67 1.8% Italian
38 1.0% Greek
31 0.8% Scottish
29 0.8% Portuguese
14 0.4% Scotch-Irish
12 0.3% British
12 0.3% Canadian
12 0.3% Danish
8 0.2% Austrian
7 0.2% Eastern European
3 0.08% Welsh
Children Nativity (place of birth) in Fallon
Children under 6 years - Living with two parents Both parents native 208 100.0% NativeChildren under 6 years - Living with one parent Native parent 390 100.0% NativeChildren 6 to 17 years - Living with two parents Both parents native 596 100.0% NativeBoth parents foreign-born 39 28.3% Native98 71.7% Foreign-bornChildren 6 to 17 years - Living with one parent Native parent 585 100.0% Native
Grandparents responsible for own grandchildren in Fallon
Grandparents (30 to 59 years) White / Caucasian 9 13.0% Responsible for grandchildren62 87.0% Not responsible for grandchildrenAmerican Indian / Alaska Native 21 100.0% Not responsible for grandchildrenWhite alone, not Hispanic / Latino 13 15.6% Responsible for grandchildren69 84.4% Not responsible for grandchildrenGrandparents (60 years and over) White / Caucasian 10 24.6% Responsible for grandchildren30 75.4% Not responsible for grandchildrenWhite alone, not Hispanic / Latino 11 24.9% Responsible for grandchildren34 75.1% Not responsible for grandchildren