Races in Fairview, Oregon (OR) Detailed Stats
Data:
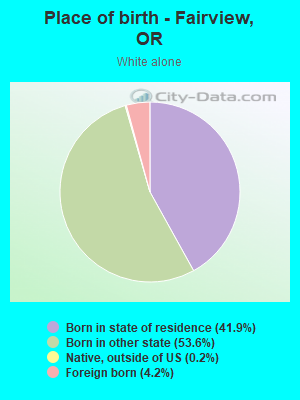
Races - White alone (%)
Races - White alone (% change since 2000)
Races - Black alone (%)
Races - Black alone (% change since 2000)
Races - American Indian alone (%)
Races - American Indian alone (% change since 2000)
Races - Asian alone (%)
Races - Asian alone (% change since 2000)
Races - Hispanic (%)
Races - Hispanic (% change since 2000)
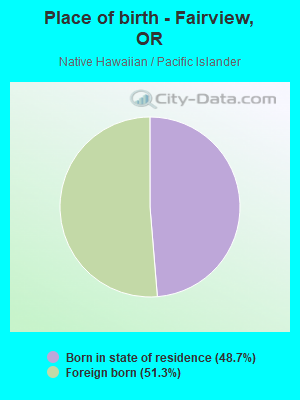
Races - Native Hawaiian and Other Pacific Islander alone (%)
Races - Native Hawaiian and Other Pacific Islander alone (% change since 2000)
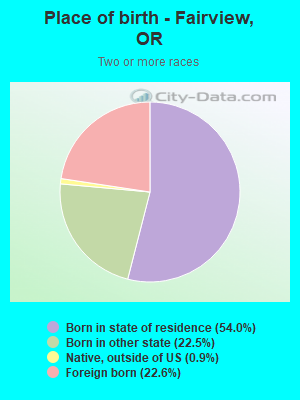
Races - Two or more races(%)
Races - Two or more races(% change since 2000)
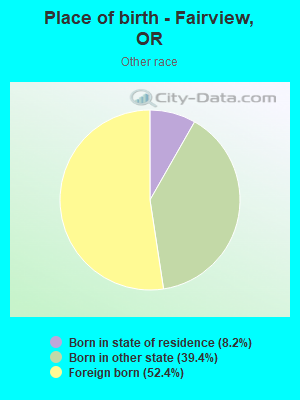
Races - Other race alone (%)
Races - Other race alone (% change since 2000)
Racial diversity
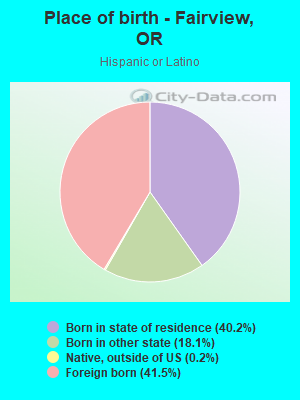
Place of birth - Born in state of residence (%)
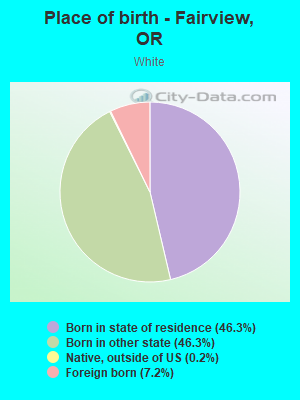
Place of birth - Born in state of residence (%) - White
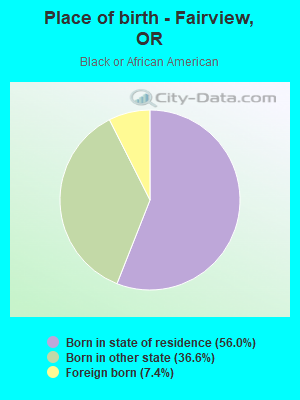
Place of birth - Born in state of residence (%) - Black or African American
Place of birth - Born in state of residence (%) - Asian
Place of birth - Born in state of residence (%) - Hispanic or Latino
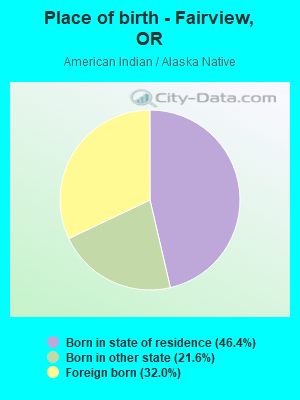
Place of birth - Born in state of residence (%) - American Indian and Alaska Native
Place of birth - Born in state of residence (%) - Multirace
Place of birth - Born in state of residence (%) - Other Race
Place of birth - Born in other state (%)
Place of birth - Born in other state (%) - White
Place of birth - Born in other state (%) - Black or African American
Place of birth - Born in other state (%) - Asian
Place of birth - Born in other state (%) - Hispanic or Latino
Place of birth - Born in other state (%) - American Indian and Alaska Native
Place of birth - Born in other state (%) - Multirace
Place of birth - Born in other state (%) - Other Race
Place of birth - Native, outside of US (%)
Place of birth - Native, outside of US (%) - White
Place of birth - Native, outside of US (%) - Black or African American
Place of birth - Native, outside of US (%) - Asian
Place of birth - Native, outside of US (%) - Hispanic or Latino
Place of birth - Native, outside of US (%) - American Indian and Alaska Native
Place of birth - Native, outside of US (%) - Multirace
Place of birth - Native, outside of US (%) - Other Race
Place of birth - Foreign born (%)
Place of birth - Foreign born (%) - White
Place of birth - Foreign born (%) - Black or African American
Place of birth - Foreign born (%) - Asian
Place of birth - Foreign born (%) - Hispanic or Latino
Place of birth - Foreign born (%) - American Indian and Alaska Native
Place of birth - Foreign born (%) - Multirace
Place of birth - Foreign born (%) - Other Race
Residents speaking English at home (%)
Residents speaking English at home - Born in the United States (%)
Residents speaking English at home - Native, born elsewhere (%)
Residents speaking English at home - Foreign born (%)
Residents speaking Spanish at home (%)
Residents speaking Spanish at home - Born in the United States (%)
Residents speaking Spanish at home - Native, born elsewhere (%)
Residents speaking Spanish at home - Foreign born (%)
Residents speaking other language at home (%)
Residents speaking other language at home - Born in the United States (%)
Residents speaking other language at home - Native, born elsewhere (%)
Residents speaking other language at home - Foreign born (%)
Marital status - Never married (%)
Marital status - Now married (%)
Marital status - Separated (%)
Marital status - Widowed (%)
Marital status - Divorced (%)
Ancestries Reported - Arab (%)
Ancestries Reported - Czech (%)
Ancestries Reported - Danish (%)
Ancestries Reported - Dutch (%)
Ancestries Reported - English (%)
Ancestries Reported - French (%)
Ancestries Reported - French Canadian (%)
Ancestries Reported - German (%)
Ancestries Reported - Greek (%)
Ancestries Reported - Hungarian (%)
Ancestries Reported - Irish (%)
Ancestries Reported - Italian (%)
Ancestries Reported - Lithuanian (%)
Ancestries Reported - Norwegian (%)
Ancestries Reported - Polish (%)
Ancestries Reported - Portuguese (%)
Ancestries Reported - Russian (%)
Ancestries Reported - Scotch-Irish (%)
Ancestries Reported - Scottish (%)
Ancestries Reported - Slovak (%)
Ancestries Reported - Subsaharan African (%)
Ancestries Reported - Swedish (%)
Ancestries Reported - Swiss (%)
Ancestries Reported - Ukrainian (%)
Ancestries Reported - United States (%)
Ancestries Reported - Welsh (%)
Ancestries Reported - West Indian (%)
Ancestries Reported - Other (%)
Geographical mobility - Same house 1 year ago (%)
Geographical mobility - Same house 1 year ago (%) - White
Geographical mobility - Same house 1 year ago (%) - Black or African American
Geographical mobility - Same house 1 year ago (%) - Asian
Geographical mobility - Same house 1 year ago (%) - Hispanic or Latino
Geographical mobility - Same house 1 year ago (%) - American Indian and Alaska Native
Geographical mobility - Same house 1 year ago (%) - Multirace
Geographical mobility - Same house 1 year ago (%) - Other Race
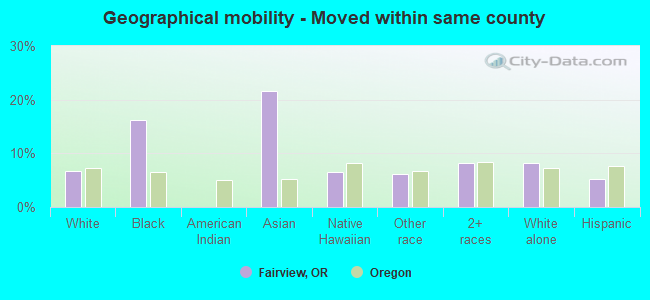
Geographical mobility - Moved within same county (%)
Geographical mobility - Moved within same county (%) - White
Geographical mobility - Moved within same county (%) - Black or African American
Geographical mobility - Moved within same county (%) - Asian
Geographical mobility - Moved within same county (%) - Hispanic or Latino
Geographical mobility - Moved within same county (%) - American Indian and Alaska Native
Geographical mobility - Moved within same county (%) - Multirace
Geographical mobility - Moved within same county (%) - Other Race
Geographical mobility - Moved from different county within same state (%)
Geographical mobility - Moved from different county within same state (%) - White
Geographical mobility - Moved from different county within same state (%) - Black or African American
Geographical mobility - Moved from different county within same state (%) - Asian
Geographical mobility - Moved from different county within same state (%) - Hispanic or Latino
Geographical mobility - Moved from different county within same state (%) - American Indian and Alaska Native
Geographical mobility - Moved from different county within same state (%) - Multirace
Geographical mobility - Moved from different county within same state (%) - Other Race
Geographical mobility - Moved from different state (%)
Geographical mobility - Moved from different state (%) - White
Geographical mobility - Moved from different state (%) - Black or African American
Geographical mobility - Moved from different state (%) - Asian
Geographical mobility - Moved from different state (%) - Hispanic or Latino
Geographical mobility - Moved from different state (%) - American Indian and Alaska Native
Geographical mobility - Moved from different state (%) - Multirace
Geographical mobility - Moved from different state (%) - Other Race
Geographical mobility - Moved from abroad (%)
Geographical mobility - Moved from abroad (%) - White
Geographical mobility - Moved from abroad (%) - Black or African American
Geographical mobility - Moved from abroad (%) - Asian
Geographical mobility - Moved from abroad (%) - Hispanic or Latino
Geographical mobility - Moved from abroad (%) - American Indian and Alaska Native
Geographical mobility - Moved from abroad (%) - Multirace
Geographical mobility - Moved from abroad (%) - Other Race
Place of birth for the foreign-born population - Ireland (%)
Place of birth for the foreign-born population - Denmark (%)
Place of birth for the foreign-born population - Norway (%)
Place of birth for the foreign-born population - Sweden (%)
Place of birth for the foreign-born population - United Kingdom (%)
Place of birth for the foreign-born population - England (%)
Place of birth for the foreign-born population - Scotland (%)
Place of birth for the foreign-born population - Other Northern Europe (%)
Place of birth for the foreign-born population - Austria (%)
Place of birth for the foreign-born population - Belgium (%)
Place of birth for the foreign-born population - France (%)
Place of birth for the foreign-born population - Germany (%)
Place of birth for the foreign-born population - Netherlands (%)
Place of birth for the foreign-born population - Switzerland (%)
Place of birth for the foreign-born population - Other Western Europe (%)
Place of birth for the foreign-born population - Greece (%)
Place of birth for the foreign-born population - Italy (%)
Place of birth for the foreign-born population - Portugal (%)
Place of birth for the foreign-born population - Spain (%)
Place of birth for the foreign-born population - Other Southern Europe (%)
Place of birth for the foreign-born population - Albania (%)
Place of birth for the foreign-born population - Belarus (%)
Place of birth for the foreign-born population - Bosnia and Herzegovina (%)
Place of birth for the foreign-born population - Bulgaria (%)
Place of birth for the foreign-born population - Croatia (%)
Place of birth for the foreign-born population - Czechoslovakia (%)
Place of birth for the foreign-born population - Hungary (%)
Place of birth for the foreign-born population - Latvia (%)
Place of birth for the foreign-born population - Lithuania (%)
Place of birth for the foreign-born population - North Macedonia (Macedonia) (%)
Place of birth for the foreign-born population - Moldova (%)
Place of birth for the foreign-born population - Poland (%)
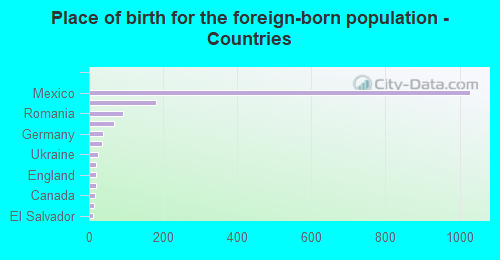
Place of birth for the foreign-born population - Romania (%)
Place of birth for the foreign-born population - Russia (%)
Place of birth for the foreign-born population - Serbia (%)
Place of birth for the foreign-born population - Ukraine (%)
Place of birth for the foreign-born population - Other Eastern Europe (%)
Place of birth for the foreign-born population - China (%)
Place of birth for the foreign-born population - Hong Kong (%)
Place of birth for the foreign-born population - Taiwan (%)
Place of birth for the foreign-born population - Japan (%)
Place of birth for the foreign-born population - Korea (%)
Place of birth for the foreign-born population - Other Eastern Asia (%)
Place of birth for the foreign-born population - Afghanistan (%)
Place of birth for the foreign-born population - Bangladesh (%)
Place of birth for the foreign-born population - India (%)
Place of birth for the foreign-born population - Iran (%)
Place of birth for the foreign-born population - Kazakhstan (%)
Place of birth for the foreign-born population - Nepal (%)
Place of birth for the foreign-born population - Pakistan (%)
Place of birth for the foreign-born population - Sri Lanka (%)
Place of birth for the foreign-born population - Uzbekistan (%)
Place of birth for the foreign-born population - Other South Central Asia (%)
Place of birth for the foreign-born population - Burma (%)
Place of birth for the foreign-born population - Cambodia (%)
Place of birth for the foreign-born population - Indonesia (%)
Place of birth for the foreign-born population - Laos (%)
Place of birth for the foreign-born population - Malaysia (%)
Place of birth for the foreign-born population - Philippines (%)
Place of birth for the foreign-born population - Singapore (%)
Place of birth for the foreign-born population - Thailand (%)
Place of birth for the foreign-born population - Vietnam (%)
Place of birth for the foreign-born population - Other South Eastern Asia (%)
Place of birth for the foreign-born population - Armenia (%)
Place of birth for the foreign-born population - Iraq (%)
Place of birth for the foreign-born population - Israel (%)
Place of birth for the foreign-born population - Jordan (%)
Place of birth for the foreign-born population - Kuwait (%)
Place of birth for the foreign-born population - Lebanon (%)
Place of birth for the foreign-born population - Saudi Arabia (%)
Place of birth for the foreign-born population - Syria (%)
Place of birth for the foreign-born population - Turkey (%)
Place of birth for the foreign-born population - Yemen (%)
Place of birth for the foreign-born population - Other Western Asia (%)
Place of birth for the foreign-born population - Eritrea (%)
Place of birth for the foreign-born population - Ethiopia (%)
Place of birth for the foreign-born population - Kenya (%)
Place of birth for the foreign-born population - Somalia (%)
Place of birth for the foreign-born population - Uganda (%)
Place of birth for the foreign-born population - Zimbabwe (%)
Place of birth for the foreign-born population - Other Eastern Africa (%)
Place of birth for the foreign-born population - Cameroon (%)
Place of birth for the foreign-born population - Congo (%)
Place of birth for the foreign-born population - Democratic Republic of Congo (Zaire) (%)
Place of birth for the foreign-born population - Other Middle Africa (%)
Place of birth for the foreign-born population - Egypt (%)
Place of birth for the foreign-born population - Morocco (%)
Place of birth for the foreign-born population - Sudan (%)
Place of birth for the foreign-born population - Other Northern Africa (%)
Place of birth for the foreign-born population - South Africa (%)
Place of birth for the foreign-born population - Other Southern Africa (%)
Place of birth for the foreign-born population - Cabo Verde (%)
Place of birth for the foreign-born population - Ghana (%)
Place of birth for the foreign-born population - Liberia (%)
Place of birth for the foreign-born population - Nigeria (%)
Place of birth for the foreign-born population - Senegal (%)
Place of birth for the foreign-born population - Sierra Leone (%)
Place of birth for the foreign-born population - Other Western Africa (%)
Place of birth for the foreign-born population - Australia (%)
Place of birth for the foreign-born population - New Zealand (%)
Place of birth for the foreign-born population - Fiji (%)
Place of birth for the foreign-born population - Micronesia (%)
Place of birth for the foreign-born population - Bahamas (%)
Place of birth for the foreign-born population - Barbados (%)
Place of birth for the foreign-born population - Cuba (%)
Place of birth for the foreign-born population - Dominica (%)
Place of birth for the foreign-born population - Dominican Republic (%)
Place of birth for the foreign-born population - Grenada (%)
Place of birth for the foreign-born population - Haiti (%)
Place of birth for the foreign-born population - Jamaica (%)
Place of birth for the foreign-born population - St. Vincent and the Grenadines (%)
Place of birth for the foreign-born population - Trinidad and Tobago (%)
Place of birth for the foreign-born population - West Indies (%)
Place of birth for the foreign-born population - Other Caribbean (%)
Place of birth for the foreign-born population - Belize (%)
Place of birth for the foreign-born population - Costa Rica (%)
Place of birth for the foreign-born population - El Salvador (%)
Place of birth for the foreign-born population - Guatemala (%)
Place of birth for the foreign-born population - Honduras (%)
Place of birth for the foreign-born population - Mexico (%)
Place of birth for the foreign-born population - Nicaragua (%)
Place of birth for the foreign-born population - Panama (%)
Place of birth for the foreign-born population - Other Central America (%)
Place of birth for the foreign-born population - Argentina (%)
Place of birth for the foreign-born population - Bolivia (%)
Place of birth for the foreign-born population - Brazil (%)
Place of birth for the foreign-born population - Chile (%)
Place of birth for the foreign-born population - Colombia (%)
Place of birth for the foreign-born population - Ecuador (%)
Place of birth for the foreign-born population - Guyana (%)
Place of birth for the foreign-born population - Peru (%)
Place of birth for the foreign-born population - Uruguay (%)
Place of birth for the foreign-born population - Venezuela (%)
Place of birth for the foreign-born population - Other South America (%)
Place of birth for the foreign-born population - Canada (%)
Place of birth for the foreign-born population - Other Northern America (%)
Place of birth for the foreign-born population - Other (%)
Latest news about races in Fairview, OR collected exclusively by city-data.com from local newspapers, TV, and radio stations
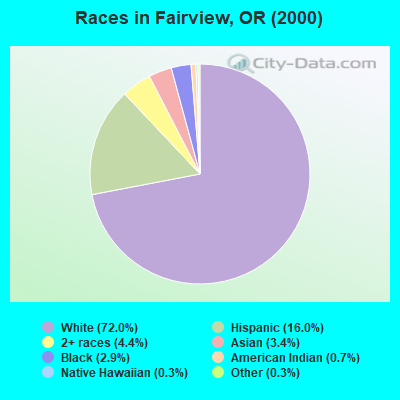
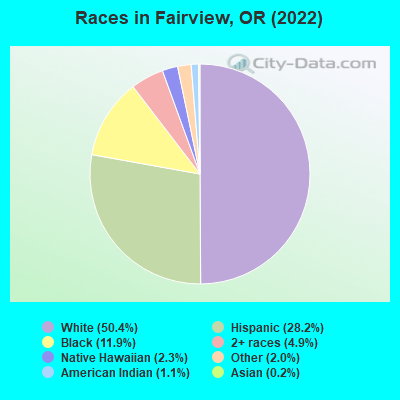
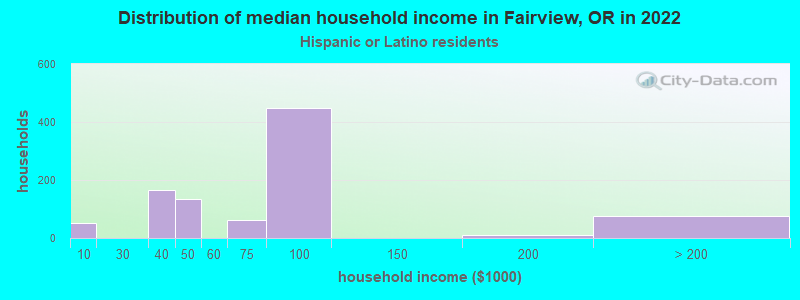
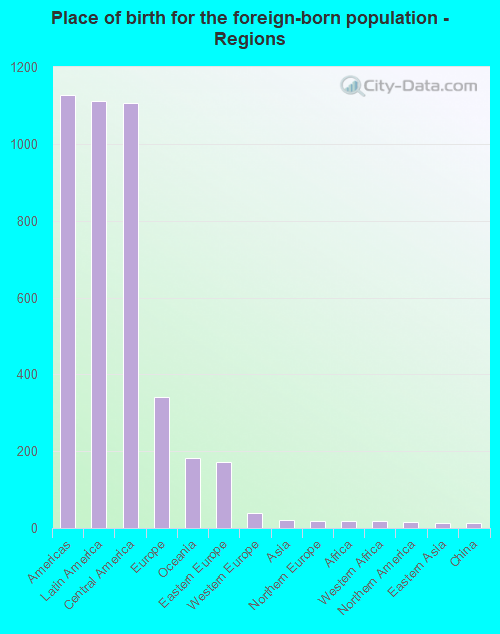
According to 2022 data, the most numerous races in Fairview, OR are White alone (5,209 residents), Hispanic (2,922 residents), and Two or more races (506 residents). 71.4% of Fairview residents speak English at home. 16.4% of Fairview, OR residents are foreign-born (10.4% born in Latin America, 3.2% born in Europe, 1.7% born in Oceania), which is 45.0% greater than the foreign-born rate of 9.0% across the entire state of Oregon.
Race distribution in Fairview
2000 2022
2,857,616 83.5% White alone 275,314 8.0% Hispanic 100,333 2.9% Asian alone 82,733 2.4% Two or more races 53,325 1.6% Black alone 40,130 1.2% American Indian alone 7,398 0.2% Native Hawaiian and Other 4,550 0.1% Other race alone
3,037,571 71.6% White alone 609,538 14.4% Hispanic 252,744 6.0% Two or more races 191,283 4.5% Asian alone 78,228 1.8% Black alone 29,399 0.7% American Indian alone 25,731 0.6% Other race alone 15,643 0.4% Native Hawaiian and Other
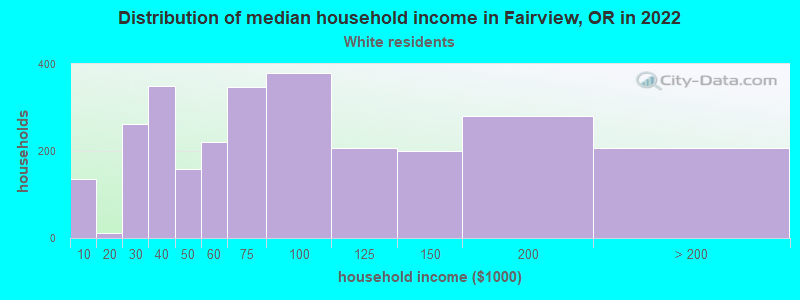
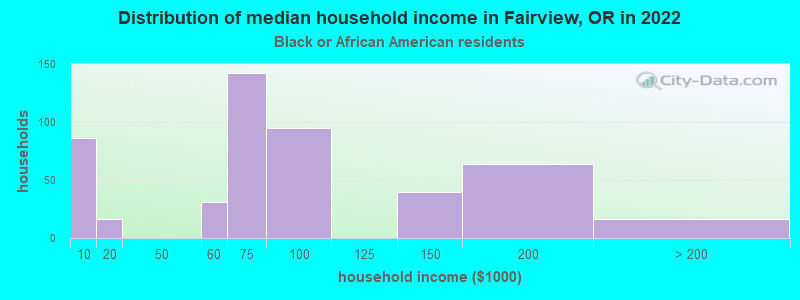
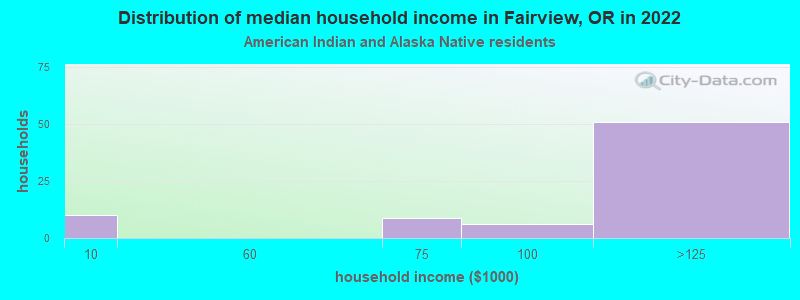
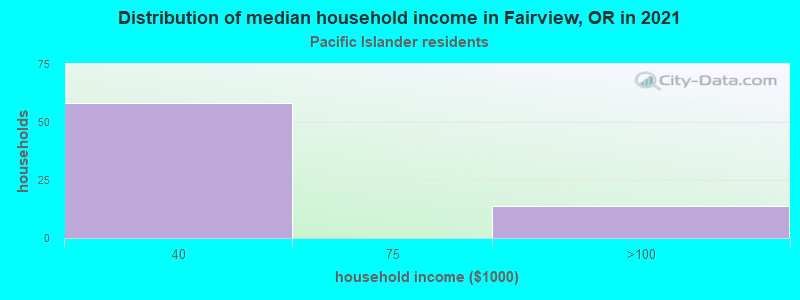
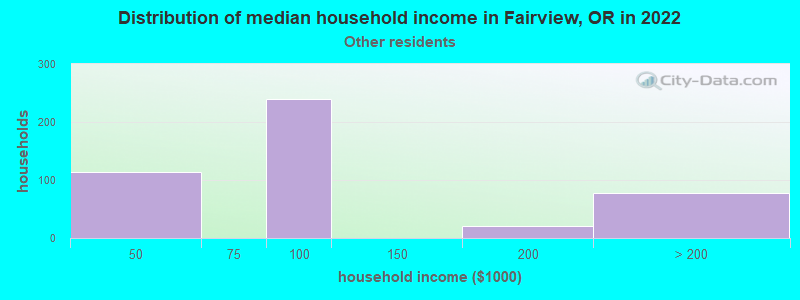
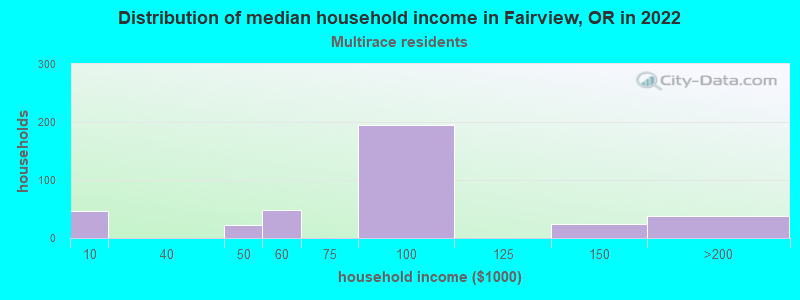
Income and house value in Fairview Median household income in 2022 $71,690 White non-Hispanic householders$63,374 Black householders$91,900 American Indian and Alaska Native householders$82,683 Some other race householders$92,173 Two or more races householders$87,437 Hispanic or Latino race householdersMedian 2022 house value $574,071 White Non-Hispanic householders$608,311 Black or African American householders$424,152 American Indian or Alaska Native householders $666,613 Asian householders$510,833 Some other race householders$335,928 Two or more races householders$506,206 Hispanic or Latino householders
Median age by race in Fairview
40.4 Median age for White residents38.2 44.2 25.8 Median age for Black or African American residents20.2 25.7 39.4 Median age for American Indian / Alaska Native residents27.6 -556,277,055.7 -690,909,090.2 Median age for Asian residents-697,632,057.6 -688,279,301.1 29.3 Median age for Native Hawaiian / Pacific Islander residents39.5 14.1 32.1 Median age for Other race residents31.3 37.8 23.2 Median age for Two or more races residents25.1 21.6 51.1 Median age for White alone residents48.3 56.4 27.6 Median age for Hispanic or Latino residents29.4 24.5
Owner/renter occupied households by race in Fairview
House owners and renters - White residents 1,500 54.4% Owner occupied1,258 45.6% Renter occupiedHouse owners and renters - Black or African American residents 195 40.6% Owner occupied285 59.4% Renter occupiedHouse owners and renters - American Indian / Alaska Native residents 7 13.2% Owner occupied48 86.8% Renter occupiedHouse owners and renters - Asian residents 6 100.0% Owner occupiedHouse owners and renters - Native Hawaiian / Pacific Islander residents 24 44.3% Owner occupied30 55.7% Renter occupiedHouse owners and renters - Other race residents 337 55.0% Owner occupied276 45.0% Renter occupiedHouse owners and renters - Two or more races residents 53 15.6% Owner occupied289 84.4% Renter occupiedHouse owners and renters - White alone residents 1,519 59.4% Owner occupied1,037 40.6% Renter occupiedHouse owners and renters - Hispanic or Latino residents 185 21.1% Owner occupied693 78.9% Renter occupied
Language usage in Fairview
English speakers - Total 71.4% of residents of Fairview speak English at home.
23.2% of residents speak Spanish at home 1,574 68.1% Speak English very well739 31.9% Speak English less than very well5.6% of residents speak other language at home 384 68.3% Speak English very well178 31.7% Speak English less than very well
English speakers - Born in the United States 89.3% of residents of Fairview speak English at home.
9.8% of residents speak Spanish at home 334 82.1% Speak English very well73 17.9% Speak English less than very well1.1% of residents speak other language at home 36 78.3% Speak English very well10 21.7% Speak English less than very well
English speakers - Native, born elsewhere 40.0% of residents of Fairview speak English at home.
60.0% of residents speak other language at home 12 100.0% Speak English very well
English speakers - Foreign-born 7.3% of residents of Fairview speak English at home.
71.4% of residents speak Spanish at home 485 43.0% Speak English very well643 57.0% Speak English less than very well24.3% of residents speak other language at home 242 63.0% Speak English very well142 37.0% Speak English less than very well
White (Caucasian) - Speak only English Native:
88.8% (4,857)Foreign-born:
18.5% (81)
White (Caucasian) - Speak another language Native:
9.6% (525)Foreign-born:
76.3% (334)
Black or African American - Speak another language Native:
1.6% (19)Foreign-born:
96.3% (92)
Native Hawaiian / Pacific Islander - Speak another language Native:
34.9% (35)Foreign-born:
86.1% (92)
Other race - Speak another language Native:
64.3% (563)Foreign-born:
96.6% (873)
Two or more races - Speak only English Native:
66.8% (526)Foreign-born:
7.6% (22)
Two or more races - Speak another language Native:
34.8% (274)Foreign-born:
92.4% (269)
White alone - Speak only English Native:
98.0% (4,798)Foreign-born:
37.6% (83)
White alone - Speak another language Native:
2.1% (102)Foreign-born:
62.4% (138)
Hispanic or Latino - Speak another language Native:
79.3% (1,238)Foreign-born:
95.8% (1,173)
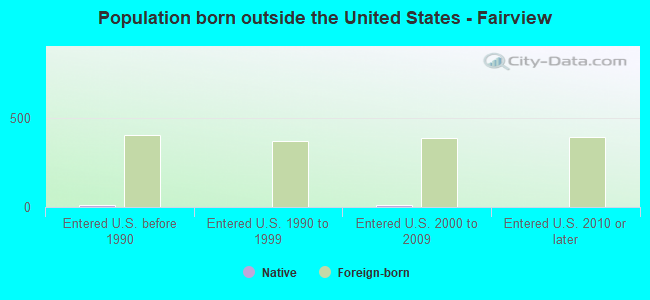
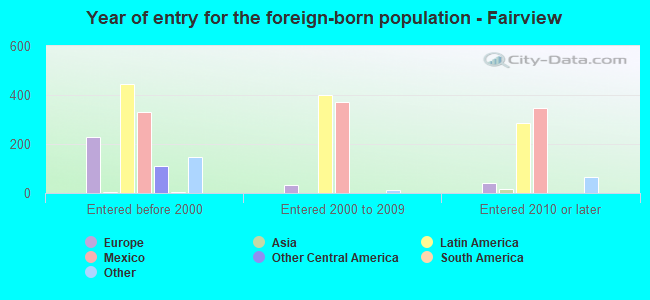
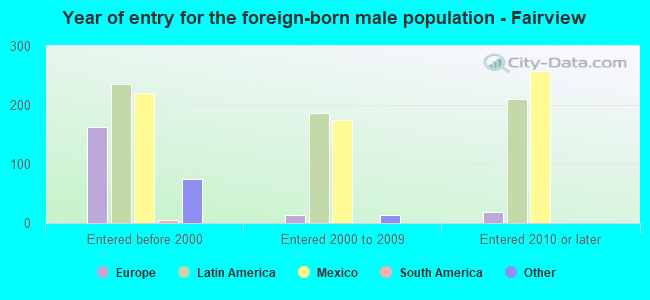
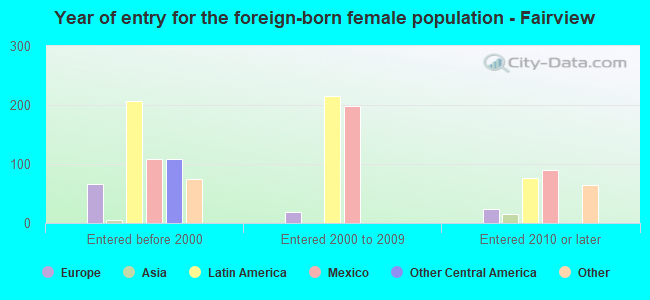
Foreign-born residents in Fairview 1,692 residents are foreign born (10.4% Latin America , 3.2% Europe , 1.7% Oceania ).
This city:
16.4%Oregon:
9.8%
Marital status for residents in Fairview Marital status - White (Caucasian) population 15 years and over
Males 37.5% Never married48.6% Now married1.3% Separated5.7% Widowed6.9% DivorcedFemales 20.6% Never married47.1% Now married4.3% Separated7.9% Widowed20.2% DivorcedWomen who gave birth in the past 12 months Now married:
100.0% (47)Unmarried:
0.0% (0)
Women who did not give birth in the past 12 months Now married:
55.2% (694)Unmarried:
44.8% (564)
Marital status - Black or African American population 15 years and over
Males 76.3% Never married23.7% Now married0.0% Separated0.0% Widowed0.0% DivorcedFemales 76.6% Never married4.2% Now married16.7% Separated0.0% Widowed2.5% DivorcedWomen who did not give birth in the past 12 months Now married:
11.8% (51)Unmarried:
88.2% (386)
Marital status - American Indian / Alaska Native population 15 years and over
Males 63.6% Never married16.4% Now married0.0% Separated0.0% Widowed20.0% DivorcedFemales 0.0% Never married100.0% Now married0.0% Separated0.0% Widowed0.0% DivorcedWomen who did not give birth in the past 12 months Now married:
100.0% (40)Unmarried:
0.0% (0)
Marital status - Native Hawaiian / Pacific Islander population 15 years and over
Males 0.0% Never married100.0% Now married0.0% Separated0.0% Widowed0.0% DivorcedFemales 22.7% Never married45.5% Now married0.0% Separated31.8% Widowed0.0% DivorcedWomen who gave birth in the past 12 months Now married:
100.0% (11)Unmarried:
0.0% (0)
Women who did not give birth in the past 12 months Now married:
60.0% (32)Unmarried:
40.0% (21)
Marital status - Other race population 15 years and over
Males 39.3% Never married49.2% Now married11.5% Separated0.0% Widowed0.0% DivorcedFemales 21.1% Never married75.1% Now married0.0% Separated0.0% Widowed3.8% DivorcedWomen who did not give birth in the past 12 months Now married:
68.6% (329)Unmarried:
31.4% (150)
Marital status - Two or more races population 15 years and over
Males 44.8% Never married55.2% Now married0.0% Separated0.0% Widowed0.0% DivorcedFemales 46.2% Never married43.3% Now married0.0% Separated10.6% Widowed0.0% DivorcedWomen who did not give birth in the past 12 months Now married:
45.8% (194)Unmarried:
54.2% (230)
Marital status - White alone, not Hispanic / Latino population 15 years and over
Males 36.6% Never married49.7% Now married1.5% Separated6.5% Widowed5.6% DivorcedFemales 18.9% Never married44.0% Now married4.9% Separated9.0% Widowed23.2% DivorcedWomen who gave birth in the past 12 months Now married:
100.0% (36)Unmarried:
0.0% (0)
Women who did not give birth in the past 12 months Now married:
51.1% (496)Unmarried:
48.9% (474)
Marital status - Hispanic or Latino population 15 years and over
Males 40.6% Never married46.8% Now married6.9% Separated0.0% Widowed5.8% DivorcedFemales 34.1% Never married64.2% Now married0.0% Separated0.0% Widowed1.6% DivorcedWomen who gave birth in the past 12 months Now married:
100.0% (15)Unmarried:
0.0% (0)
Women who did not give birth in the past 12 months Now married:
61.1% (584)Unmarried:
38.9% (372)
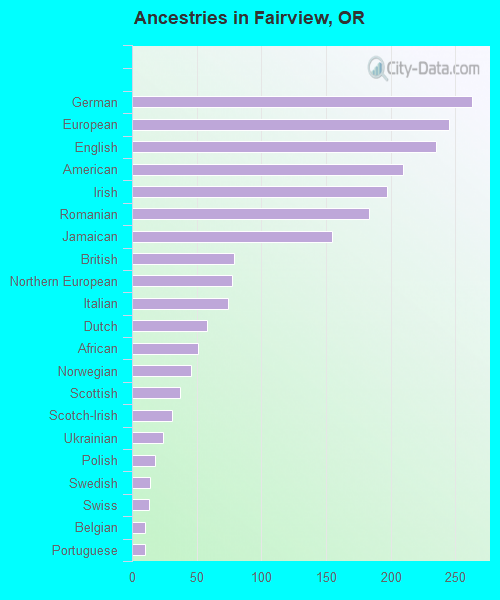
Ancestries in Fairview
263 4.4% German245 4.1% European235 4.0% English210 3.6% American197 3.3% Irish183 3.1% Romanian155 2.6% Jamaican79 1.3% British77 1.3% Northern European74 1.3% Italian58 1.0% Dutch51 0.9% African46 0.8% Norwegian37 0.6% Scottish31 0.5% Scotch-Irish24 0.4% Ukrainian18 0.3% Polish14 0.2% Swedish13 0.2% Swiss10 0.2% Belgian10 0.2% Portuguese
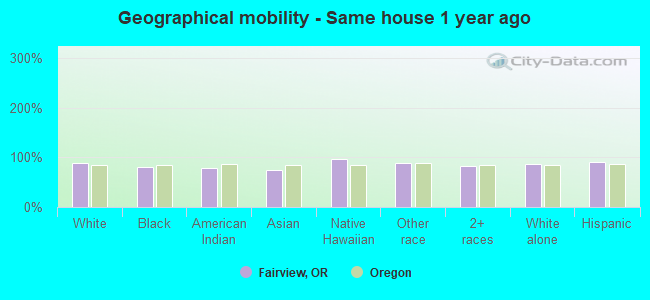
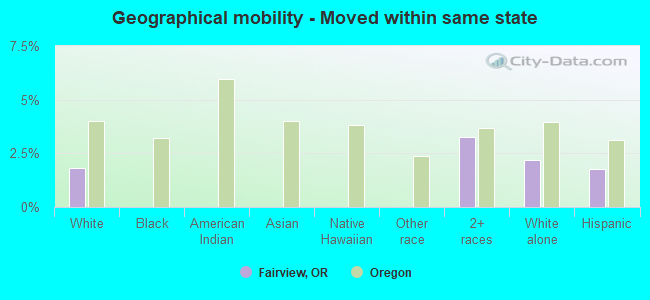
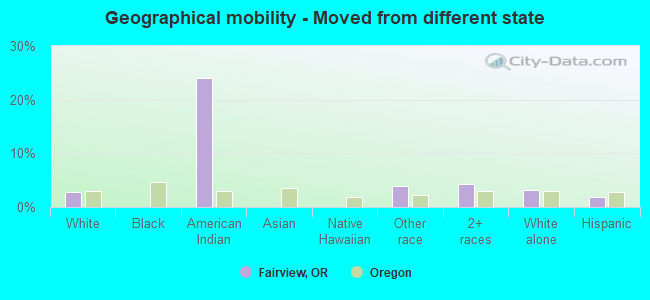
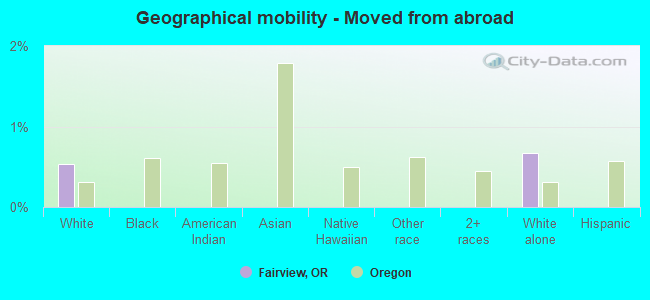
Geographical mobility in Fairview Same house 1 year ago 5,379 88.3% White (Caucasian)972 79.5% Black or African American127 78.3% American Indian / Alaska Native18 73.8% Asian241 96.5% Native Hawaiian / Pacific Islander1,527 89.2% Other race1,025 83.1% Two or more races4,439 85.8% White alone, not Hispanic / Latino2,647 90.2% Hispanic or LatinoMoved within same county 414 6.8% White / Caucasian199 16.3% Black or African American5 21.7% Asian16 6.6% Native Hawaiian / Pacific Islander104 6.1% Other race102 8.3% Two or more races424 8.2% White alone, not Hispanic / Latino151 5.1% Hispanic or LatinoMoved within same state 111 1.8% White / Caucasian40 3.3% Two or more races114 2.2% White alone, not Hispanic / Latino52 1.8% Hispanic or LatinoMoved from different state 165 2.7% White / Caucasian39 24.0% American Indian / Alaska Native66 3.9% Other race54 4.4% Two or more races169 3.3% White alone, not Hispanic / Latino53 1.8% Hispanic or LatinoMoved from abroad 32 0.5% White35 0.7% White alone, not Hispanic / Latino
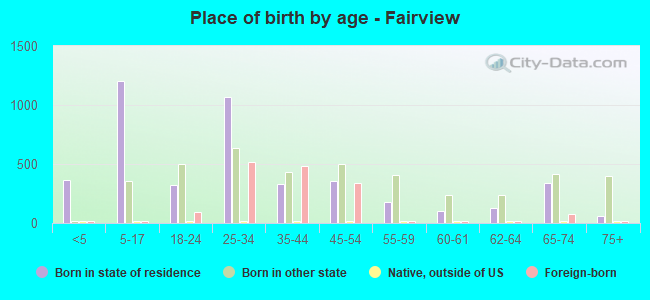
Children Nativity (place of birth) in Fairview
Children under 6 years - Living with two parents Both parents native 80 100.0% NativeBoth parents foreign-born 64 100.0% NativeOne native, one foreign-born parent 67 100.0% NativeChildren under 6 years - Living with one parent Native parent 201 100.0% NativeForeign-born parent 26 100.0% Foreign-bornChildren 6 to 17 years - Living with two parents Both parents native 371 100.0% NativeBoth parents foreign-born 429 100.0% NativeOne native, one foreign-born parent 120 100.0% NativeChildren 6 to 17 years - Living with one parent Native parent 263 100.0% NativeForeign-born parent 122 50.0% Native123 50.0% Foreign-born
Grandparents responsible for own grandchildren in Fairview
Grandparents (30 to 59 years) White / Caucasian 11 100.0% Not responsible for grandchildrenBlack or African American 90 100.0% Not responsible for grandchildrenWhite alone, not Hispanic / Latino 11 100.0% Not responsible for grandchildren
Grandparents (60 years and over) White / Caucasian 76 100.0% Not responsible for grandchildrenWhite alone, not Hispanic / Latino 80 100.0% Not responsible for grandchildren