Races in Everett, Washington (WA) Detailed Stats
Data:
Races - White alone (%)
Races - White alone (% change since 2000)
Races - Black alone (%)
Races - Black alone (% change since 2000)
Races - American Indian alone (%)
Races - American Indian alone (% change since 2000)
Races - Asian alone (%)
Races - Asian alone (% change since 2000)
Races - Hispanic (%)
Races - Hispanic (% change since 2000)
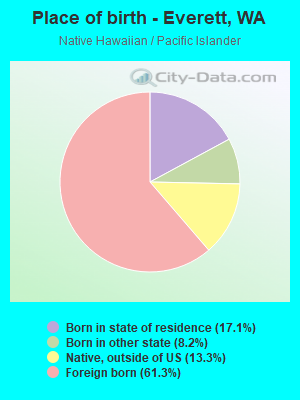
Races - Native Hawaiian and Other Pacific Islander alone (%)
Races - Native Hawaiian and Other Pacific Islander alone (% change since 2000)
Races - Two or more races(%)
Races - Two or more races(% change since 2000)
Races - Other race alone (%)
Races - Other race alone (% change since 2000)
Racial diversity
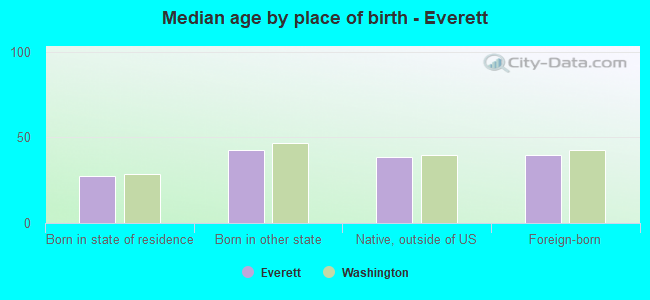
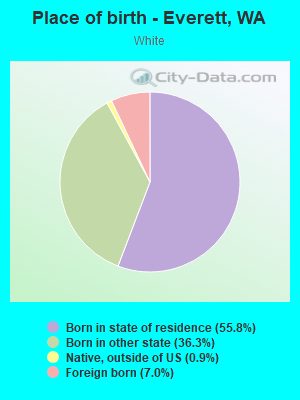
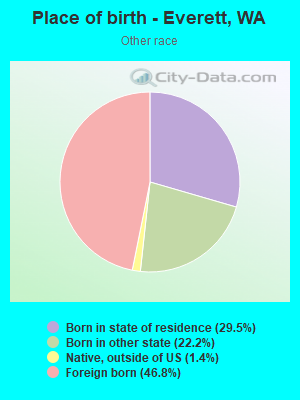
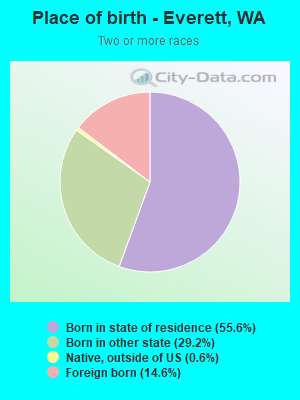
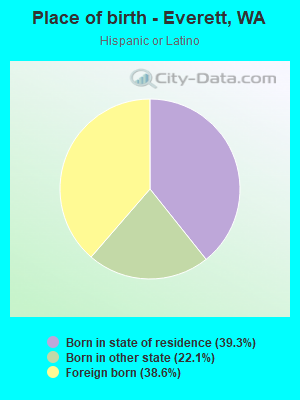
Place of birth - Born in state of residence (%)
Place of birth - Born in state of residence (%) - White
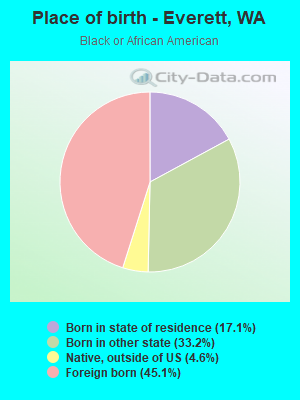
Place of birth - Born in state of residence (%) - Black or African American
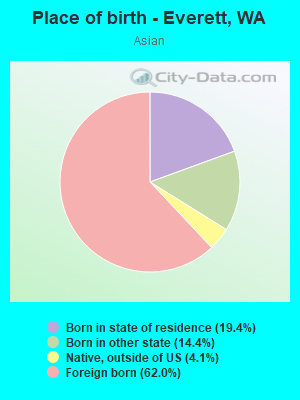
Place of birth - Born in state of residence (%) - Asian
Place of birth - Born in state of residence (%) - Hispanic or Latino
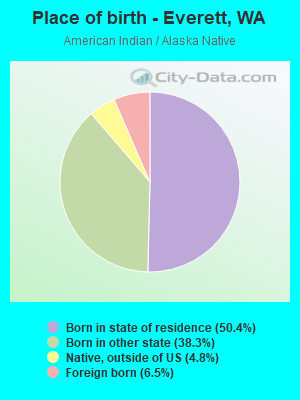
Place of birth - Born in state of residence (%) - American Indian and Alaska Native
Place of birth - Born in state of residence (%) - Multirace
Place of birth - Born in state of residence (%) - Other Race
Place of birth - Born in other state (%)
Place of birth - Born in other state (%) - White
Place of birth - Born in other state (%) - Black or African American
Place of birth - Born in other state (%) - Asian
Place of birth - Born in other state (%) - Hispanic or Latino
Place of birth - Born in other state (%) - American Indian and Alaska Native
Place of birth - Born in other state (%) - Multirace
Place of birth - Born in other state (%) - Other Race
Place of birth - Native, outside of US (%)
Place of birth - Native, outside of US (%) - White
Place of birth - Native, outside of US (%) - Black or African American
Place of birth - Native, outside of US (%) - Asian
Place of birth - Native, outside of US (%) - Hispanic or Latino
Place of birth - Native, outside of US (%) - American Indian and Alaska Native
Place of birth - Native, outside of US (%) - Multirace
Place of birth - Native, outside of US (%) - Other Race
Place of birth - Foreign born (%)
Place of birth - Foreign born (%) - White
Place of birth - Foreign born (%) - Black or African American
Place of birth - Foreign born (%) - Asian
Place of birth - Foreign born (%) - Hispanic or Latino
Place of birth - Foreign born (%) - American Indian and Alaska Native
Place of birth - Foreign born (%) - Multirace
Place of birth - Foreign born (%) - Other Race
Residents speaking English at home (%)
Residents speaking English at home - Born in the United States (%)
Residents speaking English at home - Native, born elsewhere (%)
Residents speaking English at home - Foreign born (%)
Residents speaking Spanish at home (%)
Residents speaking Spanish at home - Born in the United States (%)
Residents speaking Spanish at home - Native, born elsewhere (%)
Residents speaking Spanish at home - Foreign born (%)
Residents speaking other language at home (%)
Residents speaking other language at home - Born in the United States (%)
Residents speaking other language at home - Native, born elsewhere (%)
Residents speaking other language at home - Foreign born (%)
Marital status - Never married (%)
Marital status - Now married (%)
Marital status - Separated (%)
Marital status - Widowed (%)
Marital status - Divorced (%)
Ancestries Reported - Arab (%)
Ancestries Reported - Czech (%)
Ancestries Reported - Danish (%)
Ancestries Reported - Dutch (%)
Ancestries Reported - English (%)
Ancestries Reported - French (%)
Ancestries Reported - French Canadian (%)
Ancestries Reported - German (%)
Ancestries Reported - Greek (%)
Ancestries Reported - Hungarian (%)
Ancestries Reported - Irish (%)
Ancestries Reported - Italian (%)
Ancestries Reported - Lithuanian (%)
Ancestries Reported - Norwegian (%)
Ancestries Reported - Polish (%)
Ancestries Reported - Portuguese (%)
Ancestries Reported - Russian (%)
Ancestries Reported - Scotch-Irish (%)
Ancestries Reported - Scottish (%)
Ancestries Reported - Slovak (%)
Ancestries Reported - Subsaharan African (%)
Ancestries Reported - Swedish (%)
Ancestries Reported - Swiss (%)
Ancestries Reported - Ukrainian (%)
Ancestries Reported - United States (%)
Ancestries Reported - Welsh (%)
Ancestries Reported - West Indian (%)
Ancestries Reported - Other (%)
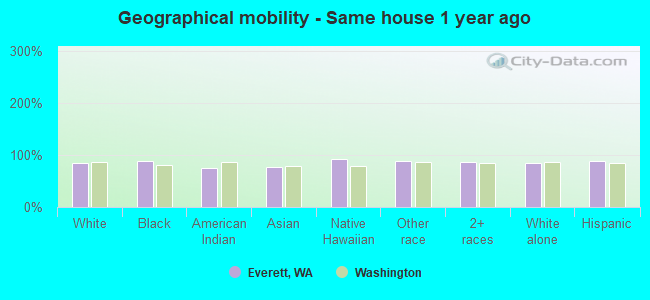
Geographical mobility - Same house 1 year ago (%)
Geographical mobility - Same house 1 year ago (%) - White
Geographical mobility - Same house 1 year ago (%) - Black or African American
Geographical mobility - Same house 1 year ago (%) - Asian
Geographical mobility - Same house 1 year ago (%) - Hispanic or Latino
Geographical mobility - Same house 1 year ago (%) - American Indian and Alaska Native
Geographical mobility - Same house 1 year ago (%) - Multirace
Geographical mobility - Same house 1 year ago (%) - Other Race
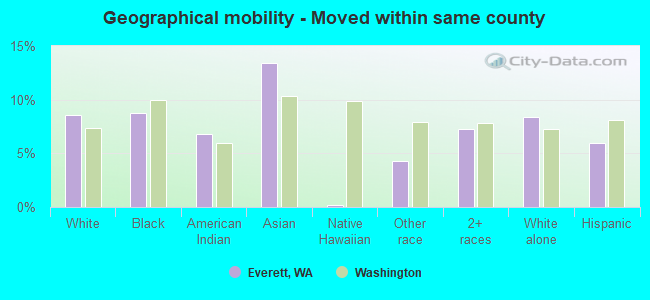
Geographical mobility - Moved within same county (%)
Geographical mobility - Moved within same county (%) - White
Geographical mobility - Moved within same county (%) - Black or African American
Geographical mobility - Moved within same county (%) - Asian
Geographical mobility - Moved within same county (%) - Hispanic or Latino
Geographical mobility - Moved within same county (%) - American Indian and Alaska Native
Geographical mobility - Moved within same county (%) - Multirace
Geographical mobility - Moved within same county (%) - Other Race
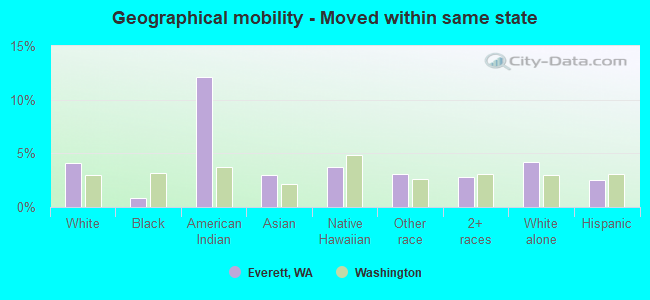
Geographical mobility - Moved from different county within same state (%)
Geographical mobility - Moved from different county within same state (%) - White
Geographical mobility - Moved from different county within same state (%) - Black or African American
Geographical mobility - Moved from different county within same state (%) - Asian
Geographical mobility - Moved from different county within same state (%) - Hispanic or Latino
Geographical mobility - Moved from different county within same state (%) - American Indian and Alaska Native
Geographical mobility - Moved from different county within same state (%) - Multirace
Geographical mobility - Moved from different county within same state (%) - Other Race
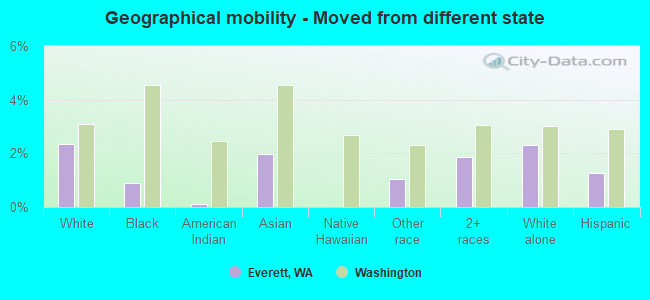
Geographical mobility - Moved from different state (%)
Geographical mobility - Moved from different state (%) - White
Geographical mobility - Moved from different state (%) - Black or African American
Geographical mobility - Moved from different state (%) - Asian
Geographical mobility - Moved from different state (%) - Hispanic or Latino
Geographical mobility - Moved from different state (%) - American Indian and Alaska Native
Geographical mobility - Moved from different state (%) - Multirace
Geographical mobility - Moved from different state (%) - Other Race
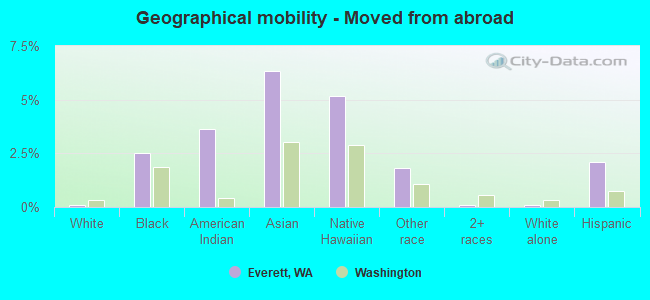
Geographical mobility - Moved from abroad (%)
Geographical mobility - Moved from abroad (%) - White
Geographical mobility - Moved from abroad (%) - Black or African American
Geographical mobility - Moved from abroad (%) - Asian
Geographical mobility - Moved from abroad (%) - Hispanic or Latino
Geographical mobility - Moved from abroad (%) - American Indian and Alaska Native
Geographical mobility - Moved from abroad (%) - Multirace
Geographical mobility - Moved from abroad (%) - Other Race
Place of birth for the foreign-born population - Ireland (%)
Place of birth for the foreign-born population - Denmark (%)
Place of birth for the foreign-born population - Norway (%)
Place of birth for the foreign-born population - Sweden (%)
Place of birth for the foreign-born population - United Kingdom (%)
Place of birth for the foreign-born population - England (%)
Place of birth for the foreign-born population - Scotland (%)
Place of birth for the foreign-born population - Other Northern Europe (%)
Place of birth for the foreign-born population - Austria (%)
Place of birth for the foreign-born population - Belgium (%)
Place of birth for the foreign-born population - France (%)
Place of birth for the foreign-born population - Germany (%)
Place of birth for the foreign-born population - Netherlands (%)
Place of birth for the foreign-born population - Switzerland (%)
Place of birth for the foreign-born population - Other Western Europe (%)
Place of birth for the foreign-born population - Greece (%)
Place of birth for the foreign-born population - Italy (%)
Place of birth for the foreign-born population - Portugal (%)
Place of birth for the foreign-born population - Spain (%)
Place of birth for the foreign-born population - Other Southern Europe (%)
Place of birth for the foreign-born population - Albania (%)
Place of birth for the foreign-born population - Belarus (%)
Place of birth for the foreign-born population - Bosnia and Herzegovina (%)
Place of birth for the foreign-born population - Bulgaria (%)
Place of birth for the foreign-born population - Croatia (%)
Place of birth for the foreign-born population - Czechoslovakia (%)
Place of birth for the foreign-born population - Hungary (%)
Place of birth for the foreign-born population - Latvia (%)
Place of birth for the foreign-born population - Lithuania (%)
Place of birth for the foreign-born population - North Macedonia (Macedonia) (%)
Place of birth for the foreign-born population - Moldova (%)
Place of birth for the foreign-born population - Poland (%)
Place of birth for the foreign-born population - Romania (%)
Place of birth for the foreign-born population - Russia (%)
Place of birth for the foreign-born population - Serbia (%)
Place of birth for the foreign-born population - Ukraine (%)
Place of birth for the foreign-born population - Other Eastern Europe (%)
Place of birth for the foreign-born population - China (%)
Place of birth for the foreign-born population - Hong Kong (%)
Place of birth for the foreign-born population - Taiwan (%)
Place of birth for the foreign-born population - Japan (%)
Place of birth for the foreign-born population - Korea (%)
Place of birth for the foreign-born population - Other Eastern Asia (%)
Place of birth for the foreign-born population - Afghanistan (%)
Place of birth for the foreign-born population - Bangladesh (%)
Place of birth for the foreign-born population - India (%)
Place of birth for the foreign-born population - Iran (%)
Place of birth for the foreign-born population - Kazakhstan (%)
Place of birth for the foreign-born population - Nepal (%)
Place of birth for the foreign-born population - Pakistan (%)
Place of birth for the foreign-born population - Sri Lanka (%)
Place of birth for the foreign-born population - Uzbekistan (%)
Place of birth for the foreign-born population - Other South Central Asia (%)
Place of birth for the foreign-born population - Burma (%)
Place of birth for the foreign-born population - Cambodia (%)
Place of birth for the foreign-born population - Indonesia (%)
Place of birth for the foreign-born population - Laos (%)
Place of birth for the foreign-born population - Malaysia (%)
Place of birth for the foreign-born population - Philippines (%)
Place of birth for the foreign-born population - Singapore (%)
Place of birth for the foreign-born population - Thailand (%)
Place of birth for the foreign-born population - Vietnam (%)
Place of birth for the foreign-born population - Other South Eastern Asia (%)
Place of birth for the foreign-born population - Armenia (%)
Place of birth for the foreign-born population - Iraq (%)
Place of birth for the foreign-born population - Israel (%)
Place of birth for the foreign-born population - Jordan (%)
Place of birth for the foreign-born population - Kuwait (%)
Place of birth for the foreign-born population - Lebanon (%)
Place of birth for the foreign-born population - Saudi Arabia (%)
Place of birth for the foreign-born population - Syria (%)
Place of birth for the foreign-born population - Turkey (%)
Place of birth for the foreign-born population - Yemen (%)
Place of birth for the foreign-born population - Other Western Asia (%)
Place of birth for the foreign-born population - Eritrea (%)
Place of birth for the foreign-born population - Ethiopia (%)
Place of birth for the foreign-born population - Kenya (%)
Place of birth for the foreign-born population - Somalia (%)
Place of birth for the foreign-born population - Uganda (%)
Place of birth for the foreign-born population - Zimbabwe (%)
Place of birth for the foreign-born population - Other Eastern Africa (%)
Place of birth for the foreign-born population - Cameroon (%)
Place of birth for the foreign-born population - Congo (%)
Place of birth for the foreign-born population - Democratic Republic of Congo (Zaire) (%)
Place of birth for the foreign-born population - Other Middle Africa (%)
Place of birth for the foreign-born population - Egypt (%)
Place of birth for the foreign-born population - Morocco (%)
Place of birth for the foreign-born population - Sudan (%)
Place of birth for the foreign-born population - Other Northern Africa (%)
Place of birth for the foreign-born population - South Africa (%)
Place of birth for the foreign-born population - Other Southern Africa (%)
Place of birth for the foreign-born population - Cabo Verde (%)
Place of birth for the foreign-born population - Ghana (%)
Place of birth for the foreign-born population - Liberia (%)
Place of birth for the foreign-born population - Nigeria (%)
Place of birth for the foreign-born population - Senegal (%)
Place of birth for the foreign-born population - Sierra Leone (%)
Place of birth for the foreign-born population - Other Western Africa (%)
Place of birth for the foreign-born population - Australia (%)
Place of birth for the foreign-born population - New Zealand (%)
Place of birth for the foreign-born population - Fiji (%)
Place of birth for the foreign-born population - Micronesia (%)
Place of birth for the foreign-born population - Bahamas (%)
Place of birth for the foreign-born population - Barbados (%)
Place of birth for the foreign-born population - Cuba (%)
Place of birth for the foreign-born population - Dominica (%)
Place of birth for the foreign-born population - Dominican Republic (%)
Place of birth for the foreign-born population - Grenada (%)
Place of birth for the foreign-born population - Haiti (%)
Place of birth for the foreign-born population - Jamaica (%)
Place of birth for the foreign-born population - St. Vincent and the Grenadines (%)
Place of birth for the foreign-born population - Trinidad and Tobago (%)
Place of birth for the foreign-born population - West Indies (%)
Place of birth for the foreign-born population - Other Caribbean (%)
Place of birth for the foreign-born population - Belize (%)
Place of birth for the foreign-born population - Costa Rica (%)
Place of birth for the foreign-born population - El Salvador (%)
Place of birth for the foreign-born population - Guatemala (%)
Place of birth for the foreign-born population - Honduras (%)
Place of birth for the foreign-born population - Mexico (%)
Place of birth for the foreign-born population - Nicaragua (%)
Place of birth for the foreign-born population - Panama (%)
Place of birth for the foreign-born population - Other Central America (%)
Place of birth for the foreign-born population - Argentina (%)
Place of birth for the foreign-born population - Bolivia (%)
Place of birth for the foreign-born population - Brazil (%)
Place of birth for the foreign-born population - Chile (%)
Place of birth for the foreign-born population - Colombia (%)
Place of birth for the foreign-born population - Ecuador (%)
Place of birth for the foreign-born population - Guyana (%)
Place of birth for the foreign-born population - Peru (%)
Place of birth for the foreign-born population - Uruguay (%)
Place of birth for the foreign-born population - Venezuela (%)
Place of birth for the foreign-born population - Other South America (%)
Place of birth for the foreign-born population - Canada (%)
Place of birth for the foreign-born population - Other Northern America (%)
Place of birth for the foreign-born population - Other (%)
Latest news about races in Everett, WA collected exclusively by city-data.com from local newspapers, TV, and radio stations
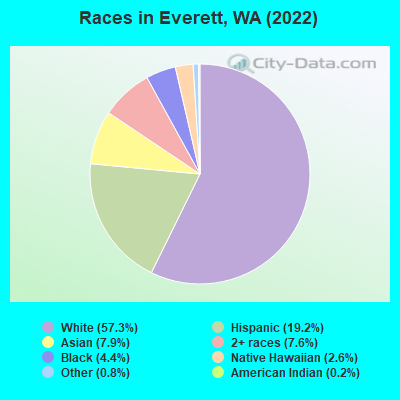
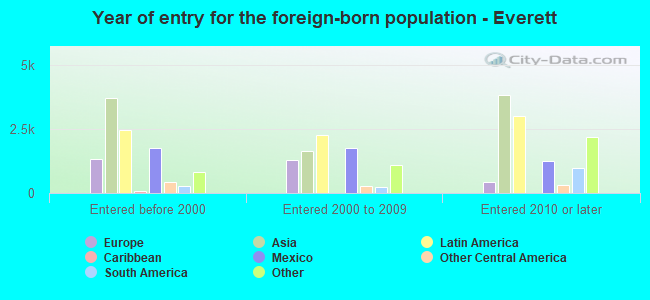
According to 2022 data, the most numerous races in Everett, WA are White alone (63,757 residents), Hispanic (21,350 residents), and Asian alone (8,807 residents). 71.7% of Everett residents speak English at home. 21.3% of Everett, WA residents are foreign-born (7.8% born in Asia, 6.6% born in Latin America, 2.8% born in Europe, 2.7% born in Africa), which is 29.6% greater than the foreign-born rate of 15.0% across the entire state of Washington.
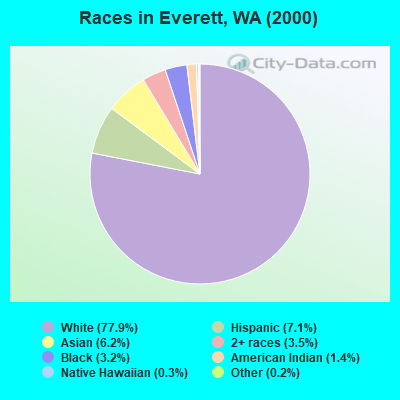
Race distribution in Everett
2000 2022
71,276 77.9% White alone 6,539 7.1% Hispanic 5,710 6.2% Asian alone 3,246 3.5% Two or more races 2,966 3.2% Black alone 1,302 1.4% American Indian alone 299 0.3% Native Hawaiian and Other 150 0.2% Other race alone
63,757 57.3% White alone 21,350 19.2% Hispanic 8,807 7.9% Asian alone 8,516 7.6% Two or more races 4,911 4.4% Black alone 2,944 2.6% Native Hawaiian and Other 857 0.8% Other race alone 206 0.2% American Indian alone
2000 2022
4,652,490 78.9% White alone 441,509 7.5% Hispanic 319,401 5.4% Asian alone 184,631 3.1% Black alone 175,926 3.0% Two or more races 85,396 1.4% American Indian alone 22,779 0.4% Native Hawaiian and Other 11,989 0.2% Other race alone
4,941,456 63.5% White alone 1,093,313 14.0% Hispanic 755,832 9.7% Asian alone 523,448 6.7% Two or more races 299,537 3.8% Black alone 69,024 0.9% American Indian alone 52,231 0.7% Native Hawaiian and Other 50,945 0.7% Other race alone
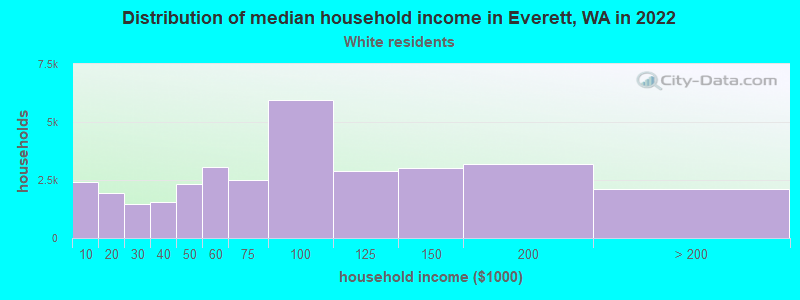
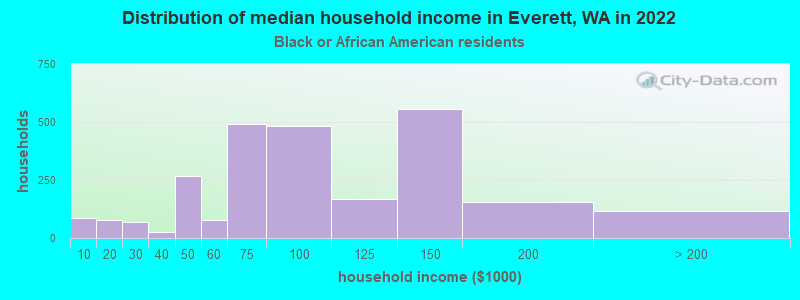
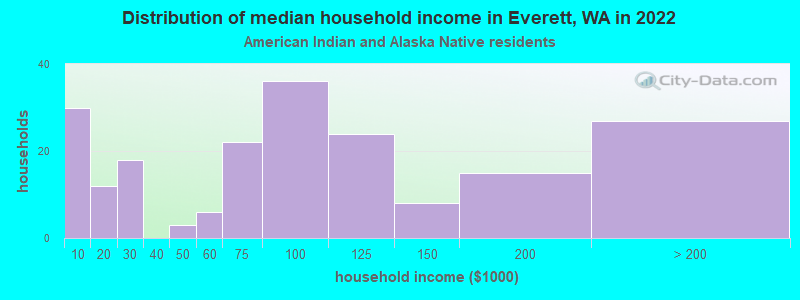
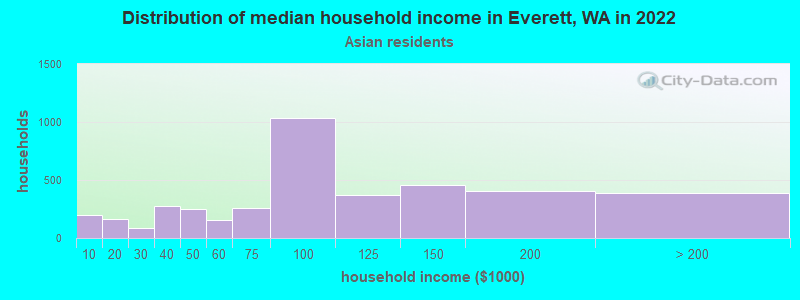
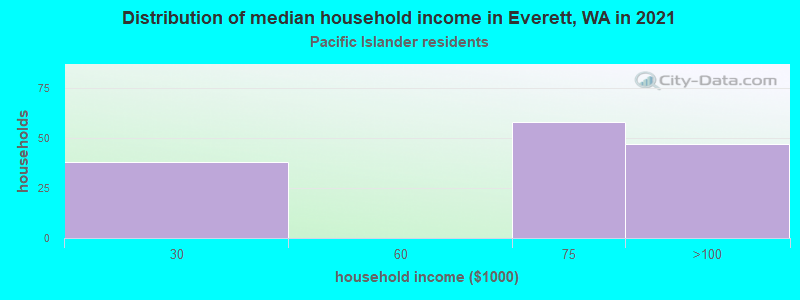
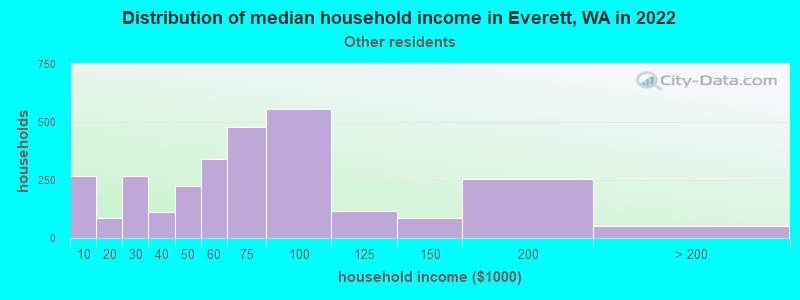
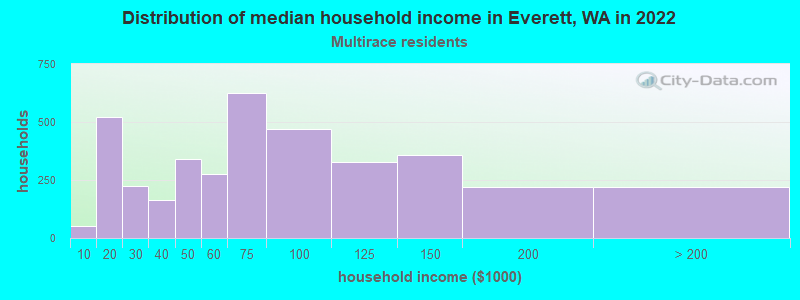
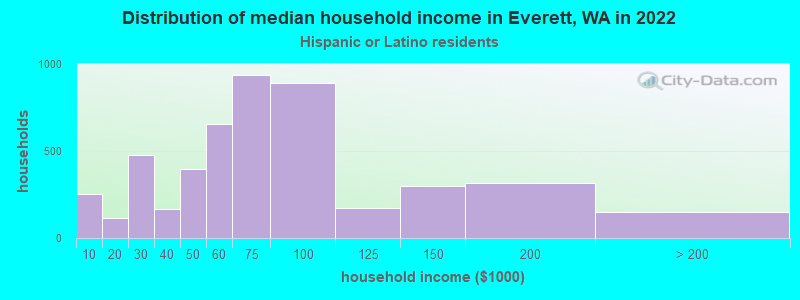
Income and house value in Everett Median household income in 2022 $78,352 White non-Hispanic householders$118,443 Black householders$93,747 American Indian and Alaska Native householders$111,131 Asian householders$78,630 Some other race householders$76,326 Two or more races householders$78,949 Hispanic or Latino race householdersMedian 2022 house value $593,317 White Non-Hispanic householders$674,223 Black or African American householders$498,925 American Indian or Alaska Native householders $640,157 Asian householders$576,638 Native Hawaiian and other Pacific Islander householders$564,218 Some other race householders$653,642 Two or more races householders$605,736 Hispanic or Latino householders
Median age by race in Everett
39.6 Median age for White residents38.5 40.8 37.6 Median age for Black or African American residents41.1 24.0 17.0 Median age for American Indian / Alaska Native residents16.5 21.2 38.2 Median age for Asian residents35.3 41.6 32.5 Median age for Native Hawaiian / Pacific Islander residents32.5 31.0 25.6 Median age for Other race residents27.3 23.8 29.6 Median age for Two or more races residents25.2 31.8 40.1 Median age for White alone residents39.1 41.4 24.9 Median age for Hispanic or Latino residents25.0 23.9
Owner/renter occupied households by race in Everett
House owners and renters - White residents 15,098 46.5% Owner occupied17,389 53.5% Renter occupiedHouse owners and renters - Black or African American residents 583 37.1% Owner occupied988 62.9% Renter occupiedHouse owners and renters - American Indian / Alaska Native residents 48 26.1% Owner occupied137 73.9% Renter occupiedHouse owners and renters - Asian residents 2,348 80.7% Owner occupied560 19.3% Renter occupiedHouse owners and renters - Native Hawaiian / Pacific Islander residents 380 100.0% Renter occupiedHouse owners and renters - Other race residents 963 30.0% Owner occupied2,248 70.0% Renter occupiedHouse owners and renters - Two or more races residents 1,512 36.0% Owner occupied2,688 64.0% Renter occupiedHouse owners and renters - White alone residents 15,048 46.9% Owner occupied17,019 53.1% Renter occupiedHouse owners and renters - Hispanic or Latino residents 1,270 26.8% Owner occupied3,468 73.2% Renter occupied
Language usage in Everett
English speakers - Total 71.7% of residents of Everett speak English at home.
13.8% of residents speak Spanish at home 6,701 47.0% Speak English very well7,564 53.0% Speak English less than very well14.5% of residents speak other language at home 7,731 51.3% Speak English very well7,335 48.7% Speak English less than very well
English speakers - Born in the United States 91.3% of residents of Everett speak English at home.
7.1% of residents speak Spanish at home 2,171 89.4% Speak English very well257 10.6% Speak English less than very well1.5% of residents speak other language at home 333 63.5% Speak English very well191 36.5% Speak English less than very well
English speakers - Native, born elsewhere 41.0% of residents of Everett speak English at home.
15.0% of residents speak Spanish at home 305 100.0% Speak English very well44.1% of residents speak other language at home 850 94.5% Speak English very well49 5.5% Speak English less than very well
English speakers - Foreign-born 12.0% of residents of Everett speak English at home.
36.6% of residents speak Spanish at home 1,362 16.5% Speak English very well6,885 83.5% Speak English less than very well51.3% of residents speak other language at home 4,746 41.1% Speak English very well6,811 58.9% Speak English less than very well
White (Caucasian) - Speak only English Native:
94.1% (55,521)Foreign-born:
11.2% (517)
White (Caucasian) - Speak another language Native:
5.9% (3,482)Foreign-born:
88.8% (4,087)
Black or African American - Speak only English Native:
97.1% (2,146)Foreign-born:
26.2% (597)
Black or African American - Speak another language Native:
2.9% (64)Foreign-born:
73.8% (1,684)
American Indian / Alaska Native - Speak another language Native:
11.3% (89)Foreign-born:
100.0% (58)
Asian - Speak only English Native:
82.5% (1,922)Foreign-born:
10.2% (558)
Asian - Speak another language Native:
17.5% (408)Foreign-born:
89.8% (4,929)
Native Hawaiian / Pacific Islander - Speak only English Native:
24.7% (144)Foreign-born:
17.6% (201)
Native Hawaiian / Pacific Islander - Speak another language Native:
100.0% (582)Foreign-born:
51.8% (594)
Other race - Speak another language Native:
67.9% (4,108)Foreign-born:
100.0% (6,635)
Two or more races - Speak only English Native:
95.1% (8,926)Foreign-born:
11.9% (240)
Two or more races - Speak another language Native:
4.9% (462)Foreign-born:
88.1% (1,772)
White alone - Speak only English Native:
94.6% (54,518)Foreign-born:
11.7% (517)
White alone - Speak another language Native:
5.4% (3,123)Foreign-born:
88.3% (3,892)
Hispanic or Latino - Speak another language Native:
46.0% (4,695)Foreign-born:
100.0% (8,247)
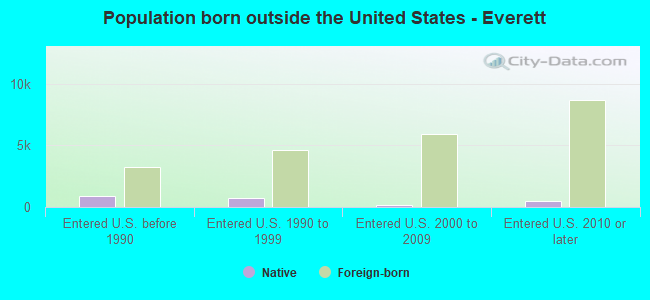
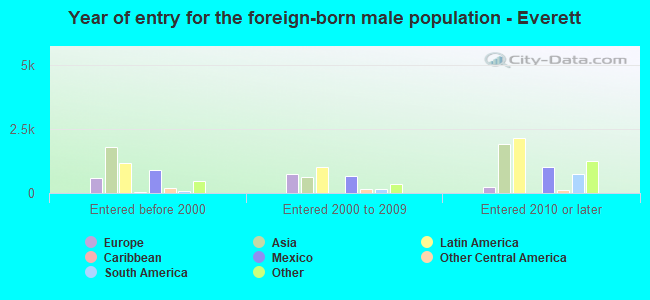
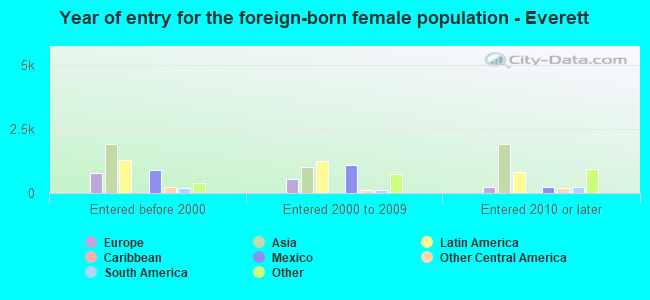
Foreign-born residents in Everett 23,968 residents are foreign born (7.8% Asia , 6.6% Latin America , 2.8% Europe , 2.7% Africa ).
This city:
21.3%Washington:
14.9%
Marital status for residents in Everett Marital status - White (Caucasian) population 15 years and over
Males 43.6% Never married40.4% Now married2.4% Separated3.9% Widowed9.7% DivorcedFemales 33.7% Never married32.1% Now married1.9% Separated7.9% Widowed24.4% DivorcedWomen who gave birth in the past 12 months Now married:
79.2% (565)Unmarried:
20.8% (148)
Women who did not give birth in the past 12 months Now married:
30.4% (4,755)Unmarried:
69.6% (10,876)
Marital status - Black or African American population 15 years and over
Males 38.5% Never married39.0% Now married0.0% Separated2.3% Widowed20.3% DivorcedFemales 54.1% Never married31.8% Now married0.0% Separated3.4% Widowed10.6% DivorcedWomen who gave birth in the past 12 months Now married:
81.5% (76)Unmarried:
18.5% (17)
Women who did not give birth in the past 12 months Now married:
39.8% (724)Unmarried:
60.2% (1,094)
Marital status - American Indian / Alaska Native population 15 years and over
Males 58.3% Never married20.8% Now married4.4% Separated0.3% Widowed16.1% DivorcedFemales 40.7% Never married50.4% Now married0.8% Separated5.9% Widowed2.1% DivorcedWomen who did not give birth in the past 12 months Now married:
43.3% (111)Unmarried:
56.7% (146)
Marital status - Asian population 15 years and over
Males 31.2% Never married57.7% Now married0.0% Separated0.0% Widowed11.2% DivorcedFemales 6.3% Never married74.0% Now married1.3% Separated7.3% Widowed11.2% DivorcedWomen who gave birth in the past 12 months Now married:
100.0% (206)Unmarried:
0.0% (0)
Women who did not give birth in the past 12 months Now married:
47.9% (1,436)Unmarried:
52.1% (1,565)
Marital status - Native Hawaiian / Pacific Islander population 15 years and over
Males 37.4% Never married62.6% Now married0.0% Separated0.0% Widowed0.0% DivorcedFemales 58.2% Never married25.9% Now married3.5% Separated12.3% Widowed0.0% DivorcedWomen who gave birth in the past 12 months Now married:
100.0% (26)Unmarried:
0.0% (0)
Women who did not give birth in the past 12 months Now married:
15.3% (55)Unmarried:
84.7% (304)
Marital status - Other race population 15 years and over
Males 34.9% Never married56.4% Now married0.0% Separated0.0% Widowed8.6% DivorcedFemales 49.4% Never married42.4% Now married3.0% Separated3.8% Widowed1.4% DivorcedWomen who gave birth in the past 12 months Now married:
100.0% (114)Unmarried:
0.0% (0)
Women who did not give birth in the past 12 months Now married:
37.1% (1,203)Unmarried:
62.9% (2,038)
Marital status - Two or more races population 15 years and over
Males 40.1% Never married37.6% Now married1.9% Separated1.2% Widowed19.2% DivorcedFemales 46.4% Never married41.8% Now married2.6% Separated0.0% Widowed9.2% DivorcedWomen who gave birth in the past 12 months Now married:
48.5% (17)Unmarried:
51.5% (19)
Women who did not give birth in the past 12 months Now married:
29.7% (1,033)Unmarried:
70.3% (2,446)
Marital status - White alone, not Hispanic / Latino population 15 years and over
Males 43.5% Never married40.3% Now married2.4% Separated3.9% Widowed9.9% DivorcedFemales 32.6% Never married32.5% Now married1.9% Separated8.1% Widowed24.8% DivorcedWomen who gave birth in the past 12 months Now married:
79.2% (565)Unmarried:
20.8% (148)
Women who did not give birth in the past 12 months Now married:
31.2% (4,698)Unmarried:
68.8% (10,380)
Marital status - Hispanic or Latino population 15 years and over
Males 37.0% Never married50.5% Now married0.0% Separated0.0% Widowed12.6% DivorcedFemales 55.1% Never married38.8% Now married2.1% Separated2.7% Widowed1.3% DivorcedWomen who gave birth in the past 12 months Now married:
98.0% (212)Unmarried:
2.0% (4)
Women who did not give birth in the past 12 months Now married:
33.4% (1,839)Unmarried:
66.6% (3,675)
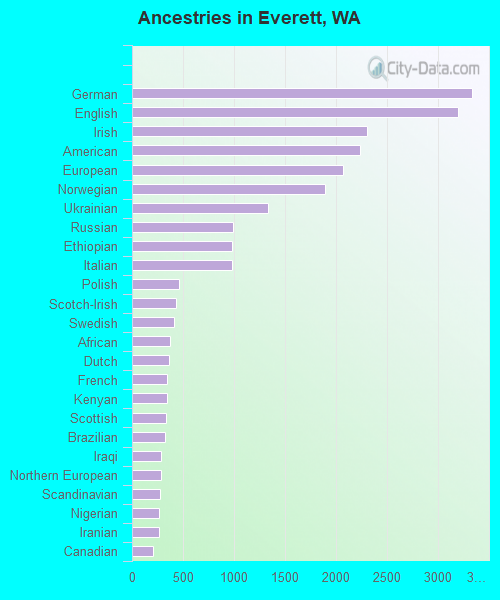
Ancestries in Everett
3,334 6.2% German3,193 5.9% English2,309 4.3% Irish2,240 4.1% American2,068 3.8% European1,889 3.5% Norwegian1,332 2.5% Ukrainian994 1.8% Russian979 1.8% Ethiopian978 1.8% Italian459 0.9% Polish432 0.8% Scotch-Irish415 0.8% Swedish376 0.7% African367 0.7% Dutch341 0.6% French340 0.6% Kenyan332 0.6% Scottish325 0.6% Brazilian286 0.5% Iraqi285 0.5% Northern European270 0.5% Scandinavian262 0.5% Nigerian260 0.5% Iranian202 0.4% Canadian171 0.3% Romanian161 0.3% Danish134 0.2% British122 0.2% Finnish106 0.2% Portuguese84 0.2% Welsh82 0.2% Armenian68 0.1% French Canadian65 0.1% Croatian64 0.1% Palestinian59 0.1% Austrian58 0.1% Arab57 0.1% Moroccan55 0.1% Albanian53 0.10% Slavic49 0.09% Lithuanian45 0.08% Ugandan43 0.08% Jamaican43 0.08% West Indian36 0.07% Sudanese35 0.06% Liberian34 0.06% Czech30 0.06% Greek30 0.06% Eastern European28 0.05% Basque28 0.05% Senegalese26 0.05% Sierra Leonean26 0.05% Swiss24 0.04% Czechoslovakian22 0.04% Bulgarian22 0.04% Haitian21 0.04% Hungarian18 0.03% Yugoslavian14 0.03% Cajun14 0.03% Serbian14 0.03% Egyptian11 0.02% Estonian10 0.02% Australian10 0.02% Turkish9 0.02% Ghanaian8 0.01% Belgian8 0.01% Latvian8 0.01% Icelander4 0.01% Pennsylvania German
Geographical mobility in Everett Same house 1 year ago 55,230 84.8% White (Caucasian)6,654 88.6% Black or African American677 74.4% American Indian / Alaska Native9,207 77.9% Asian1,129 92.9% Native Hawaiian / Pacific Islander9,939 89.1% Other race11,490 86.2% Two or more races53,822 85.0% White alone, not Hispanic / Latino17,409 88.2% Hispanic or LatinoMoved within same county 5,598 8.6% White / Caucasian659 8.8% Black or African American62 6.8% American Indian / Alaska Native1,589 13.4% Asian3 0.2% Native Hawaiian / Pacific Islander477 4.3% Other race965 7.2% Two or more races5,310 8.4% White alone, not Hispanic / Latino1,168 5.9% Hispanic or LatinoMoved within same state 2,688 4.1% White / Caucasian64 0.9% Black or African American111 12.2% American Indian / Alaska Native356 3.0% Asian45 3.7% Native Hawaiian / Pacific Islander340 3.1% Other race376 2.8% Two or more races2,641 4.2% White alone, not Hispanic / Latino501 2.5% Hispanic or LatinoMoved from different state 1,523 2.3% White / Caucasian69 0.9% Black or African American1 0.1% American Indian / Alaska Native233 2.0% Asian115 1.0% Other race247 1.9% Two or more races1,473 2.3% White alone, not Hispanic / Latino249 1.3% Hispanic or LatinoMoved from abroad 60 0.1% White188 2.5% Black or African American33 3.6% American Indian / Alaska Native751 6.4% Asian63 5.2% Native Hawaiian / Pacific Islander201 1.8% Other race11 0.1% Two or more races60 0.1% White alone, not Hispanic / Latino415 2.1% Hispanic or Latino
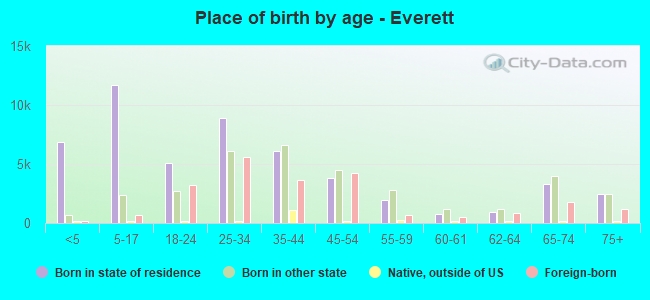
Children Nativity (place of birth) in Everett
Children under 6 years - Living with two parents Both parents native 1,670 100.0% NativeBoth parents foreign-born 2,747 100.0% NativeOne native, one foreign-born parent 1,704 100.0% NativeChildren under 6 years - Living with one parent Native parent 1,754 100.0% NativeForeign-born parent 179 100.0% NativeChildren 6 to 17 years - Living with two parents Both parents native 3,141 100.0% NativeBoth parents foreign-born 1,944 85.6% Native328 14.4% Foreign-bornOne native, one foreign-born parent 1,214 100.0% NativeChildren 6 to 17 years - Living with one parent Native parent 3,785 100.0% NativeForeign-born parent 2,486 52.5% Native2,247 47.5% Foreign-born
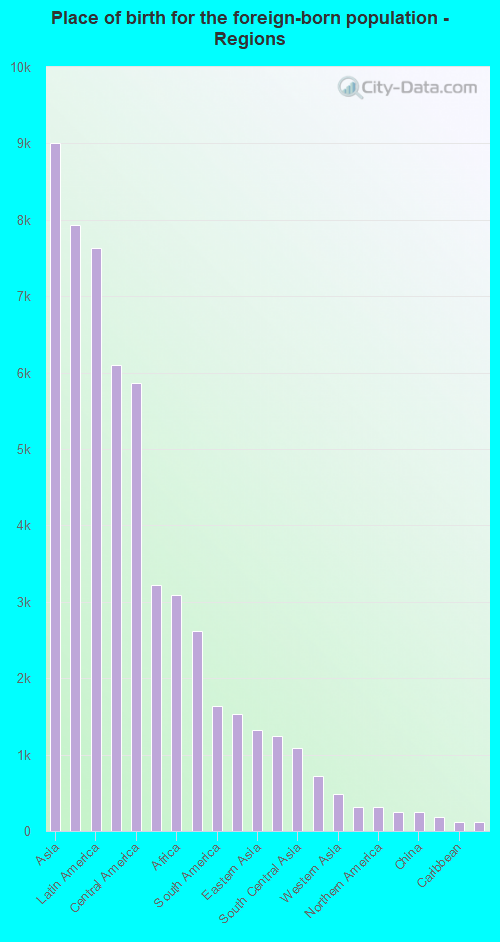
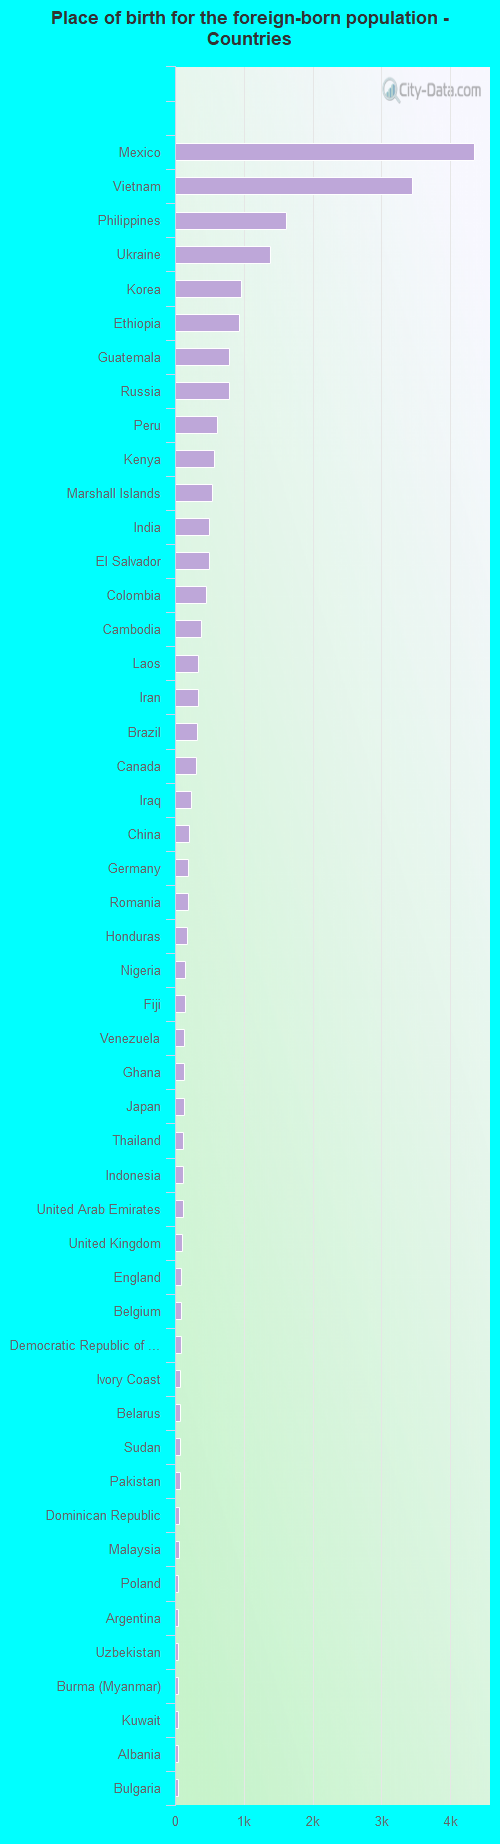
Place of birth for residents in Everett 9,001 Asia7,937 Americas7,628 Latin America6,096 South Eastern Asia5,862 Central America3,215 Europe3,089 Africa2,624 Eastern Europe1,642 South America1,535 Eastern Africa1,328 Eastern Asia1,241 Western Africa1,091 South Central Asia724 Oceania485 Western Asia319 Western Europe308 Northern America255 Northern Europe243 China178 Middle Africa123 Caribbean114 Northern Africa9 Southern Europe4,346 Mexico3,440 Vietnam1,619 Philippines1,382 Ukraine958 Korea927 Ethiopia788 Guatemala787 Russia605 Peru564 Kenya532 Marshall Islands497 India492 El Salvador456 Colombia384 Cambodia330 Laos327 Iran316 Brazil304 Canada239 Iraq201 China188 Germany184 Romania174 Honduras148 Nigeria144 Fiji131 Venezuela126 Ghana126 Japan113 Thailand109 Indonesia109 United Arab Emirates106 United Kingdom86 England86 Belgium83 Democratic Republic of Congo (Zaire)78 Ivory Coast77 Belarus75 Sudan70 Pakistan58 Dominican Republic56 Malaysia49 Poland45 Argentina44 Uzbekistan43 Burma (Myanmar)42 Kuwait40 Albania40 Bulgaria36 Bolivia33 Morocco32 France30 Costa Rica30 Nicaragua28 Bhutan27 Sierra Leone25 Georgia25 Cuba25 Haiti25 Congo24 Senegal23 Hong Kong23 Saudi Arabia23 Norway21 Liberia20 Jordan20 Ireland18 Latvia17 Czechoslovakia17 Taiwan17 Ecuador15 Uganda14 Syria13 Jamaica13 Chile12 Netherlands11 Scotland11 Lithuania10 Eritrea9 Turkey8 Sri Lanka7 Denmark5 Egypt5 Greece4 Spain3 Micronesia2 Somalia
Grandparents responsible for own grandchildren in Everett
Grandparents (30 to 59 years) White / Caucasian 190 54.2% Responsible for grandchildren161 45.8% Not responsible for grandchildrenAsian 16 40.5% Responsible for grandchildren23 59.5% Not responsible for grandchildrenNative Hawaiian / Pacific Islander 37 100.0% Responsible for grandchildrenOther race 13 12.2% Responsible for grandchildren95 87.8% Not responsible for grandchildrenTwo or more races 44 33.7% Responsible for grandchildren86 66.3% Not responsible for grandchildrenWhite alone, not Hispanic / Latino 166 49.4% Responsible for grandchildren170 50.6% Not responsible for grandchildrenHispanic or Latino 101 41.5% Responsible for grandchildren142 58.5% Not responsible for grandchildrenGrandparents (60 years and over) White / Caucasian 125 26.2% Responsible for grandchildren352 73.8% Not responsible for grandchildrenAsian 9 3.6% Responsible for grandchildren233 96.4% Not responsible for grandchildrenNative Hawaiian / Pacific Islander 30 100.0% Responsible for grandchildrenOther race 127 100.0% Not responsible for grandchildrenTwo or more races 23 100.0% Responsible for grandchildrenWhite alone, not Hispanic / Latino 125 32.1% Responsible for grandchildren264 67.9% Not responsible for grandchildrenHispanic or Latino 218 100.0% Not responsible for grandchildren