Races in Ensley, Florida (FL) Detailed Stats
Data:
Races - White alone (%)
Races - White alone (% change since 2000)
Races - Black alone (%)
Races - Black alone (% change since 2000)
Races - American Indian alone (%)
Races - American Indian alone (% change since 2000)
Races - Asian alone (%)
Races - Asian alone (% change since 2000)
Races - Hispanic (%)
Races - Hispanic (% change since 2000)
Races - Native Hawaiian and Other Pacific Islander alone (%)
Races - Native Hawaiian and Other Pacific Islander alone (% change since 2000)
Races - Two or more races(%)
Races - Two or more races(% change since 2000)
Races - Other race alone (%)
Races - Other race alone (% change since 2000)
Racial diversity
Place of birth - Born in state of residence (%)
Place of birth - Born in state of residence (%) - White
Place of birth - Born in state of residence (%) - Black or African American
Place of birth - Born in state of residence (%) - Asian
Place of birth - Born in state of residence (%) - Hispanic or Latino
Place of birth - Born in state of residence (%) - American Indian and Alaska Native
Place of birth - Born in state of residence (%) - Multirace
Place of birth - Born in state of residence (%) - Other Race
Place of birth - Born in other state (%)
Place of birth - Born in other state (%) - White
Place of birth - Born in other state (%) - Black or African American
Place of birth - Born in other state (%) - Asian
Place of birth - Born in other state (%) - Hispanic or Latino
Place of birth - Born in other state (%) - American Indian and Alaska Native
Place of birth - Born in other state (%) - Multirace
Place of birth - Born in other state (%) - Other Race
Place of birth - Native, outside of US (%)
Place of birth - Native, outside of US (%) - White
Place of birth - Native, outside of US (%) - Black or African American
Place of birth - Native, outside of US (%) - Asian
Place of birth - Native, outside of US (%) - Hispanic or Latino
Place of birth - Native, outside of US (%) - American Indian and Alaska Native
Place of birth - Native, outside of US (%) - Multirace
Place of birth - Native, outside of US (%) - Other Race
Place of birth - Foreign born (%)
Place of birth - Foreign born (%) - White
Place of birth - Foreign born (%) - Black or African American
Place of birth - Foreign born (%) - Asian
Place of birth - Foreign born (%) - Hispanic or Latino
Place of birth - Foreign born (%) - American Indian and Alaska Native
Place of birth - Foreign born (%) - Multirace
Place of birth - Foreign born (%) - Other Race
Residents speaking English at home (%)
Residents speaking English at home - Born in the United States (%)
Residents speaking English at home - Native, born elsewhere (%)
Residents speaking English at home - Foreign born (%)
Residents speaking Spanish at home (%)
Residents speaking Spanish at home - Born in the United States (%)
Residents speaking Spanish at home - Native, born elsewhere (%)
Residents speaking Spanish at home - Foreign born (%)
Residents speaking other language at home (%)
Residents speaking other language at home - Born in the United States (%)
Residents speaking other language at home - Native, born elsewhere (%)
Residents speaking other language at home - Foreign born (%)
Marital status - Never married (%)
Marital status - Now married (%)
Marital status - Separated (%)
Marital status - Widowed (%)
Marital status - Divorced (%)
Ancestries Reported - Arab (%)
Ancestries Reported - Czech (%)
Ancestries Reported - Danish (%)
Ancestries Reported - Dutch (%)
Ancestries Reported - English (%)
Ancestries Reported - French (%)
Ancestries Reported - French Canadian (%)
Ancestries Reported - German (%)
Ancestries Reported - Greek (%)
Ancestries Reported - Hungarian (%)
Ancestries Reported - Irish (%)
Ancestries Reported - Italian (%)
Ancestries Reported - Lithuanian (%)
Ancestries Reported - Norwegian (%)
Ancestries Reported - Polish (%)
Ancestries Reported - Portuguese (%)
Ancestries Reported - Russian (%)
Ancestries Reported - Scotch-Irish (%)
Ancestries Reported - Scottish (%)
Ancestries Reported - Slovak (%)
Ancestries Reported - Subsaharan African (%)
Ancestries Reported - Swedish (%)
Ancestries Reported - Swiss (%)
Ancestries Reported - Ukrainian (%)
Ancestries Reported - United States (%)
Ancestries Reported - Welsh (%)
Ancestries Reported - West Indian (%)
Ancestries Reported - Other (%)
Geographical mobility - Same house 1 year ago (%)
Geographical mobility - Same house 1 year ago (%) - White
Geographical mobility - Same house 1 year ago (%) - Black or African American
Geographical mobility - Same house 1 year ago (%) - Asian
Geographical mobility - Same house 1 year ago (%) - Hispanic or Latino
Geographical mobility - Same house 1 year ago (%) - American Indian and Alaska Native
Geographical mobility - Same house 1 year ago (%) - Multirace
Geographical mobility - Same house 1 year ago (%) - Other Race
Geographical mobility - Moved within same county (%)
Geographical mobility - Moved within same county (%) - White
Geographical mobility - Moved within same county (%) - Black or African American
Geographical mobility - Moved within same county (%) - Asian
Geographical mobility - Moved within same county (%) - Hispanic or Latino
Geographical mobility - Moved within same county (%) - American Indian and Alaska Native
Geographical mobility - Moved within same county (%) - Multirace
Geographical mobility - Moved within same county (%) - Other Race
Geographical mobility - Moved from different county within same state (%)
Geographical mobility - Moved from different county within same state (%) - White
Geographical mobility - Moved from different county within same state (%) - Black or African American
Geographical mobility - Moved from different county within same state (%) - Asian
Geographical mobility - Moved from different county within same state (%) - Hispanic or Latino
Geographical mobility - Moved from different county within same state (%) - American Indian and Alaska Native
Geographical mobility - Moved from different county within same state (%) - Multirace
Geographical mobility - Moved from different county within same state (%) - Other Race
Geographical mobility - Moved from different state (%)
Geographical mobility - Moved from different state (%) - White
Geographical mobility - Moved from different state (%) - Black or African American
Geographical mobility - Moved from different state (%) - Asian
Geographical mobility - Moved from different state (%) - Hispanic or Latino
Geographical mobility - Moved from different state (%) - American Indian and Alaska Native
Geographical mobility - Moved from different state (%) - Multirace
Geographical mobility - Moved from different state (%) - Other Race
Geographical mobility - Moved from abroad (%)
Geographical mobility - Moved from abroad (%) - White
Geographical mobility - Moved from abroad (%) - Black or African American
Geographical mobility - Moved from abroad (%) - Asian
Geographical mobility - Moved from abroad (%) - Hispanic or Latino
Geographical mobility - Moved from abroad (%) - American Indian and Alaska Native
Geographical mobility - Moved from abroad (%) - Multirace
Geographical mobility - Moved from abroad (%) - Other Race
Place of birth for the foreign-born population - Ireland (%)
Place of birth for the foreign-born population - Denmark (%)
Place of birth for the foreign-born population - Norway (%)
Place of birth for the foreign-born population - Sweden (%)
Place of birth for the foreign-born population - United Kingdom (%)
Place of birth for the foreign-born population - England (%)
Place of birth for the foreign-born population - Scotland (%)
Place of birth for the foreign-born population - Other Northern Europe (%)
Place of birth for the foreign-born population - Austria (%)
Place of birth for the foreign-born population - Belgium (%)
Place of birth for the foreign-born population - France (%)
Place of birth for the foreign-born population - Germany (%)
Place of birth for the foreign-born population - Netherlands (%)
Place of birth for the foreign-born population - Switzerland (%)
Place of birth for the foreign-born population - Other Western Europe (%)
Place of birth for the foreign-born population - Greece (%)
Place of birth for the foreign-born population - Italy (%)
Place of birth for the foreign-born population - Portugal (%)
Place of birth for the foreign-born population - Spain (%)
Place of birth for the foreign-born population - Other Southern Europe (%)
Place of birth for the foreign-born population - Albania (%)
Place of birth for the foreign-born population - Belarus (%)
Place of birth for the foreign-born population - Bosnia and Herzegovina (%)
Place of birth for the foreign-born population - Bulgaria (%)
Place of birth for the foreign-born population - Croatia (%)
Place of birth for the foreign-born population - Czechoslovakia (%)
Place of birth for the foreign-born population - Hungary (%)
Place of birth for the foreign-born population - Latvia (%)
Place of birth for the foreign-born population - Lithuania (%)
Place of birth for the foreign-born population - North Macedonia (Macedonia) (%)
Place of birth for the foreign-born population - Moldova (%)
Place of birth for the foreign-born population - Poland (%)
Place of birth for the foreign-born population - Romania (%)
Place of birth for the foreign-born population - Russia (%)
Place of birth for the foreign-born population - Serbia (%)
Place of birth for the foreign-born population - Ukraine (%)
Place of birth for the foreign-born population - Other Eastern Europe (%)
Place of birth for the foreign-born population - China (%)
Place of birth for the foreign-born population - Hong Kong (%)
Place of birth for the foreign-born population - Taiwan (%)
Place of birth for the foreign-born population - Japan (%)
Place of birth for the foreign-born population - Korea (%)
Place of birth for the foreign-born population - Other Eastern Asia (%)
Place of birth for the foreign-born population - Afghanistan (%)
Place of birth for the foreign-born population - Bangladesh (%)
Place of birth for the foreign-born population - India (%)
Place of birth for the foreign-born population - Iran (%)
Place of birth for the foreign-born population - Kazakhstan (%)
Place of birth for the foreign-born population - Nepal (%)
Place of birth for the foreign-born population - Pakistan (%)
Place of birth for the foreign-born population - Sri Lanka (%)
Place of birth for the foreign-born population - Uzbekistan (%)
Place of birth for the foreign-born population - Other South Central Asia (%)
Place of birth for the foreign-born population - Burma (%)
Place of birth for the foreign-born population - Cambodia (%)
Place of birth for the foreign-born population - Indonesia (%)
Place of birth for the foreign-born population - Laos (%)
Place of birth for the foreign-born population - Malaysia (%)
Place of birth for the foreign-born population - Philippines (%)
Place of birth for the foreign-born population - Singapore (%)
Place of birth for the foreign-born population - Thailand (%)
Place of birth for the foreign-born population - Vietnam (%)
Place of birth for the foreign-born population - Other South Eastern Asia (%)
Place of birth for the foreign-born population - Armenia (%)
Place of birth for the foreign-born population - Iraq (%)
Place of birth for the foreign-born population - Israel (%)
Place of birth for the foreign-born population - Jordan (%)
Place of birth for the foreign-born population - Kuwait (%)
Place of birth for the foreign-born population - Lebanon (%)
Place of birth for the foreign-born population - Saudi Arabia (%)
Place of birth for the foreign-born population - Syria (%)
Place of birth for the foreign-born population - Turkey (%)
Place of birth for the foreign-born population - Yemen (%)
Place of birth for the foreign-born population - Other Western Asia (%)
Place of birth for the foreign-born population - Eritrea (%)
Place of birth for the foreign-born population - Ethiopia (%)
Place of birth for the foreign-born population - Kenya (%)
Place of birth for the foreign-born population - Somalia (%)
Place of birth for the foreign-born population - Uganda (%)
Place of birth for the foreign-born population - Zimbabwe (%)
Place of birth for the foreign-born population - Other Eastern Africa (%)
Place of birth for the foreign-born population - Cameroon (%)
Place of birth for the foreign-born population - Congo (%)
Place of birth for the foreign-born population - Democratic Republic of Congo (Zaire) (%)
Place of birth for the foreign-born population - Other Middle Africa (%)
Place of birth for the foreign-born population - Egypt (%)
Place of birth for the foreign-born population - Morocco (%)
Place of birth for the foreign-born population - Sudan (%)
Place of birth for the foreign-born population - Other Northern Africa (%)
Place of birth for the foreign-born population - South Africa (%)
Place of birth for the foreign-born population - Other Southern Africa (%)
Place of birth for the foreign-born population - Cabo Verde (%)
Place of birth for the foreign-born population - Ghana (%)
Place of birth for the foreign-born population - Liberia (%)
Place of birth for the foreign-born population - Nigeria (%)
Place of birth for the foreign-born population - Senegal (%)
Place of birth for the foreign-born population - Sierra Leone (%)
Place of birth for the foreign-born population - Other Western Africa (%)
Place of birth for the foreign-born population - Australia (%)
Place of birth for the foreign-born population - New Zealand (%)
Place of birth for the foreign-born population - Fiji (%)
Place of birth for the foreign-born population - Micronesia (%)
Place of birth for the foreign-born population - Bahamas (%)
Place of birth for the foreign-born population - Barbados (%)
Place of birth for the foreign-born population - Cuba (%)
Place of birth for the foreign-born population - Dominica (%)
Place of birth for the foreign-born population - Dominican Republic (%)
Place of birth for the foreign-born population - Grenada (%)
Place of birth for the foreign-born population - Haiti (%)
Place of birth for the foreign-born population - Jamaica (%)
Place of birth for the foreign-born population - St. Vincent and the Grenadines (%)
Place of birth for the foreign-born population - Trinidad and Tobago (%)
Place of birth for the foreign-born population - West Indies (%)
Place of birth for the foreign-born population - Other Caribbean (%)
Place of birth for the foreign-born population - Belize (%)
Place of birth for the foreign-born population - Costa Rica (%)
Place of birth for the foreign-born population - El Salvador (%)
Place of birth for the foreign-born population - Guatemala (%)
Place of birth for the foreign-born population - Honduras (%)
Place of birth for the foreign-born population - Mexico (%)
Place of birth for the foreign-born population - Nicaragua (%)
Place of birth for the foreign-born population - Panama (%)
Place of birth for the foreign-born population - Other Central America (%)
Place of birth for the foreign-born population - Argentina (%)
Place of birth for the foreign-born population - Bolivia (%)
Place of birth for the foreign-born population - Brazil (%)
Place of birth for the foreign-born population - Chile (%)
Place of birth for the foreign-born population - Colombia (%)
Place of birth for the foreign-born population - Ecuador (%)
Place of birth for the foreign-born population - Guyana (%)
Place of birth for the foreign-born population - Peru (%)
Place of birth for the foreign-born population - Uruguay (%)
Place of birth for the foreign-born population - Venezuela (%)
Place of birth for the foreign-born population - Other South America (%)
Place of birth for the foreign-born population - Canada (%)
Place of birth for the foreign-born population - Other Northern America (%)
Place of birth for the foreign-born population - Other (%)
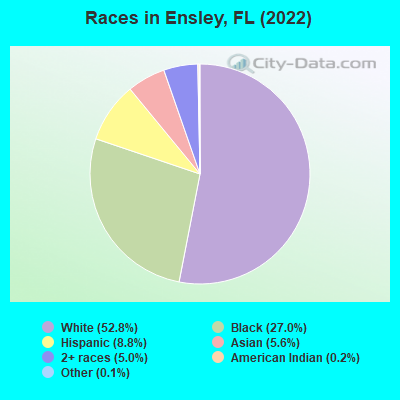
According to 2022 data, the most numerous races in Ensley, FL are White alone (11,820 residents), Hispanic (1,968 residents), and Black alone (6,037 residents). 86.7% of Ensley residents speak English at home. 11.2% of Ensley, FL residents are foreign-born (6.0% born in Asia, 3.2% born in Latin America), which is 87.7% less than the foreign-born rate of 21.0% across the entire state of Florida.
Race distribution in Ensley
2000 2022
10,458,509 65.4% White alone 2,682,715 16.8% Hispanic 2,264,268 14.2% Black alone 261,693 1.6% Asian alone 236,954 1.5% Two or more races 42,358 0.3% American Indian alone 28,994 0.2% Other race alone 6,887 0.04% Native Hawaiian and Other
11,309,403 50.8% White alone 6,025,039 27.1% Hispanic 3,241,015 14.6% Black alone 861,630 3.9% Two or more races 623,692 2.8% Asian alone 152,054 0.7% Other race alone 22,504 0.1% American Indian alone 9,486 0.04% Native Hawaiian and Other
Income and house value in Ensley Median household income in 2022 $62,412 White non-Hispanic householders$49,749 Black householders$43,344 American Indian and Alaska Native householders$127,860 Asian householders$88,055 Some other race householders$43,741 Two or more races householders$65,078 Hispanic or Latino race householdersMedian 2022 house value $234,637 White Non-Hispanic householders$172,964 Black or African American householders$166,797 American Indian or Alaska Native householders $186,420 Asian householders$166,797 Two or more races householders$227,909 Hispanic or Latino householders
Median age by race in Ensley
44.8 Median age for White residents41.7 46.6 32.2 Median age for Black or African American residents29.7 35.5 49.3 Median age for American Indian / Alaska Native residents-624,999,999.4 80.3 41.1 Median age for Asian residents48.4 42.6 -679,849,340.2 Median age for Native Hawaiian / Pacific Islander residents-858,307,848.3 -443,298,968.6 37.1 Median age for Other race residents41.1 31.7 28.8 Median age for Two or more races residents30.8 28.6 44.6 Median age for White alone residents41.7 48.4 28.4 Median age for Hispanic or Latino residents32.2 25.8
Owner/renter occupied households by race in Ensley
House owners and renters - White residents 4,013 68.0% Owner occupied1,887 32.0% Renter occupiedHouse owners and renters - Black or African American residents 1,228 41.7% Owner occupied1,714 58.3% Renter occupiedHouse owners and renters - American Indian / Alaska Native residents 23 52.4% Owner occupied21 47.6% Renter occupiedHouse owners and renters - Asian residents 220 56.1% Owner occupied172 43.9% Renter occupiedHouse owners and renters - Other race residents 154 63.1% Owner occupied90 36.9% Renter occupiedHouse owners and renters - Two or more races residents 303 32.0% Owner occupied645 68.0% Renter occupiedHouse owners and renters - White alone residents 3,905 67.3% Owner occupied1,895 32.7% Renter occupiedHouse owners and renters - Hispanic or Latino residents 424 67.2% Owner occupied207 32.8% Renter occupied
Language usage in Ensley
English speakers - Total 86.7% of residents of Ensley speak English at home.
5.4% of residents speak Spanish at home 619 53.1% Speak English very well547 46.9% Speak English less than very well6.3% of residents speak other language at home 602 44.5% Speak English very well751 55.5% Speak English less than very well
English speakers - Born in the United States 98.0% of residents of Ensley speak English at home.
1.6% of residents speak Spanish at home 108 83.1% Speak English very well22 16.9% Speak English less than very well0.3% of residents speak other language at home 9 39.1% Speak English very well14 60.9% Speak English less than very well
English speakers - Native, born elsewhere 87.8% of residents of Ensley speak English at home.
4.0% of residents speak Spanish at home 16 100.0% Speak English less than very well3.7% of residents speak other language at home 15 100.0% Speak English very well
English speakers - Foreign-born 11.6% of residents of Ensley speak English at home.
25.4% of residents speak Spanish at home 146 23.7% Speak English very well470 76.3% Speak English less than very well51.9% of residents speak other language at home 457 36.3% Speak English very well802 63.7% Speak English less than very well
White (Caucasian) - Speak only English Native:
98.0% (10,975)Foreign-born:
40.3% (223)
White (Caucasian) - Speak another language Native:
1.9% (213)Foreign-born:
59.6% (330)
Black or African American - Speak only English Native:
96.1% (5,497)Foreign-born:
90.4% (16)
Asian - Speak only English Native:
98.0% (122)Foreign-born:
2.0% (22)
Other race - Speak another language Native:
36.5% (149)Foreign-born:
100.0% (183)
Two or more races - Speak only English Native:
93.8% (1,413)Foreign-born:
3.3% (11)
Two or more races - Speak another language Native:
6.3% (94)Foreign-born:
85.4% (285)
White alone - Speak only English Native:
98.7% (10,898)Foreign-born:
55.6% (227)
White alone - Speak another language Native:
1.2% (132)Foreign-born:
42.0% (171)
Hispanic or Latino - Speak another language Native:
26.2% (295)Foreign-born:
100.0% (687)
Foreign-born residents in Ensley 2,505 residents are foreign born (6.0% Asia , 3.2% Latin America ).
This city:
11.2%Florida:
21.1%
Marital status for residents in Ensley Marital status - White (Caucasian) population 15 years and over
Males 26.6% Never married46.5% Now married4.4% Separated3.4% Widowed19.1% DivorcedFemales 24.8% Never married45.7% Now married1.1% Separated10.9% Widowed17.4% DivorcedWomen who gave birth in the past 12 months Now married:
59.1% (94)Unmarried:
40.9% (65)
Women who did not give birth in the past 12 months Now married:
35.0% (731)Unmarried:
65.0% (1,356)
Marital status - Black or African American population 15 years and over
Males 56.0% Never married30.6% Now married6.0% Separated0.5% Widowed6.8% DivorcedFemales 53.7% Never married22.3% Now married3.2% Separated7.3% Widowed13.5% DivorcedWomen who gave birth in the past 12 months Now married:
0.0% (0)Unmarried:
100.0% (8)
Women who did not give birth in the past 12 months Now married:
17.6% (299)Unmarried:
82.4% (1,403)
Marital status - American Indian / Alaska Native population 15 years and over
Males 0.0% Never married0.0% Now married0.0% Separated0.0% Widowed100.0% DivorcedFemales 0.0% Never married58.6% Now married0.0% Separated0.0% Widowed41.4% DivorcedMarital status - Asian population 15 years and over
Males 26.5% Never married70.4% Now married0.0% Separated0.0% Widowed3.1% DivorcedFemales 31.0% Never married60.1% Now married0.0% Separated0.0% Widowed8.9% DivorcedWomen who did not give birth in the past 12 months Now married:
29.7% (81)Unmarried:
70.3% (191)
Marital status - Other race population 15 years and over
Males 27.8% Never married60.3% Now married0.0% Separated0.0% Widowed11.8% DivorcedFemales 26.4% Never married73.6% Now married0.0% Separated0.0% Widowed0.0% DivorcedWomen who did not give birth in the past 12 months Now married:
85.5% (85)Unmarried:
14.5% (14)
Marital status - Two or more races population 15 years and over
Males 50.7% Never married44.3% Now married3.1% Separated0.0% Widowed1.9% DivorcedFemales 26.2% Never married33.6% Now married1.7% Separated17.2% Widowed21.4% DivorcedWomen who gave birth in the past 12 months Now married:
83.1% (65)Unmarried:
16.9% (13)
Women who did not give birth in the past 12 months Now married:
33.6% (199)Unmarried:
66.4% (394)
Marital status - White alone, not Hispanic / Latino population 15 years and over
Males 26.9% Never married46.2% Now married4.5% Separated3.5% Widowed18.8% DivorcedFemales 25.2% Never married45.4% Now married1.2% Separated11.4% Widowed16.9% DivorcedWomen who gave birth in the past 12 months Now married:
59.1% (97)Unmarried:
40.9% (67)
Women who did not give birth in the past 12 months Now married:
34.1% (686)Unmarried:
65.9% (1,324)
Marital status - Hispanic or Latino population 15 years and over
Males 26.7% Never married59.9% Now married0.0% Separated0.0% Widowed13.4% DivorcedFemales 16.0% Never married56.0% Now married0.0% Separated3.4% Widowed24.7% DivorcedWomen who gave birth in the past 12 months Now married:
0.0% (0)Unmarried:
100.0% (10)
Women who did not give birth in the past 12 months Now married:
65.7% (216)Unmarried:
34.3% (113)
Ancestries in Ensley
1,333 11.3% English734 6.2% American557 4.7% German519 4.4% Irish269 2.3% European204 1.7% Arab142 1.2% African116 1.0% Italian85 0.7% Russian84 0.7% Scottish81 0.7% Polish70 0.6% French64 0.5% Canadian55 0.5% Syrian52 0.4% Jamaican30 0.3% Hungarian19 0.2% Dutch17 0.1% Welsh15 0.1% Northern European14 0.1% Slovak13 0.1% Eastern European13 0.1% French Canadian12 0.1% British8 0.07% Czechoslovakian6 0.05% Scotch-Irish
Geographical mobility in Ensley Same house 1 year ago 10,574 87.1% White (Caucasian)4,997 83.2% Black or African American70 100.0% American Indian / Alaska Native786 60.8% Asian549 86.2% Other race1,436 73.4% Two or more races10,345 87.8% White alone, not Hispanic / Latino1,485 77.4% Hispanic or LatinoMoved within same county 755 6.2% White / Caucasian652 10.9% Black or African American182 14.1% Asian110 17.2% Other race68 3.5% Two or more races753 6.4% White alone, not Hispanic / Latino60 3.1% Hispanic or LatinoMoved within same state 155 1.3% White / Caucasian158 2.6% Black or African American94 4.8% Two or more races160 1.4% White alone, not Hispanic / Latino14 0.7% Hispanic or LatinoMoved from different state 621 5.1% White / Caucasian117 1.9% Black or African American417 32.3% Asian11 1.7% Other race280 14.3% Two or more races560 4.8% White alone, not Hispanic / Latino382 19.9% Hispanic or LatinoMoved from abroad 55 0.5% White20 0.2% White alone, not Hispanic / Latino137 7.1% Hispanic or Latino
Children Nativity (place of birth) in Ensley
Children under 6 years - Living with two parents Both parents native 400 100.0% NativeBoth parents foreign-born 12 100.0% NativeOne native, one foreign-born parent 9 100.0% NativeChildren under 6 years - Living with one parent Native parent 585 100.0% NativeForeign-born parent 24 100.0% NativeChildren 6 to 17 years - Living with two parents Both parents native 796 99.5% Native4 0.5% Foreign-bornBoth parents foreign-born 87 19.1% Native368 80.9% Foreign-bornOne native, one foreign-born parent 92 100.0% NativeChildren 6 to 17 years - Living with one parent Native parent 1,517 97.4% Native40 2.6% Foreign-bornForeign-born parent 38 100.0% Native
Grandparents responsible for own grandchildren in Ensley
Grandparents (30 to 59 years) White / Caucasian 88 92.1% Responsible for grandchildren8 7.9% Not responsible for grandchildrenBlack or African American 39 100.0% Responsible for grandchildrenOther race 99 100.0% Not responsible for grandchildrenTwo or more races 102 100.0% Not responsible for grandchildrenWhite alone, not Hispanic / Latino 89 92.2% Responsible for grandchildren8 7.8% Not responsible for grandchildrenHispanic or Latino 73 100.0% Not responsible for grandchildrenGrandparents (60 years and over) White / Caucasian 82 91.2% Responsible for grandchildren8 8.8% Not responsible for grandchildrenBlack or African American 65 100.0% Not responsible for grandchildrenTwo or more races 67 100.0% Not responsible for grandchildrenWhite alone, not Hispanic / Latino 85 91.5% Responsible for grandchildren8 8.5% Not responsible for grandchildren