Races in Englewood, New Jersey (NJ) Detailed Stats
Data:
Races - White alone (%)
Races - White alone (% change since 2000)
Races - Black alone (%)
Races - Black alone (% change since 2000)
Races - American Indian alone (%)
Races - American Indian alone (% change since 2000)
Races - Asian alone (%)
Races - Asian alone (% change since 2000)
Races - Hispanic (%)
Races - Hispanic (% change since 2000)
Races - Native Hawaiian and Other Pacific Islander alone (%)
Races - Native Hawaiian and Other Pacific Islander alone (% change since 2000)
Races - Two or more races(%)
Races - Two or more races(% change since 2000)
Races - Other race alone (%)
Races - Other race alone (% change since 2000)
Racial diversity
Place of birth - Born in state of residence (%)
Place of birth - Born in state of residence (%) - White
Place of birth - Born in state of residence (%) - Black or African American
Place of birth - Born in state of residence (%) - Asian
Place of birth - Born in state of residence (%) - Hispanic or Latino
Place of birth - Born in state of residence (%) - American Indian and Alaska Native
Place of birth - Born in state of residence (%) - Multirace
Place of birth - Born in state of residence (%) - Other Race
Place of birth - Born in other state (%)
Place of birth - Born in other state (%) - White
Place of birth - Born in other state (%) - Black or African American
Place of birth - Born in other state (%) - Asian
Place of birth - Born in other state (%) - Hispanic or Latino
Place of birth - Born in other state (%) - American Indian and Alaska Native
Place of birth - Born in other state (%) - Multirace
Place of birth - Born in other state (%) - Other Race
Place of birth - Native, outside of US (%)
Place of birth - Native, outside of US (%) - White
Place of birth - Native, outside of US (%) - Black or African American
Place of birth - Native, outside of US (%) - Asian
Place of birth - Native, outside of US (%) - Hispanic or Latino
Place of birth - Native, outside of US (%) - American Indian and Alaska Native
Place of birth - Native, outside of US (%) - Multirace
Place of birth - Native, outside of US (%) - Other Race
Place of birth - Foreign born (%)
Place of birth - Foreign born (%) - White
Place of birth - Foreign born (%) - Black or African American
Place of birth - Foreign born (%) - Asian
Place of birth - Foreign born (%) - Hispanic or Latino
Place of birth - Foreign born (%) - American Indian and Alaska Native
Place of birth - Foreign born (%) - Multirace
Place of birth - Foreign born (%) - Other Race
Residents speaking English at home (%)
Residents speaking English at home - Born in the United States (%)
Residents speaking English at home - Native, born elsewhere (%)
Residents speaking English at home - Foreign born (%)
Residents speaking Spanish at home (%)
Residents speaking Spanish at home - Born in the United States (%)
Residents speaking Spanish at home - Native, born elsewhere (%)
Residents speaking Spanish at home - Foreign born (%)
Residents speaking other language at home (%)
Residents speaking other language at home - Born in the United States (%)
Residents speaking other language at home - Native, born elsewhere (%)
Residents speaking other language at home - Foreign born (%)
Marital status - Never married (%)
Marital status - Now married (%)
Marital status - Separated (%)
Marital status - Widowed (%)
Marital status - Divorced (%)
Ancestries Reported - Arab (%)
Ancestries Reported - Czech (%)
Ancestries Reported - Danish (%)
Ancestries Reported - Dutch (%)
Ancestries Reported - English (%)
Ancestries Reported - French (%)
Ancestries Reported - French Canadian (%)
Ancestries Reported - German (%)
Ancestries Reported - Greek (%)
Ancestries Reported - Hungarian (%)
Ancestries Reported - Irish (%)
Ancestries Reported - Italian (%)
Ancestries Reported - Lithuanian (%)
Ancestries Reported - Norwegian (%)
Ancestries Reported - Polish (%)
Ancestries Reported - Portuguese (%)
Ancestries Reported - Russian (%)
Ancestries Reported - Scotch-Irish (%)
Ancestries Reported - Scottish (%)
Ancestries Reported - Slovak (%)
Ancestries Reported - Subsaharan African (%)
Ancestries Reported - Swedish (%)
Ancestries Reported - Swiss (%)
Ancestries Reported - Ukrainian (%)
Ancestries Reported - United States (%)
Ancestries Reported - Welsh (%)
Ancestries Reported - West Indian (%)
Ancestries Reported - Other (%)
Geographical mobility - Same house 1 year ago (%)
Geographical mobility - Same house 1 year ago (%) - White
Geographical mobility - Same house 1 year ago (%) - Black or African American
Geographical mobility - Same house 1 year ago (%) - Asian
Geographical mobility - Same house 1 year ago (%) - Hispanic or Latino
Geographical mobility - Same house 1 year ago (%) - American Indian and Alaska Native
Geographical mobility - Same house 1 year ago (%) - Multirace
Geographical mobility - Same house 1 year ago (%) - Other Race
Geographical mobility - Moved within same county (%)
Geographical mobility - Moved within same county (%) - White
Geographical mobility - Moved within same county (%) - Black or African American
Geographical mobility - Moved within same county (%) - Asian
Geographical mobility - Moved within same county (%) - Hispanic or Latino
Geographical mobility - Moved within same county (%) - American Indian and Alaska Native
Geographical mobility - Moved within same county (%) - Multirace
Geographical mobility - Moved within same county (%) - Other Race
Geographical mobility - Moved from different county within same state (%)
Geographical mobility - Moved from different county within same state (%) - White
Geographical mobility - Moved from different county within same state (%) - Black or African American
Geographical mobility - Moved from different county within same state (%) - Asian
Geographical mobility - Moved from different county within same state (%) - Hispanic or Latino
Geographical mobility - Moved from different county within same state (%) - American Indian and Alaska Native
Geographical mobility - Moved from different county within same state (%) - Multirace
Geographical mobility - Moved from different county within same state (%) - Other Race
Geographical mobility - Moved from different state (%)
Geographical mobility - Moved from different state (%) - White
Geographical mobility - Moved from different state (%) - Black or African American
Geographical mobility - Moved from different state (%) - Asian
Geographical mobility - Moved from different state (%) - Hispanic or Latino
Geographical mobility - Moved from different state (%) - American Indian and Alaska Native
Geographical mobility - Moved from different state (%) - Multirace
Geographical mobility - Moved from different state (%) - Other Race
Geographical mobility - Moved from abroad (%)
Geographical mobility - Moved from abroad (%) - White
Geographical mobility - Moved from abroad (%) - Black or African American
Geographical mobility - Moved from abroad (%) - Asian
Geographical mobility - Moved from abroad (%) - Hispanic or Latino
Geographical mobility - Moved from abroad (%) - American Indian and Alaska Native
Geographical mobility - Moved from abroad (%) - Multirace
Geographical mobility - Moved from abroad (%) - Other Race
Place of birth for the foreign-born population - Ireland (%)
Place of birth for the foreign-born population - Denmark (%)
Place of birth for the foreign-born population - Norway (%)
Place of birth for the foreign-born population - Sweden (%)
Place of birth for the foreign-born population - United Kingdom (%)
Place of birth for the foreign-born population - England (%)
Place of birth for the foreign-born population - Scotland (%)
Place of birth for the foreign-born population - Other Northern Europe (%)
Place of birth for the foreign-born population - Austria (%)
Place of birth for the foreign-born population - Belgium (%)
Place of birth for the foreign-born population - France (%)
Place of birth for the foreign-born population - Germany (%)
Place of birth for the foreign-born population - Netherlands (%)
Place of birth for the foreign-born population - Switzerland (%)
Place of birth for the foreign-born population - Other Western Europe (%)
Place of birth for the foreign-born population - Greece (%)
Place of birth for the foreign-born population - Italy (%)
Place of birth for the foreign-born population - Portugal (%)
Place of birth for the foreign-born population - Spain (%)
Place of birth for the foreign-born population - Other Southern Europe (%)
Place of birth for the foreign-born population - Albania (%)
Place of birth for the foreign-born population - Belarus (%)
Place of birth for the foreign-born population - Bosnia and Herzegovina (%)
Place of birth for the foreign-born population - Bulgaria (%)
Place of birth for the foreign-born population - Croatia (%)
Place of birth for the foreign-born population - Czechoslovakia (%)
Place of birth for the foreign-born population - Hungary (%)
Place of birth for the foreign-born population - Latvia (%)
Place of birth for the foreign-born population - Lithuania (%)
Place of birth for the foreign-born population - North Macedonia (Macedonia) (%)
Place of birth for the foreign-born population - Moldova (%)
Place of birth for the foreign-born population - Poland (%)
Place of birth for the foreign-born population - Romania (%)
Place of birth for the foreign-born population - Russia (%)
Place of birth for the foreign-born population - Serbia (%)
Place of birth for the foreign-born population - Ukraine (%)
Place of birth for the foreign-born population - Other Eastern Europe (%)
Place of birth for the foreign-born population - China (%)
Place of birth for the foreign-born population - Hong Kong (%)
Place of birth for the foreign-born population - Taiwan (%)
Place of birth for the foreign-born population - Japan (%)
Place of birth for the foreign-born population - Korea (%)
Place of birth for the foreign-born population - Other Eastern Asia (%)
Place of birth for the foreign-born population - Afghanistan (%)
Place of birth for the foreign-born population - Bangladesh (%)
Place of birth for the foreign-born population - India (%)
Place of birth for the foreign-born population - Iran (%)
Place of birth for the foreign-born population - Kazakhstan (%)
Place of birth for the foreign-born population - Nepal (%)
Place of birth for the foreign-born population - Pakistan (%)
Place of birth for the foreign-born population - Sri Lanka (%)
Place of birth for the foreign-born population - Uzbekistan (%)
Place of birth for the foreign-born population - Other South Central Asia (%)
Place of birth for the foreign-born population - Burma (%)
Place of birth for the foreign-born population - Cambodia (%)
Place of birth for the foreign-born population - Indonesia (%)
Place of birth for the foreign-born population - Laos (%)
Place of birth for the foreign-born population - Malaysia (%)
Place of birth for the foreign-born population - Philippines (%)
Place of birth for the foreign-born population - Singapore (%)
Place of birth for the foreign-born population - Thailand (%)
Place of birth for the foreign-born population - Vietnam (%)
Place of birth for the foreign-born population - Other South Eastern Asia (%)
Place of birth for the foreign-born population - Armenia (%)
Place of birth for the foreign-born population - Iraq (%)
Place of birth for the foreign-born population - Israel (%)
Place of birth for the foreign-born population - Jordan (%)
Place of birth for the foreign-born population - Kuwait (%)
Place of birth for the foreign-born population - Lebanon (%)
Place of birth for the foreign-born population - Saudi Arabia (%)
Place of birth for the foreign-born population - Syria (%)
Place of birth for the foreign-born population - Turkey (%)
Place of birth for the foreign-born population - Yemen (%)
Place of birth for the foreign-born population - Other Western Asia (%)
Place of birth for the foreign-born population - Eritrea (%)
Place of birth for the foreign-born population - Ethiopia (%)
Place of birth for the foreign-born population - Kenya (%)
Place of birth for the foreign-born population - Somalia (%)
Place of birth for the foreign-born population - Uganda (%)
Place of birth for the foreign-born population - Zimbabwe (%)
Place of birth for the foreign-born population - Other Eastern Africa (%)
Place of birth for the foreign-born population - Cameroon (%)
Place of birth for the foreign-born population - Congo (%)
Place of birth for the foreign-born population - Democratic Republic of Congo (Zaire) (%)
Place of birth for the foreign-born population - Other Middle Africa (%)
Place of birth for the foreign-born population - Egypt (%)
Place of birth for the foreign-born population - Morocco (%)
Place of birth for the foreign-born population - Sudan (%)
Place of birth for the foreign-born population - Other Northern Africa (%)
Place of birth for the foreign-born population - South Africa (%)
Place of birth for the foreign-born population - Other Southern Africa (%)
Place of birth for the foreign-born population - Cabo Verde (%)
Place of birth for the foreign-born population - Ghana (%)
Place of birth for the foreign-born population - Liberia (%)
Place of birth for the foreign-born population - Nigeria (%)
Place of birth for the foreign-born population - Senegal (%)
Place of birth for the foreign-born population - Sierra Leone (%)
Place of birth for the foreign-born population - Other Western Africa (%)
Place of birth for the foreign-born population - Australia (%)
Place of birth for the foreign-born population - New Zealand (%)
Place of birth for the foreign-born population - Fiji (%)
Place of birth for the foreign-born population - Micronesia (%)
Place of birth for the foreign-born population - Bahamas (%)
Place of birth for the foreign-born population - Barbados (%)
Place of birth for the foreign-born population - Cuba (%)
Place of birth for the foreign-born population - Dominica (%)
Place of birth for the foreign-born population - Dominican Republic (%)
Place of birth for the foreign-born population - Grenada (%)
Place of birth for the foreign-born population - Haiti (%)
Place of birth for the foreign-born population - Jamaica (%)
Place of birth for the foreign-born population - St. Vincent and the Grenadines (%)
Place of birth for the foreign-born population - Trinidad and Tobago (%)
Place of birth for the foreign-born population - West Indies (%)
Place of birth for the foreign-born population - Other Caribbean (%)
Place of birth for the foreign-born population - Belize (%)
Place of birth for the foreign-born population - Costa Rica (%)
Place of birth for the foreign-born population - El Salvador (%)
Place of birth for the foreign-born population - Guatemala (%)
Place of birth for the foreign-born population - Honduras (%)
Place of birth for the foreign-born population - Mexico (%)
Place of birth for the foreign-born population - Nicaragua (%)
Place of birth for the foreign-born population - Panama (%)
Place of birth for the foreign-born population - Other Central America (%)
Place of birth for the foreign-born population - Argentina (%)
Place of birth for the foreign-born population - Bolivia (%)
Place of birth for the foreign-born population - Brazil (%)
Place of birth for the foreign-born population - Chile (%)
Place of birth for the foreign-born population - Colombia (%)
Place of birth for the foreign-born population - Ecuador (%)
Place of birth for the foreign-born population - Guyana (%)
Place of birth for the foreign-born population - Peru (%)
Place of birth for the foreign-born population - Uruguay (%)
Place of birth for the foreign-born population - Venezuela (%)
Place of birth for the foreign-born population - Other South America (%)
Place of birth for the foreign-born population - Canada (%)
Place of birth for the foreign-born population - Other Northern America (%)
Place of birth for the foreign-born population - Other (%)
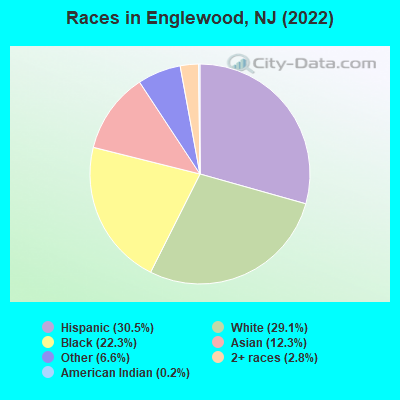
According to 2022 data, the most numerous races in Englewood, NJ are White alone (8,474 residents), Hispanic (8,890 residents), and Black alone (6,489 residents). 56.8% of Englewood residents speak English at home. 37.3% of Englewood, NJ residents are foreign-born (24.3% born in Latin America, 8.5% born in Asia), which is 38.4% greater than the foreign-born rate of 23.0% across the entire state of New Jersey.
Race distribution in Englewood
2000 2022
5,557,209 66.0% White alone 1,117,191 13.3% Hispanic 1,096,171 13.0% Black alone 477,012 5.7% Asian alone 133,689 1.6% Two or more races 19,565 0.2% Other race alone 11,338 0.1% American Indian alone 2,175 0.03% Native Hawaiian and Other
4,766,476 51.5% White alone 2,028,470 21.9% Hispanic 1,111,632 12.0% Black alone 923,546 10.0% Asian alone 332,237 3.6% Two or more races 89,847 1.0% Other race alone 8,557 0.09% American Indian alone 934 0.01% Native Hawaiian and Other
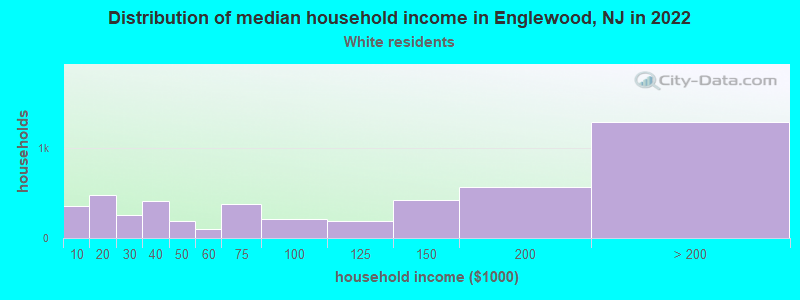
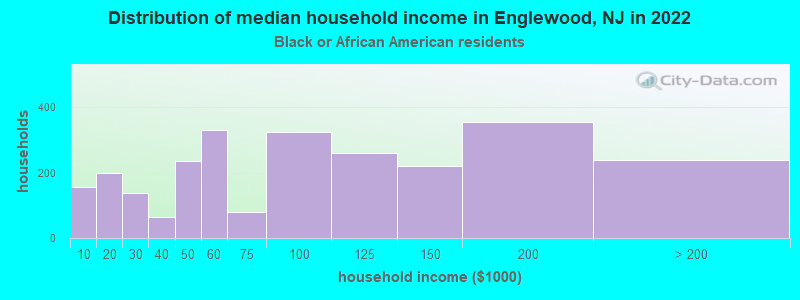
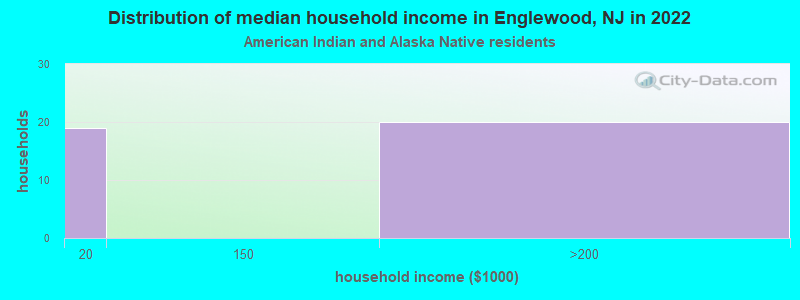
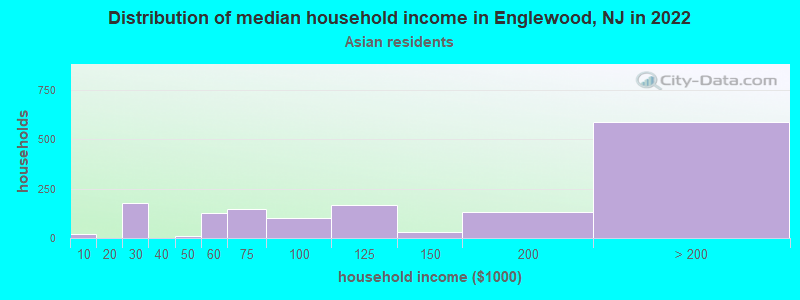
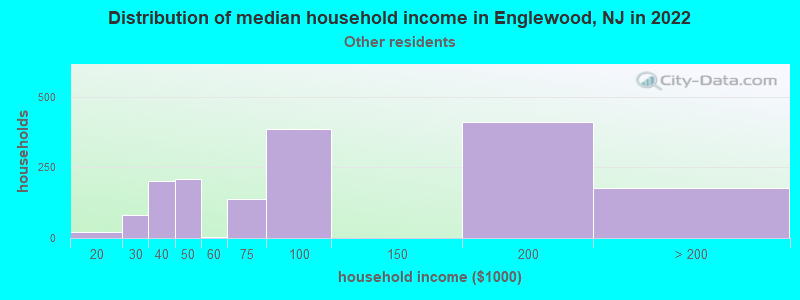
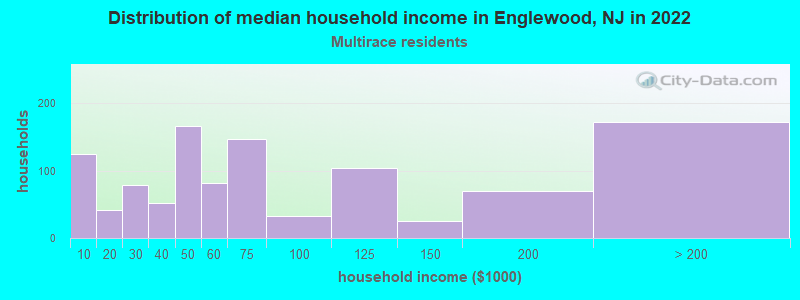
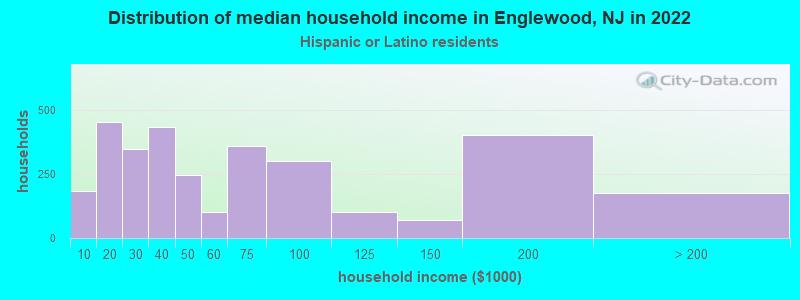
Income and house value in Englewood Median household income in 2022 $163,239 White non-Hispanic householders$100,887 Black householders$152,396 Asian householders$79,282 Some other race householders$48,041 Two or more races householders$39,443 Hispanic or Latino race householdersMedian 2022 house value $912,090 White Non-Hispanic householders$414,222 Black or African American householders $584,341 Asian householders$429,773 Some other race householders$409,038 Two or more races householders$432,836 Hispanic or Latino householders
Median age by race in Englewood
47.8 Median age for White residents48.1 45.8 45.4 Median age for Black or African American residents43.7 49.8 24.9 Median age for American Indian / Alaska Native residents46.8 -753,722,794.2 49.8 Median age for Asian residents49.5 50.3 -510,460,250.5 Median age for Native Hawaiian / Pacific Islander residents-514,767,932.0 -713,070,378.3 35.2 Median age for Other race residents31.2 39.6 37.5 Median age for Two or more races residents31.7 37.6 49.5 Median age for White alone residents49.6 49.4 34.6 Median age for Hispanic or Latino residents31.6 35.6
Owner/renter occupied households by race in Englewood
House owners and renters - White residents 2,721 57.4% Owner occupied2,018 42.6% Renter occupiedHouse owners and renters - Black or African American residents 1,617 62.5% Owner occupied970 37.5% Renter occupiedHouse owners and renters - American Indian / Alaska Native residents 46 100.0% Renter occupiedHouse owners and renters - Asian residents 830 56.5% Owner occupied638 43.5% Renter occupiedHouse owners and renters - Other race residents 941 55.5% Owner occupied755 44.5% Renter occupiedHouse owners and renters - Two or more races residents 612 46.9% Owner occupied692 53.1% Renter occupiedHouse owners and renters - White alone residents 2,453 70.0% Owner occupied1,052 30.0% Renter occupiedHouse owners and renters - Hispanic or Latino residents 1,201 34.9% Owner occupied2,243 65.1% Renter occupied
Language usage in Englewood
English speakers - Total 56.8% of residents of Englewood speak English at home.
27.0% of residents speak Spanish at home 3,540 47.0% Speak English very well3,992 53.0% Speak English less than very well17.1% of residents speak other language at home 3,470 72.6% Speak English very well1,312 27.4% Speak English less than very well
English speakers - Born in the United States 80.7% of residents of Englewood speak English at home.
12.9% of residents speak Spanish at home 1,041 79.3% Speak English very well272 20.7% Speak English less than very well6.7% of residents speak other language at home 665 97.1% Speak English very well20 2.9% Speak English less than very well
English speakers - Native, born elsewhere 50.5% of residents of Englewood speak English at home.
0.8% of residents speak Spanish at home 3 100.0% Speak English very well38.5% of residents speak other language at home 95 61.7% Speak English very well59 38.3% Speak English less than very well
English speakers - Foreign-born 20.9% of residents of Englewood speak English at home.
48.1% of residents speak Spanish at home 1,790 34.4% Speak English very well3,413 65.6% Speak English less than very well31.9% of residents speak other language at home 2,217 64.1% Speak English very well1,242 35.9% Speak English less than very well
White (Caucasian) - Speak only English Native:
88.6% (6,882)Foreign-born:
26.0% (685)
White (Caucasian) - Speak another language Native:
11.1% (862)Foreign-born:
75.0% (1,972)
Black or African American - Speak only English Native:
98.1% (5,470)Foreign-born:
87.8% (869)
Black or African American - Speak another language Native:
1.9% (103)Foreign-born:
17.2% (170)
Asian - Speak only English Native:
46.2% (454)Foreign-born:
13.1% (315)
Asian - Speak another language Native:
53.8% (528)Foreign-born:
86.9% (2,090)
Other race - Speak only English Native:
18.7% (416)Foreign-born:
0.9% (29)
Other race - Speak another language Native:
83.2% (1,849)Foreign-born:
100.0% (3,320)
Two or more races - Speak only English Native:
52.3% (747)Foreign-born:
17.4% (392)
Two or more races - Speak another language Native:
48.5% (693)Foreign-born:
81.7% (1,842)
White alone - Speak only English Native:
91.7% (6,448)Foreign-born:
48.6% (586)
White alone - Speak another language Native:
8.3% (581)Foreign-born:
50.5% (609)
Hispanic or Latino - Speak only English Native:
34.0% (1,046)Foreign-born:
7.2% (410)
Hispanic or Latino - Speak another language Native:
67.0% (2,065)Foreign-born:
92.6% (5,295)
Foreign-born residents in Englewood 10,858 residents are foreign born (24.3% Latin America , 8.5% Asia ).
This city:
37.3%New Jersey:
23.2%
Marital status for residents in Englewood Marital status - White (Caucasian) population 15 years and over
Males 30.7% Never married58.0% Now married2.2% Separated2.4% Widowed6.7% DivorcedFemales 22.5% Never married52.4% Now married0.3% Separated7.8% Widowed17.2% DivorcedWomen who gave birth in the past 12 months Now married:
100.0% (38)Unmarried:
0.0% (0)
Women who did not give birth in the past 12 months Now married:
38.6% (815)Unmarried:
61.4% (1,296)
Marital status - Black or African American population 15 years and over
Males 46.3% Never married36.1% Now married1.6% Separated3.7% Widowed12.3% DivorcedFemales 44.7% Never married31.1% Now married2.1% Separated8.2% Widowed13.9% DivorcedWomen who did not give birth in the past 12 months Now married:
23.1% (297)Unmarried:
76.9% (987)
Marital status - American Indian / Alaska Native population 15 years and over
Males 48.0% Never married52.0% Now married0.0% Separated0.0% Widowed0.0% DivorcedFemales 100.0% Never married0.0% Now married0.0% Separated0.0% Widowed0.0% DivorcedWomen who did not give birth in the past 12 months Now married:
0.0% (0)Unmarried:
100.0% (66)
Marital status - Asian population 15 years and over
Males 31.9% Never married67.5% Now married0.0% Separated0.6% Widowed0.0% DivorcedFemales 28.4% Never married56.9% Now married0.0% Separated3.2% Widowed11.5% DivorcedWomen who did not give birth in the past 12 months Now married:
47.4% (421)Unmarried:
52.6% (468)
Marital status - Other race population 15 years and over
Males 39.3% Never married59.3% Now married0.0% Separated0.0% Widowed1.4% DivorcedFemales 20.6% Never married58.7% Now married3.8% Separated10.8% Widowed6.1% DivorcedWomen who gave birth in the past 12 months Now married:
100.0% (111)Unmarried:
0.0% (0)
Women who did not give birth in the past 12 months Now married:
54.5% (742)Unmarried:
45.5% (618)
Marital status - Two or more races population 15 years and over
Males 51.9% Never married31.8% Now married3.0% Separated4.4% Widowed8.8% DivorcedFemales 43.4% Never married42.1% Now married0.7% Separated1.2% Widowed12.6% DivorcedWomen who gave birth in the past 12 months Now married:
49.2% (45)Unmarried:
50.8% (47)
Women who did not give birth in the past 12 months Now married:
34.8% (277)Unmarried:
65.2% (519)
Marital status - White alone, not Hispanic / Latino population 15 years and over
Males 27.3% Never married60.9% Now married2.0% Separated3.0% Widowed6.6% DivorcedFemales 22.0% Never married58.2% Now married0.0% Separated9.6% Widowed10.2% DivorcedWomen who gave birth in the past 12 months Now married:
100.0% (44)Unmarried:
0.0% (0)
Women who did not give birth in the past 12 months Now married:
44.7% (641)Unmarried:
55.3% (792)
Marital status - Hispanic or Latino population 15 years and over
Males 43.5% Never married46.6% Now married2.1% Separated1.7% Widowed6.2% DivorcedFemales 28.2% Never married45.3% Now married2.0% Separated5.4% Widowed19.1% DivorcedWomen who gave birth in the past 12 months Now married:
100.0% (50)Unmarried:
0.0% (0)
Women who did not give birth in the past 12 months Now married:
39.6% (937)Unmarried:
60.4% (1,426)
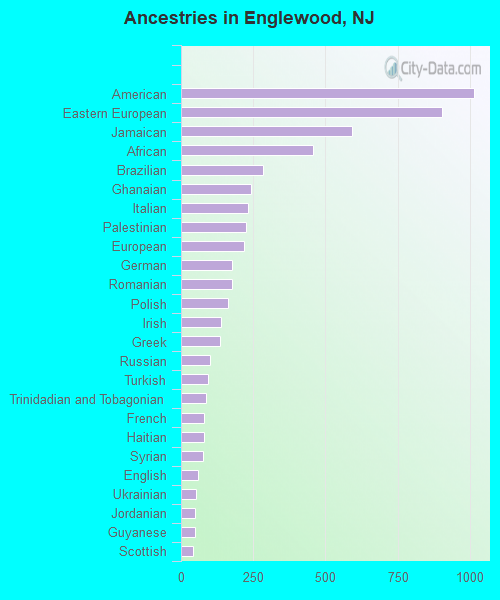
Ancestries in Englewood
1,016 5.5% American905 4.9% Eastern European593 3.2% Jamaican456 2.5% African283 1.5% Brazilian243 1.3% Ghanaian231 1.2% Italian226 1.2% Palestinian219 1.2% European178 1.0% German175 0.9% Romanian164 0.9% Polish140 0.8% Irish135 0.7% Greek99 0.5% Russian93 0.5% Turkish85 0.5% Trinidadian and Tobagonian80 0.4% French79 0.4% Haitian76 0.4% Syrian59 0.3% English53 0.3% Ukrainian49 0.3% Jordanian48 0.3% Guyanese43 0.2% Scottish41 0.2% Iraqi37 0.2% Egyptian35 0.2% West Indian31 0.2% Bulgarian30 0.2% Israeli30 0.2% Hungarian22 0.1% Nigerian19 0.1% Slavic18 0.10% Czech13 0.07% Iranian12 0.06% Belgian9 0.05% British West Indian9 0.05% Austrian8 0.04% Cape Verdean8 0.04% French Canadian4 0.02% Lebanese
Geographical mobility in Englewood Same house 1 year ago 9,932 92.1% White (Caucasian)6,654 97.9% Black or African American206 83.9% American Indian / Alaska Native2,547 71.0% Asian4,784 84.3% Other race3,570 94.1% Two or more races7,887 93.4% White alone, not Hispanic / Latino7,741 86.7% Hispanic or LatinoMoved within same county 297 2.8% White / Caucasian19 0.3% Black or African American904 25.2% Asian475 8.4% Other race10 0.3% Two or more races291 3.4% White alone, not Hispanic / Latino342 3.8% Hispanic or LatinoMoved within same state 117 1.1% White / Caucasian83 1.2% Black or African American285 5.0% Other race64 1.7% Two or more races85 1.0% White alone, not Hispanic / Latino481 5.4% Hispanic or LatinoMoved from different state 169 1.6% White / Caucasian205 3.0% Black or African American23 9.3% American Indian / Alaska Native169 4.7% Asian24 0.6% Two or more races159 1.9% White alone, not Hispanic / Latino22 0.2% Hispanic or LatinoMoved from abroad 268 2.5% White1 0.0% Black or African American77 1.3% Other race150 4.0% Two or more races12 0.1% White alone, not Hispanic / Latino492 5.5% Hispanic or Latino
Children Nativity (place of birth) in Englewood
Children under 6 years - Living with two parents Both parents native 357 100.0% NativeBoth parents foreign-born 324 98.0% Native7 2.0% Foreign-bornOne native, one foreign-born parent 256 100.0% NativeChildren under 6 years - Living with one parent Native parent 255 100.0% NativeForeign-born parent 19 100.0% NativeChildren 6 to 17 years - Living with two parents Both parents native 729 96.1% Native29 3.9% Foreign-bornBoth parents foreign-born 677 64.2% Native378 35.8% Foreign-bornOne native, one foreign-born parent 293 100.0% NativeChildren 6 to 17 years - Living with one parent Native parent 600 100.0% NativeForeign-born parent 1,110 67.9% Native525 32.1% Foreign-born
Place of birth for residents in Englewood 7,281 Americas7,243 Latin America3,211 South America2,937 Caribbean2,545 Asia1,783 Eastern Asia1,094 Central America689 Europe540 Eastern Europe341 Africa317 South Eastern Asia288 Western Asia264 China177 Western Africa155 South Central Asia93 Northern Africa65 Southern Europe58 Western Europe37 Northern America25 Northern Europe13 Eastern Africa1,762 Colombia1,681 Dominican Republic1,457 Korea739 Jamaica697 Guyana446 Mexico310 El Salvador304 Philippines282 Guatemala275 Dominica258 China253 Brazil167 Ecuador152 Argentina131 Romania124 India115 Ghana103 Poland82 Trinidad and Tobago75 West Indies72 Syria67 Israel62 Chile61 Japan61 Peru55 Russia54 Honduras52 Egypt52 Ukraine48 Turkey46 Spain43 Germany41 Saudi Arabia37 Czechoslovakia37 Canada35 Morocco35 St. Vincent and the Grenadines30 Nigeria30 Senegal29 Jordan28 Iraq25 Ireland19 Bulgaria19 Greece18 Haiti16 St. Lucia14 Pakistan13 Vietnam13 Uganda12 Grenada12 Iran9 Hungary8 Belgium7 France6 Hong Kong5 Kazakhstan
Grandparents responsible for own grandchildren in Englewood
Grandparents (30 to 59 years) White / Caucasian 44 100.0% Responsible for grandchildrenOther race 114 100.0% Not responsible for grandchildrenTwo or more races 28 100.0% Responsible for grandchildrenWhite alone, not Hispanic / Latino 49 100.0% Responsible for grandchildrenHispanic or Latino 22 40.2% Responsible for grandchildren33 59.8% Not responsible for grandchildren
Grandparents (60 years and over) White / Caucasian 13 100.0% Not responsible for grandchildrenOther race 163 100.0% Not responsible for grandchildrenWhite alone, not Hispanic / Latino 15 100.0% Not responsible for grandchildrenHispanic or Latino 110 100.0% Not responsible for grandchildren