Races in Englewood, Florida (FL) Detailed Stats
Data:
Races - White alone (%)
Races - White alone (% change since 2000)
Races - Black alone (%)
Races - Black alone (% change since 2000)
Races - American Indian alone (%)
Races - American Indian alone (% change since 2000)
Races - Asian alone (%)
Races - Asian alone (% change since 2000)
Races - Hispanic (%)
Races - Hispanic (% change since 2000)
Races - Native Hawaiian and Other Pacific Islander alone (%)
Races - Native Hawaiian and Other Pacific Islander alone (% change since 2000)
Races - Two or more races(%)
Races - Two or more races(% change since 2000)
Races - Other race alone (%)
Races - Other race alone (% change since 2000)
Racial diversity
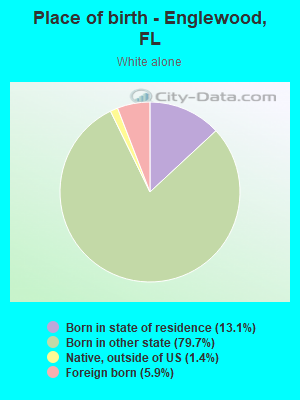
Place of birth - Born in state of residence (%)
Place of birth - Born in state of residence (%) - White
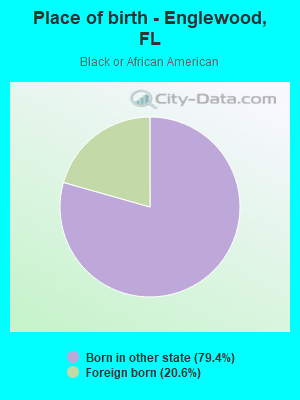
Place of birth - Born in state of residence (%) - Black or African American
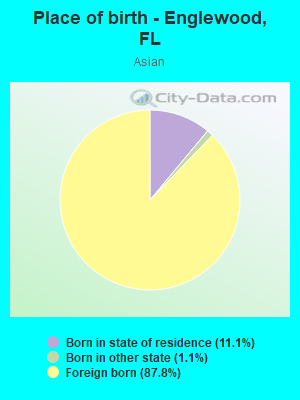
Place of birth - Born in state of residence (%) - Asian
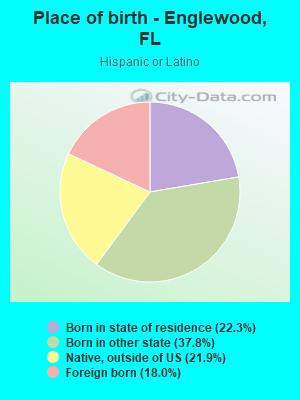
Place of birth - Born in state of residence (%) - Hispanic or Latino
Place of birth - Born in state of residence (%) - American Indian and Alaska Native
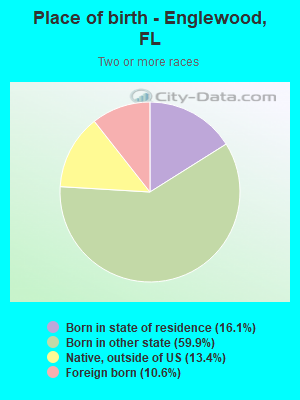
Place of birth - Born in state of residence (%) - Multirace
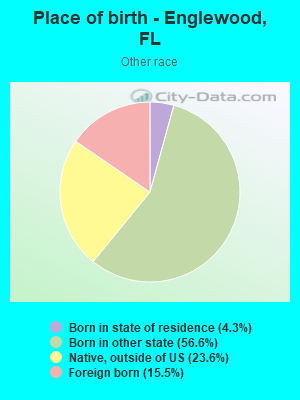
Place of birth - Born in state of residence (%) - Other Race
Place of birth - Born in other state (%)
Place of birth - Born in other state (%) - White
Place of birth - Born in other state (%) - Black or African American
Place of birth - Born in other state (%) - Asian
Place of birth - Born in other state (%) - Hispanic or Latino
Place of birth - Born in other state (%) - American Indian and Alaska Native
Place of birth - Born in other state (%) - Multirace
Place of birth - Born in other state (%) - Other Race
Place of birth - Native, outside of US (%)
Place of birth - Native, outside of US (%) - White
Place of birth - Native, outside of US (%) - Black or African American
Place of birth - Native, outside of US (%) - Asian
Place of birth - Native, outside of US (%) - Hispanic or Latino
Place of birth - Native, outside of US (%) - American Indian and Alaska Native
Place of birth - Native, outside of US (%) - Multirace
Place of birth - Native, outside of US (%) - Other Race
Place of birth - Foreign born (%)
Place of birth - Foreign born (%) - White
Place of birth - Foreign born (%) - Black or African American
Place of birth - Foreign born (%) - Asian
Place of birth - Foreign born (%) - Hispanic or Latino
Place of birth - Foreign born (%) - American Indian and Alaska Native
Place of birth - Foreign born (%) - Multirace
Place of birth - Foreign born (%) - Other Race
Residents speaking English at home (%)
Residents speaking English at home - Born in the United States (%)
Residents speaking English at home - Native, born elsewhere (%)
Residents speaking English at home - Foreign born (%)
Residents speaking Spanish at home (%)
Residents speaking Spanish at home - Born in the United States (%)
Residents speaking Spanish at home - Native, born elsewhere (%)
Residents speaking Spanish at home - Foreign born (%)
Residents speaking other language at home (%)
Residents speaking other language at home - Born in the United States (%)
Residents speaking other language at home - Native, born elsewhere (%)
Residents speaking other language at home - Foreign born (%)
Marital status - Never married (%)
Marital status - Now married (%)
Marital status - Separated (%)
Marital status - Widowed (%)
Marital status - Divorced (%)
Ancestries Reported - Arab (%)
Ancestries Reported - Czech (%)
Ancestries Reported - Danish (%)
Ancestries Reported - Dutch (%)
Ancestries Reported - English (%)
Ancestries Reported - French (%)
Ancestries Reported - French Canadian (%)
Ancestries Reported - German (%)
Ancestries Reported - Greek (%)
Ancestries Reported - Hungarian (%)
Ancestries Reported - Irish (%)
Ancestries Reported - Italian (%)
Ancestries Reported - Lithuanian (%)
Ancestries Reported - Norwegian (%)
Ancestries Reported - Polish (%)
Ancestries Reported - Portuguese (%)
Ancestries Reported - Russian (%)
Ancestries Reported - Scotch-Irish (%)
Ancestries Reported - Scottish (%)
Ancestries Reported - Slovak (%)
Ancestries Reported - Subsaharan African (%)
Ancestries Reported - Swedish (%)
Ancestries Reported - Swiss (%)
Ancestries Reported - Ukrainian (%)
Ancestries Reported - United States (%)
Ancestries Reported - Welsh (%)
Ancestries Reported - West Indian (%)
Ancestries Reported - Other (%)
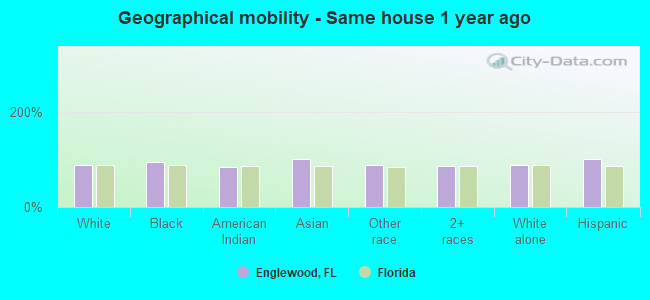
Geographical mobility - Same house 1 year ago (%)
Geographical mobility - Same house 1 year ago (%) - White
Geographical mobility - Same house 1 year ago (%) - Black or African American
Geographical mobility - Same house 1 year ago (%) - Asian
Geographical mobility - Same house 1 year ago (%) - Hispanic or Latino
Geographical mobility - Same house 1 year ago (%) - American Indian and Alaska Native
Geographical mobility - Same house 1 year ago (%) - Multirace
Geographical mobility - Same house 1 year ago (%) - Other Race
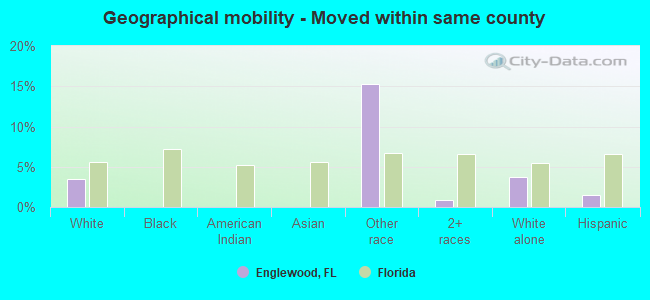
Geographical mobility - Moved within same county (%)
Geographical mobility - Moved within same county (%) - White
Geographical mobility - Moved within same county (%) - Black or African American
Geographical mobility - Moved within same county (%) - Asian
Geographical mobility - Moved within same county (%) - Hispanic or Latino
Geographical mobility - Moved within same county (%) - American Indian and Alaska Native
Geographical mobility - Moved within same county (%) - Multirace
Geographical mobility - Moved within same county (%) - Other Race
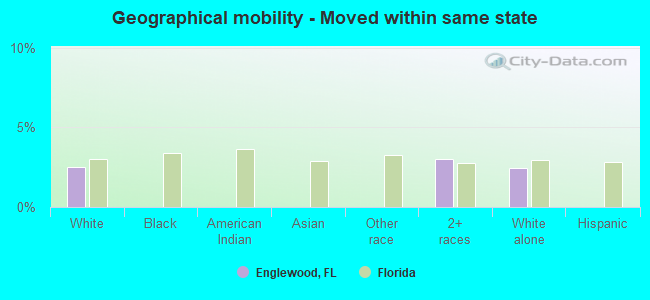
Geographical mobility - Moved from different county within same state (%)
Geographical mobility - Moved from different county within same state (%) - White
Geographical mobility - Moved from different county within same state (%) - Black or African American
Geographical mobility - Moved from different county within same state (%) - Asian
Geographical mobility - Moved from different county within same state (%) - Hispanic or Latino
Geographical mobility - Moved from different county within same state (%) - American Indian and Alaska Native
Geographical mobility - Moved from different county within same state (%) - Multirace
Geographical mobility - Moved from different county within same state (%) - Other Race
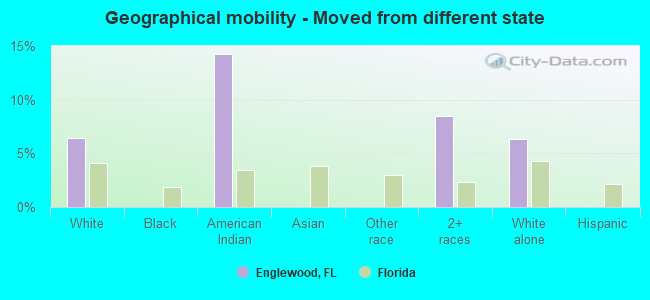
Geographical mobility - Moved from different state (%)
Geographical mobility - Moved from different state (%) - White
Geographical mobility - Moved from different state (%) - Black or African American
Geographical mobility - Moved from different state (%) - Asian
Geographical mobility - Moved from different state (%) - Hispanic or Latino
Geographical mobility - Moved from different state (%) - American Indian and Alaska Native
Geographical mobility - Moved from different state (%) - Multirace
Geographical mobility - Moved from different state (%) - Other Race
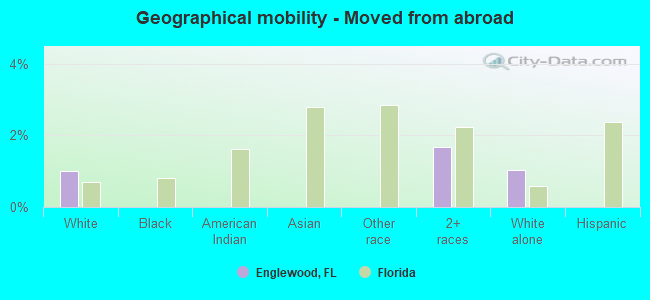
Geographical mobility - Moved from abroad (%)
Geographical mobility - Moved from abroad (%) - White
Geographical mobility - Moved from abroad (%) - Black or African American
Geographical mobility - Moved from abroad (%) - Asian
Geographical mobility - Moved from abroad (%) - Hispanic or Latino
Geographical mobility - Moved from abroad (%) - American Indian and Alaska Native
Geographical mobility - Moved from abroad (%) - Multirace
Geographical mobility - Moved from abroad (%) - Other Race
Place of birth for the foreign-born population - Ireland (%)
Place of birth for the foreign-born population - Denmark (%)
Place of birth for the foreign-born population - Norway (%)
Place of birth for the foreign-born population - Sweden (%)
Place of birth for the foreign-born population - United Kingdom (%)
Place of birth for the foreign-born population - England (%)
Place of birth for the foreign-born population - Scotland (%)
Place of birth for the foreign-born population - Other Northern Europe (%)
Place of birth for the foreign-born population - Austria (%)
Place of birth for the foreign-born population - Belgium (%)
Place of birth for the foreign-born population - France (%)
Place of birth for the foreign-born population - Germany (%)
Place of birth for the foreign-born population - Netherlands (%)
Place of birth for the foreign-born population - Switzerland (%)
Place of birth for the foreign-born population - Other Western Europe (%)
Place of birth for the foreign-born population - Greece (%)
Place of birth for the foreign-born population - Italy (%)
Place of birth for the foreign-born population - Portugal (%)
Place of birth for the foreign-born population - Spain (%)
Place of birth for the foreign-born population - Other Southern Europe (%)
Place of birth for the foreign-born population - Albania (%)
Place of birth for the foreign-born population - Belarus (%)
Place of birth for the foreign-born population - Bosnia and Herzegovina (%)
Place of birth for the foreign-born population - Bulgaria (%)
Place of birth for the foreign-born population - Croatia (%)
Place of birth for the foreign-born population - Czechoslovakia (%)
Place of birth for the foreign-born population - Hungary (%)
Place of birth for the foreign-born population - Latvia (%)
Place of birth for the foreign-born population - Lithuania (%)
Place of birth for the foreign-born population - North Macedonia (Macedonia) (%)
Place of birth for the foreign-born population - Moldova (%)
Place of birth for the foreign-born population - Poland (%)
Place of birth for the foreign-born population - Romania (%)
Place of birth for the foreign-born population - Russia (%)
Place of birth for the foreign-born population - Serbia (%)
Place of birth for the foreign-born population - Ukraine (%)
Place of birth for the foreign-born population - Other Eastern Europe (%)
Place of birth for the foreign-born population - China (%)
Place of birth for the foreign-born population - Hong Kong (%)
Place of birth for the foreign-born population - Taiwan (%)
Place of birth for the foreign-born population - Japan (%)
Place of birth for the foreign-born population - Korea (%)
Place of birth for the foreign-born population - Other Eastern Asia (%)
Place of birth for the foreign-born population - Afghanistan (%)
Place of birth for the foreign-born population - Bangladesh (%)
Place of birth for the foreign-born population - India (%)
Place of birth for the foreign-born population - Iran (%)
Place of birth for the foreign-born population - Kazakhstan (%)
Place of birth for the foreign-born population - Nepal (%)
Place of birth for the foreign-born population - Pakistan (%)
Place of birth for the foreign-born population - Sri Lanka (%)
Place of birth for the foreign-born population - Uzbekistan (%)
Place of birth for the foreign-born population - Other South Central Asia (%)
Place of birth for the foreign-born population - Burma (%)
Place of birth for the foreign-born population - Cambodia (%)
Place of birth for the foreign-born population - Indonesia (%)
Place of birth for the foreign-born population - Laos (%)
Place of birth for the foreign-born population - Malaysia (%)
Place of birth for the foreign-born population - Philippines (%)
Place of birth for the foreign-born population - Singapore (%)
Place of birth for the foreign-born population - Thailand (%)
Place of birth for the foreign-born population - Vietnam (%)
Place of birth for the foreign-born population - Other South Eastern Asia (%)
Place of birth for the foreign-born population - Armenia (%)
Place of birth for the foreign-born population - Iraq (%)
Place of birth for the foreign-born population - Israel (%)
Place of birth for the foreign-born population - Jordan (%)
Place of birth for the foreign-born population - Kuwait (%)
Place of birth for the foreign-born population - Lebanon (%)
Place of birth for the foreign-born population - Saudi Arabia (%)
Place of birth for the foreign-born population - Syria (%)
Place of birth for the foreign-born population - Turkey (%)
Place of birth for the foreign-born population - Yemen (%)
Place of birth for the foreign-born population - Other Western Asia (%)
Place of birth for the foreign-born population - Eritrea (%)
Place of birth for the foreign-born population - Ethiopia (%)
Place of birth for the foreign-born population - Kenya (%)
Place of birth for the foreign-born population - Somalia (%)
Place of birth for the foreign-born population - Uganda (%)
Place of birth for the foreign-born population - Zimbabwe (%)
Place of birth for the foreign-born population - Other Eastern Africa (%)
Place of birth for the foreign-born population - Cameroon (%)
Place of birth for the foreign-born population - Congo (%)
Place of birth for the foreign-born population - Democratic Republic of Congo (Zaire) (%)
Place of birth for the foreign-born population - Other Middle Africa (%)
Place of birth for the foreign-born population - Egypt (%)
Place of birth for the foreign-born population - Morocco (%)
Place of birth for the foreign-born population - Sudan (%)
Place of birth for the foreign-born population - Other Northern Africa (%)
Place of birth for the foreign-born population - South Africa (%)
Place of birth for the foreign-born population - Other Southern Africa (%)
Place of birth for the foreign-born population - Cabo Verde (%)
Place of birth for the foreign-born population - Ghana (%)
Place of birth for the foreign-born population - Liberia (%)
Place of birth for the foreign-born population - Nigeria (%)
Place of birth for the foreign-born population - Senegal (%)
Place of birth for the foreign-born population - Sierra Leone (%)
Place of birth for the foreign-born population - Other Western Africa (%)
Place of birth for the foreign-born population - Australia (%)
Place of birth for the foreign-born population - New Zealand (%)
Place of birth for the foreign-born population - Fiji (%)
Place of birth for the foreign-born population - Micronesia (%)
Place of birth for the foreign-born population - Bahamas (%)
Place of birth for the foreign-born population - Barbados (%)
Place of birth for the foreign-born population - Cuba (%)
Place of birth for the foreign-born population - Dominica (%)
Place of birth for the foreign-born population - Dominican Republic (%)
Place of birth for the foreign-born population - Grenada (%)
Place of birth for the foreign-born population - Haiti (%)
Place of birth for the foreign-born population - Jamaica (%)
Place of birth for the foreign-born population - St. Vincent and the Grenadines (%)
Place of birth for the foreign-born population - Trinidad and Tobago (%)
Place of birth for the foreign-born population - West Indies (%)
Place of birth for the foreign-born population - Other Caribbean (%)
Place of birth for the foreign-born population - Belize (%)
Place of birth for the foreign-born population - Costa Rica (%)
Place of birth for the foreign-born population - El Salvador (%)
Place of birth for the foreign-born population - Guatemala (%)
Place of birth for the foreign-born population - Honduras (%)
Place of birth for the foreign-born population - Mexico (%)
Place of birth for the foreign-born population - Nicaragua (%)
Place of birth for the foreign-born population - Panama (%)
Place of birth for the foreign-born population - Other Central America (%)
Place of birth for the foreign-born population - Argentina (%)
Place of birth for the foreign-born population - Bolivia (%)
Place of birth for the foreign-born population - Brazil (%)
Place of birth for the foreign-born population - Chile (%)
Place of birth for the foreign-born population - Colombia (%)
Place of birth for the foreign-born population - Ecuador (%)
Place of birth for the foreign-born population - Guyana (%)
Place of birth for the foreign-born population - Peru (%)
Place of birth for the foreign-born population - Uruguay (%)
Place of birth for the foreign-born population - Venezuela (%)
Place of birth for the foreign-born population - Other South America (%)
Place of birth for the foreign-born population - Canada (%)
Place of birth for the foreign-born population - Other Northern America (%)
Place of birth for the foreign-born population - Other (%)
Cardboard Boat Race/ Englewood Pioneer Festival, Beat the Heat Challenge & more, all this weekend! (1 reply)Englewood Beach Water Fest, Grilled Cheese Festival, Renaissance Festival, Art Festivals & more, all this weekend! (0 replies)Englewood Fla-Opinions-Observations and More (40 replies)Gem Jewelry & Bead Show, Special Olympics Paddle Competition, Opera Open House, Wrestling & More, all this weekend! (0 replies)Ponies Under the Palms, Renaissance Festival, Englewood Beachfest, Grilled Cheese Festival & more, all this weekend! (4 replies)Young family Venice - Englewood (19 replies)
Latest news about races in Englewood, FL collected exclusively by city-data.com from local newspapers, TV, and radio stations
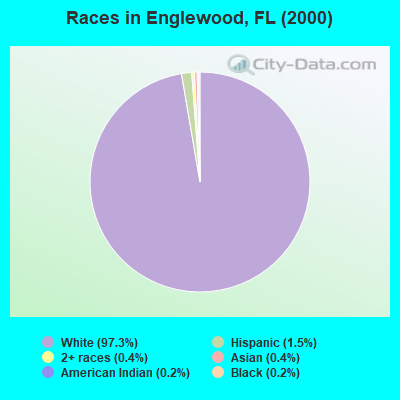
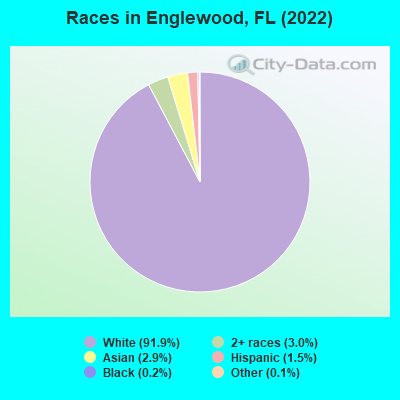
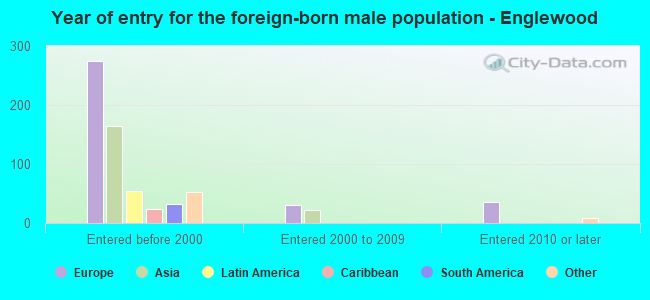
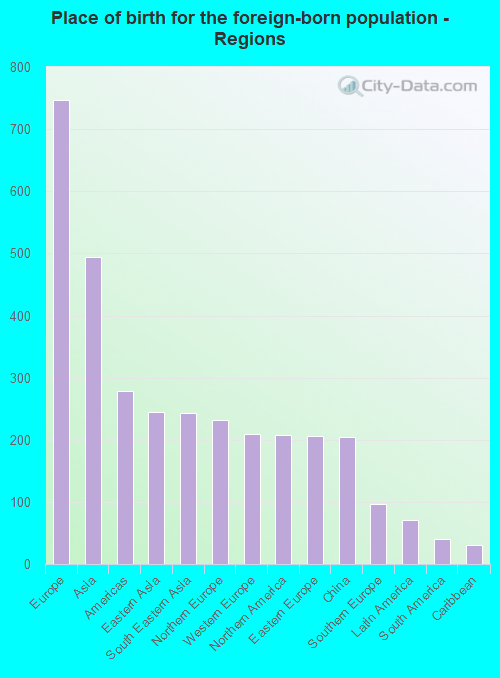
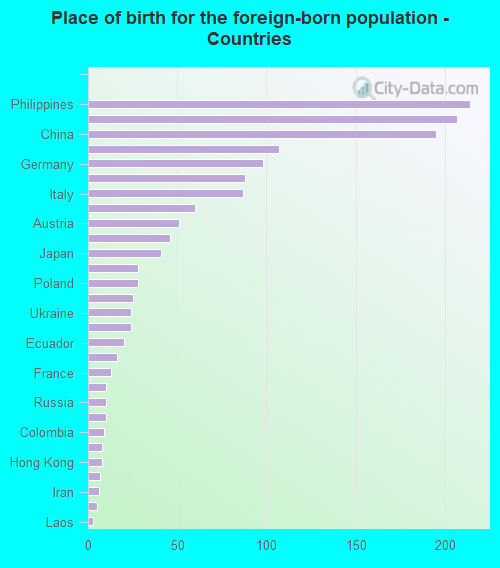
According to 2022 data, the most numerous races in Englewood, FL are White alone (18,726 residents), Hispanic (309 residents), and Black alone (38 residents). 91.7% of Englewood residents speak English at home. 7.5% of Englewood, FL residents are foreign-born (3.7% born in Europe, 2.4% born in Asia, 1.0% born in North America), which is 180.4% less than the foreign-born rate of 21.0% across the entire state of Florida.
Race distribution in Englewood
2000 2022
10,458,509 65.4% White alone 2,682,715 16.8% Hispanic 2,264,268 14.2% Black alone 261,693 1.6% Asian alone 236,954 1.5% Two or more races 42,358 0.3% American Indian alone 28,994 0.2% Other race alone 6,887 0.04% Native Hawaiian and Other
11,309,403 50.8% White alone 6,025,039 27.1% Hispanic 3,241,015 14.6% Black alone 861,630 3.9% Two or more races 623,692 2.8% Asian alone 152,054 0.7% Other race alone 22,504 0.1% American Indian alone 9,486 0.04% Native Hawaiian and Other
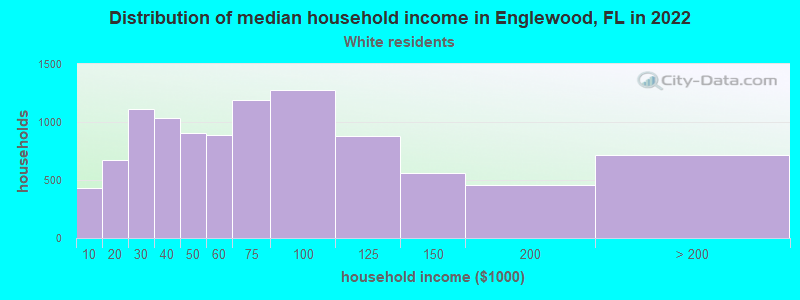
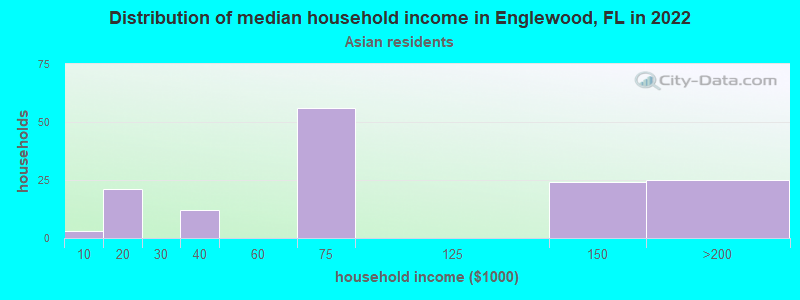
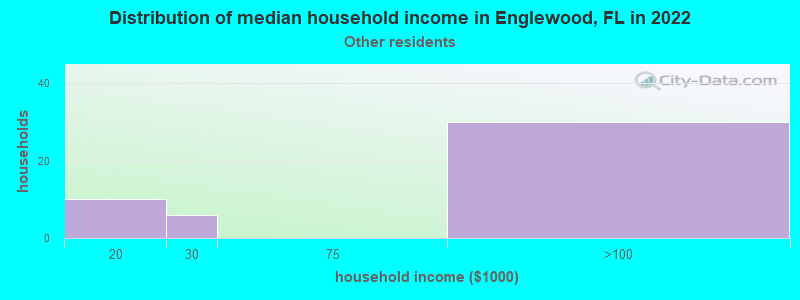
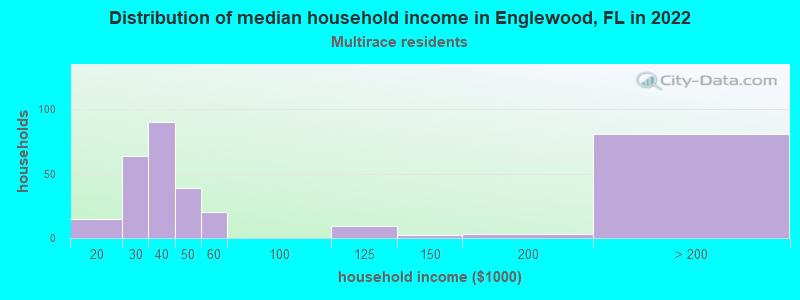
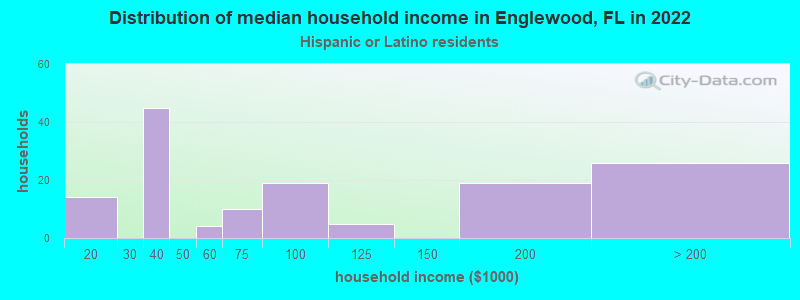
Income and house value in Englewood Median household income in 2022 $62,733 White non-Hispanic householders$75,305 Asian householders$30,555 Two or more races householders$75,730 Hispanic or Latino race householdersMedian 2022 house value $398,232 White Non-Hispanic householders$313,075 American Indian or Alaska Native householders $669,564 Asian householders$469,613 Two or more races householders$247,956 Hispanic or Latino householders
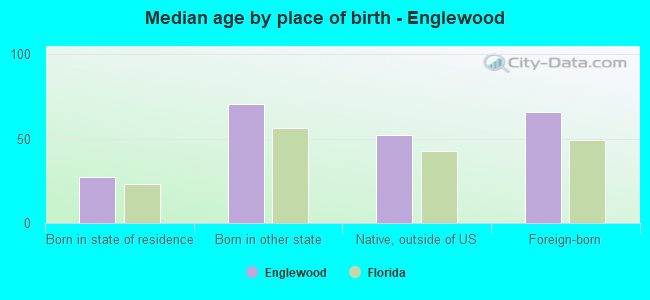
Median age by race in Englewood
69.6 Median age for White residents69.6 69.4 92.5 Median age for Black or African American residents101.2 -670,401,493.3 -1,274,161,734.4 Median age for American Indian / Alaska Native residents-856,941,507.2 -594,925,633.7 39.3 Median age for Asian residents45.9 34.6 -679,849,340.2 Median age for Native Hawaiian / Pacific Islander residents-858,307,848.3 -443,298,968.6 66.1 Median age for Other race residents49.5 74.8 44.1 Median age for Two or more races residents16.8 59.2 69.0 Median age for White alone residents68.7 69.0 63.3 Median age for Hispanic or Latino residents65.2 66.2
Owner/renter occupied households by race in Englewood
House owners and renters - White residents 8,833 86.4% Owner occupied1,396 13.6% Renter occupiedHouse owners and renters - American Indian / Alaska Native residents 3 100.0% Owner occupiedHouse owners and renters - Asian residents 157 93.5% Owner occupied11 6.5% Renter occupiedHouse owners and renters - Other race residents 65 100.0% Owner occupiedHouse owners and renters - Two or more races residents 284 80.2% Owner occupied70 19.8% Renter occupiedHouse owners and renters - White alone residents 8,892 85.9% Owner occupied1,461 14.1% Renter occupiedHouse owners and renters - Hispanic or Latino residents 129 95.9% Owner occupied5 4.1% Renter occupied
Language usage in Englewood
English speakers - Total 91.7% of residents of Englewood speak English at home.
1.3% of residents speak Spanish at home 182 70.0% Speak English very well78 30.0% Speak English less than very well6.6% of residents speak other language at home 932 70.2% Speak English very well396 29.8% Speak English less than very well
English speakers - Born in the United States 97.6% of residents of Englewood speak English at home.
1.0% of residents speak Spanish at home 81 54.0% Speak English very well69 46.0% Speak English less than very well1.6% of residents speak other language at home 202 82.4% Speak English very well43 17.6% Speak English less than very well
English speakers - Native, born elsewhere 89.4% of residents of Englewood speak English at home.
15.1% of residents speak Spanish at home 41 75.9% Speak English very well13 24.1% Speak English less than very well1.7% of residents speak other language at home 6 100.0% Speak English very well
English speakers - Foreign-born 38.5% of residents of Englewood speak English at home.
3.5% of residents speak Spanish at home 53 88.3% Speak English very well7 11.7% Speak English less than very well59.3% of residents speak other language at home 659 64.0% Speak English very well370 36.0% Speak English less than very well
White (Caucasian) - Speak only English Native:
99.1% (17,047)Foreign-born:
59.3% (561)
White (Caucasian) - Speak another language Native:
1.3% (227)Foreign-born:
39.9% (378)
Asian - Speak only English Native:
12.0% (6)Foreign-born:
5.1% (26)
Asian - Speak another language Native:
79.5% (38)Foreign-born:
100.0% (519)
Other race - Speak only English Native:
33.1% (27)Foreign-born:
100.0% (14)
Two or more races - Speak only English Native:
82.2% (618)Foreign-born:
36.5% (34)
Two or more races - Speak another language Native:
17.9% (134)Foreign-born:
49.6% (46)
White alone - Speak only English Native:
98.5% (17,128)Foreign-born:
55.0% (604)
White alone - Speak another language Native:
1.5% (267)Foreign-born:
41.8% (459)
Hispanic or Latino - Speak another language Native:
46.8% (106)Foreign-born:
100.0% (57)
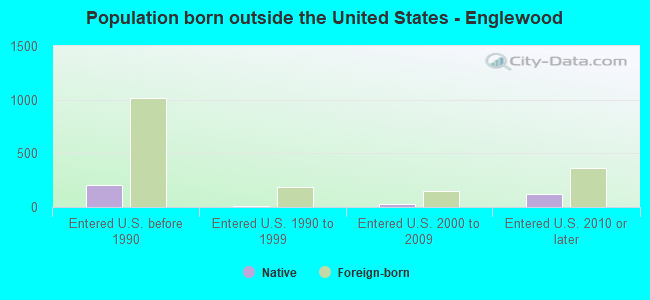
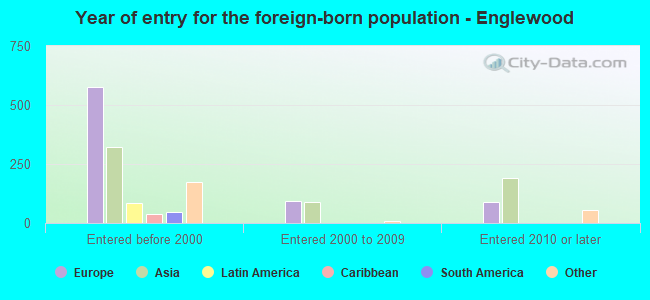
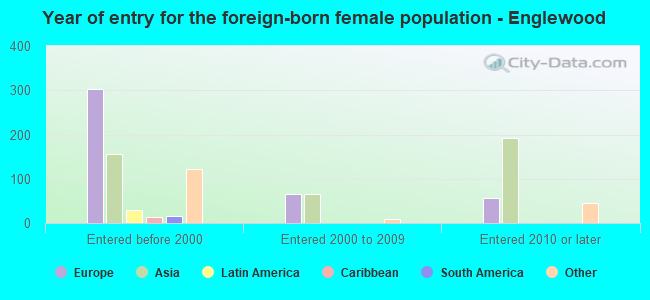
Foreign-born residents in Englewood 1,527 residents are foreign born (3.7% Europe , 2.4% Asia , 1.0% North America ).
This city:
7.5%Florida:
21.1%
Marital status for residents in Englewood Marital status - White (Caucasian) population 15 years and over
Males 18.1% Never married60.2% Now married0.1% Separated7.6% Widowed13.9% DivorcedFemales 8.9% Never married55.0% Now married0.6% Separated18.1% Widowed17.4% DivorcedWomen who gave birth in the past 12 months Now married:
83.8% (60)Unmarried:
16.2% (12)
Women who did not give birth in the past 12 months Now married:
28.6% (332)Unmarried:
71.4% (828)
Marital status - Asian population 15 years and over
Males 12.8% Never married58.5% Now married1.8% Separated0.0% Widowed26.8% DivorcedFemales 31.8% Never married52.7% Now married0.0% Separated12.4% Widowed3.2% DivorcedWomen who did not give birth in the past 12 months Now married:
40.4% (63)Unmarried:
59.6% (93)
Marital status - Other race population 15 years and over
Males 48.1% Never married51.9% Now married0.0% Separated0.0% Widowed0.0% DivorcedFemales 0.0% Never married100.0% Now married0.0% Separated0.0% Widowed0.0% DivorcedMarital status - Two or more races population 15 years and over
Males 20.4% Never married58.7% Now married0.0% Separated14.3% Widowed6.6% DivorcedFemales 19.5% Never married56.8% Now married0.0% Separated18.3% Widowed5.3% DivorcedWomen who did not give birth in the past 12 months Now married:
54.8% (67)Unmarried:
45.2% (55)
Marital status - White alone, not Hispanic / Latino population 15 years and over
Males 18.2% Never married60.1% Now married0.1% Separated7.6% Widowed14.0% DivorcedFemales 9.0% Never married54.8% Now married0.6% Separated18.2% Widowed17.4% DivorcedWomen who gave birth in the past 12 months Now married:
83.8% (63)Unmarried:
16.2% (12)
Women who did not give birth in the past 12 months Now married:
27.9% (337)Unmarried:
72.1% (871)
Marital status - Hispanic or Latino population 15 years and over
Males 12.8% Never married61.5% Now married0.0% Separated25.7% Widowed0.0% DivorcedFemales 12.5% Never married78.3% Now married0.0% Separated5.0% Widowed4.2% DivorcedWomen who did not give birth in the past 12 months Now married:
61.5% (26)Unmarried:
38.5% (16)
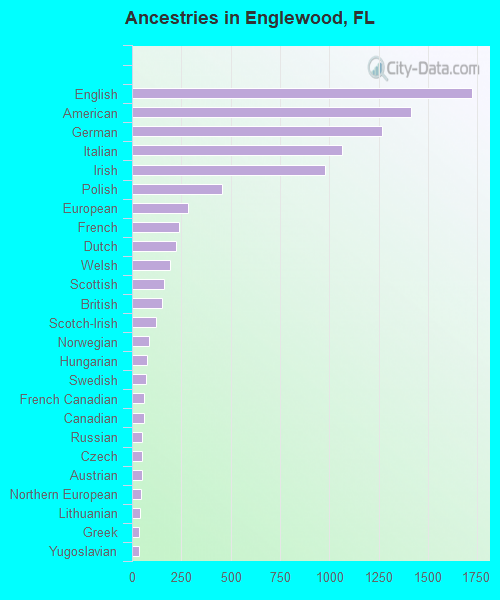
Ancestries in Englewood
1,723 16.5% English1,413 13.6% American1,266 12.2% German1,064 10.2% Italian976 9.4% Irish457 4.4% Polish286 2.7% European237 2.3% French224 2.2% Dutch192 1.8% Welsh160 1.5% Scottish151 1.5% British121 1.2% Scotch-Irish87 0.8% Norwegian74 0.7% Hungarian69 0.7% Swedish62 0.6% French Canadian59 0.6% Canadian50 0.5% Russian50 0.5% Czech49 0.5% Austrian47 0.5% Northern European41 0.4% Lithuanian38 0.4% Greek38 0.4% Yugoslavian32 0.3% Celtic32 0.3% Czechoslovakian27 0.3% Finnish25 0.2% Bulgarian22 0.2% Macedonian21 0.2% Danish20 0.2% Slovak19 0.2% Eastern European15 0.1% Brazilian15 0.1% Armenian14 0.1% Syrian13 0.1% New Zealander13 0.1% Pennsylvania German13 0.1% Belgian12 0.1% Scandinavian11 0.1% Assyrian11 0.1% Ukrainian10 0.10% Estonian10 0.10% Serbian8 0.08% Romanian8 0.08% Swiss8 0.08% Slovene7 0.07% Haitian6 0.06% Iranian
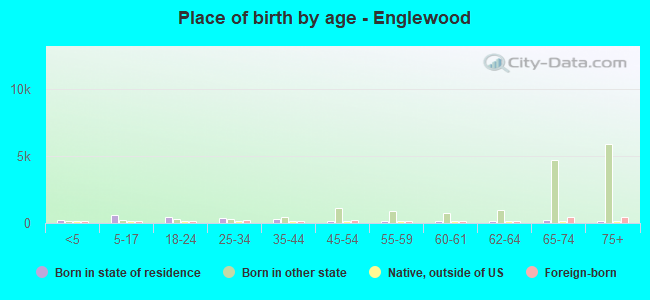
Children Nativity (place of birth) in Englewood
Children under 6 years - Living with two parents Both parents native 157 100.0% NativeBoth parents foreign-born 31 100.0% NativeOne native, one foreign-born parent 2 100.0% NativeChildren under 6 years - Living with one parent Native parent 92 100.0% NativeForeign-born parent 73 100.0% NativeChildren 6 to 17 years - Living with two parents Both parents native 259 99.4% Native2 0.6% Foreign-bornOne native, one foreign-born parent 199 90.9% Native20 9.1% Foreign-bornChildren 6 to 17 years - Living with one parent Native parent 184 100.0% NativeForeign-born parent 88 54.4% Native74 45.6% Foreign-born
Grandparents responsible for own grandchildren in Englewood
Grandparents (30 to 59 years) White / Caucasian 17 24.0% Responsible for grandchildren53 76.0% Not responsible for grandchildrenAsian 42 100.0% Not responsible for grandchildrenWhite alone, not Hispanic / Latino 18 22.0% Responsible for grandchildren63 78.0% Not responsible for grandchildrenGrandparents (60 years and over) White / Caucasian 30 86.4% Responsible for grandchildren5 13.6% Not responsible for grandchildrenAsian 15 31.7% Responsible for grandchildren32 68.3% Not responsible for grandchildrenWhite alone, not Hispanic / Latino 31 86.1% Responsible for grandchildren5 13.9% Not responsible for grandchildren