Races in Elkton, Maryland (MD) Detailed Stats
Data:
Races - White alone (%)
Races - White alone (% change since 2000)
Races - Black alone (%)
Races - Black alone (% change since 2000)
Races - American Indian alone (%)
Races - American Indian alone (% change since 2000)
Races - Asian alone (%)
Races - Asian alone (% change since 2000)
Races - Hispanic (%)
Races - Hispanic (% change since 2000)
Races - Native Hawaiian and Other Pacific Islander alone (%)
Races - Native Hawaiian and Other Pacific Islander alone (% change since 2000)
Races - Two or more races(%)
Races - Two or more races(% change since 2000)
Races - Other race alone (%)
Races - Other race alone (% change since 2000)
Racial diversity
Place of birth - Born in state of residence (%)
Place of birth - Born in state of residence (%) - White
Place of birth - Born in state of residence (%) - Black or African American
Place of birth - Born in state of residence (%) - Asian
Place of birth - Born in state of residence (%) - Hispanic or Latino
Place of birth - Born in state of residence (%) - American Indian and Alaska Native
Place of birth - Born in state of residence (%) - Multirace
Place of birth - Born in state of residence (%) - Other Race
Place of birth - Born in other state (%)
Place of birth - Born in other state (%) - White
Place of birth - Born in other state (%) - Black or African American
Place of birth - Born in other state (%) - Asian
Place of birth - Born in other state (%) - Hispanic or Latino
Place of birth - Born in other state (%) - American Indian and Alaska Native
Place of birth - Born in other state (%) - Multirace
Place of birth - Born in other state (%) - Other Race
Place of birth - Native, outside of US (%)
Place of birth - Native, outside of US (%) - White
Place of birth - Native, outside of US (%) - Black or African American
Place of birth - Native, outside of US (%) - Asian
Place of birth - Native, outside of US (%) - Hispanic or Latino
Place of birth - Native, outside of US (%) - American Indian and Alaska Native
Place of birth - Native, outside of US (%) - Multirace
Place of birth - Native, outside of US (%) - Other Race
Place of birth - Foreign born (%)
Place of birth - Foreign born (%) - White
Place of birth - Foreign born (%) - Black or African American
Place of birth - Foreign born (%) - Asian
Place of birth - Foreign born (%) - Hispanic or Latino
Place of birth - Foreign born (%) - American Indian and Alaska Native
Place of birth - Foreign born (%) - Multirace
Place of birth - Foreign born (%) - Other Race
Residents speaking English at home (%)
Residents speaking English at home - Born in the United States (%)
Residents speaking English at home - Native, born elsewhere (%)
Residents speaking English at home - Foreign born (%)
Residents speaking Spanish at home (%)
Residents speaking Spanish at home - Born in the United States (%)
Residents speaking Spanish at home - Native, born elsewhere (%)
Residents speaking Spanish at home - Foreign born (%)
Residents speaking other language at home (%)
Residents speaking other language at home - Born in the United States (%)
Residents speaking other language at home - Native, born elsewhere (%)
Residents speaking other language at home - Foreign born (%)
Marital status - Never married (%)
Marital status - Now married (%)
Marital status - Separated (%)
Marital status - Widowed (%)
Marital status - Divorced (%)
Ancestries Reported - Arab (%)
Ancestries Reported - Czech (%)
Ancestries Reported - Danish (%)
Ancestries Reported - Dutch (%)
Ancestries Reported - English (%)
Ancestries Reported - French (%)
Ancestries Reported - French Canadian (%)
Ancestries Reported - German (%)
Ancestries Reported - Greek (%)
Ancestries Reported - Hungarian (%)
Ancestries Reported - Irish (%)
Ancestries Reported - Italian (%)
Ancestries Reported - Lithuanian (%)
Ancestries Reported - Norwegian (%)
Ancestries Reported - Polish (%)
Ancestries Reported - Portuguese (%)
Ancestries Reported - Russian (%)
Ancestries Reported - Scotch-Irish (%)
Ancestries Reported - Scottish (%)
Ancestries Reported - Slovak (%)
Ancestries Reported - Subsaharan African (%)
Ancestries Reported - Swedish (%)
Ancestries Reported - Swiss (%)
Ancestries Reported - Ukrainian (%)
Ancestries Reported - United States (%)
Ancestries Reported - Welsh (%)
Ancestries Reported - West Indian (%)
Ancestries Reported - Other (%)
Geographical mobility - Same house 1 year ago (%)
Geographical mobility - Same house 1 year ago (%) - White
Geographical mobility - Same house 1 year ago (%) - Black or African American
Geographical mobility - Same house 1 year ago (%) - Asian
Geographical mobility - Same house 1 year ago (%) - Hispanic or Latino
Geographical mobility - Same house 1 year ago (%) - American Indian and Alaska Native
Geographical mobility - Same house 1 year ago (%) - Multirace
Geographical mobility - Same house 1 year ago (%) - Other Race
Geographical mobility - Moved within same county (%)
Geographical mobility - Moved within same county (%) - White
Geographical mobility - Moved within same county (%) - Black or African American
Geographical mobility - Moved within same county (%) - Asian
Geographical mobility - Moved within same county (%) - Hispanic or Latino
Geographical mobility - Moved within same county (%) - American Indian and Alaska Native
Geographical mobility - Moved within same county (%) - Multirace
Geographical mobility - Moved within same county (%) - Other Race
Geographical mobility - Moved from different county within same state (%)
Geographical mobility - Moved from different county within same state (%) - White
Geographical mobility - Moved from different county within same state (%) - Black or African American
Geographical mobility - Moved from different county within same state (%) - Asian
Geographical mobility - Moved from different county within same state (%) - Hispanic or Latino
Geographical mobility - Moved from different county within same state (%) - American Indian and Alaska Native
Geographical mobility - Moved from different county within same state (%) - Multirace
Geographical mobility - Moved from different county within same state (%) - Other Race
Geographical mobility - Moved from different state (%)
Geographical mobility - Moved from different state (%) - White
Geographical mobility - Moved from different state (%) - Black or African American
Geographical mobility - Moved from different state (%) - Asian
Geographical mobility - Moved from different state (%) - Hispanic or Latino
Geographical mobility - Moved from different state (%) - American Indian and Alaska Native
Geographical mobility - Moved from different state (%) - Multirace
Geographical mobility - Moved from different state (%) - Other Race
Geographical mobility - Moved from abroad (%)
Geographical mobility - Moved from abroad (%) - White
Geographical mobility - Moved from abroad (%) - Black or African American
Geographical mobility - Moved from abroad (%) - Asian
Geographical mobility - Moved from abroad (%) - Hispanic or Latino
Geographical mobility - Moved from abroad (%) - American Indian and Alaska Native
Geographical mobility - Moved from abroad (%) - Multirace
Geographical mobility - Moved from abroad (%) - Other Race
Place of birth for the foreign-born population - Ireland (%)
Place of birth for the foreign-born population - Denmark (%)
Place of birth for the foreign-born population - Norway (%)
Place of birth for the foreign-born population - Sweden (%)
Place of birth for the foreign-born population - United Kingdom (%)
Place of birth for the foreign-born population - England (%)
Place of birth for the foreign-born population - Scotland (%)
Place of birth for the foreign-born population - Other Northern Europe (%)
Place of birth for the foreign-born population - Austria (%)
Place of birth for the foreign-born population - Belgium (%)
Place of birth for the foreign-born population - France (%)
Place of birth for the foreign-born population - Germany (%)
Place of birth for the foreign-born population - Netherlands (%)
Place of birth for the foreign-born population - Switzerland (%)
Place of birth for the foreign-born population - Other Western Europe (%)
Place of birth for the foreign-born population - Greece (%)
Place of birth for the foreign-born population - Italy (%)
Place of birth for the foreign-born population - Portugal (%)
Place of birth for the foreign-born population - Spain (%)
Place of birth for the foreign-born population - Other Southern Europe (%)
Place of birth for the foreign-born population - Albania (%)
Place of birth for the foreign-born population - Belarus (%)
Place of birth for the foreign-born population - Bosnia and Herzegovina (%)
Place of birth for the foreign-born population - Bulgaria (%)
Place of birth for the foreign-born population - Croatia (%)
Place of birth for the foreign-born population - Czechoslovakia (%)
Place of birth for the foreign-born population - Hungary (%)
Place of birth for the foreign-born population - Latvia (%)
Place of birth for the foreign-born population - Lithuania (%)
Place of birth for the foreign-born population - North Macedonia (Macedonia) (%)
Place of birth for the foreign-born population - Moldova (%)
Place of birth for the foreign-born population - Poland (%)
Place of birth for the foreign-born population - Romania (%)
Place of birth for the foreign-born population - Russia (%)
Place of birth for the foreign-born population - Serbia (%)
Place of birth for the foreign-born population - Ukraine (%)
Place of birth for the foreign-born population - Other Eastern Europe (%)
Place of birth for the foreign-born population - China (%)
Place of birth for the foreign-born population - Hong Kong (%)
Place of birth for the foreign-born population - Taiwan (%)
Place of birth for the foreign-born population - Japan (%)
Place of birth for the foreign-born population - Korea (%)
Place of birth for the foreign-born population - Other Eastern Asia (%)
Place of birth for the foreign-born population - Afghanistan (%)
Place of birth for the foreign-born population - Bangladesh (%)
Place of birth for the foreign-born population - India (%)
Place of birth for the foreign-born population - Iran (%)
Place of birth for the foreign-born population - Kazakhstan (%)
Place of birth for the foreign-born population - Nepal (%)
Place of birth for the foreign-born population - Pakistan (%)
Place of birth for the foreign-born population - Sri Lanka (%)
Place of birth for the foreign-born population - Uzbekistan (%)
Place of birth for the foreign-born population - Other South Central Asia (%)
Place of birth for the foreign-born population - Burma (%)
Place of birth for the foreign-born population - Cambodia (%)
Place of birth for the foreign-born population - Indonesia (%)
Place of birth for the foreign-born population - Laos (%)
Place of birth for the foreign-born population - Malaysia (%)
Place of birth for the foreign-born population - Philippines (%)
Place of birth for the foreign-born population - Singapore (%)
Place of birth for the foreign-born population - Thailand (%)
Place of birth for the foreign-born population - Vietnam (%)
Place of birth for the foreign-born population - Other South Eastern Asia (%)
Place of birth for the foreign-born population - Armenia (%)
Place of birth for the foreign-born population - Iraq (%)
Place of birth for the foreign-born population - Israel (%)
Place of birth for the foreign-born population - Jordan (%)
Place of birth for the foreign-born population - Kuwait (%)
Place of birth for the foreign-born population - Lebanon (%)
Place of birth for the foreign-born population - Saudi Arabia (%)
Place of birth for the foreign-born population - Syria (%)
Place of birth for the foreign-born population - Turkey (%)
Place of birth for the foreign-born population - Yemen (%)
Place of birth for the foreign-born population - Other Western Asia (%)
Place of birth for the foreign-born population - Eritrea (%)
Place of birth for the foreign-born population - Ethiopia (%)
Place of birth for the foreign-born population - Kenya (%)
Place of birth for the foreign-born population - Somalia (%)
Place of birth for the foreign-born population - Uganda (%)
Place of birth for the foreign-born population - Zimbabwe (%)
Place of birth for the foreign-born population - Other Eastern Africa (%)
Place of birth for the foreign-born population - Cameroon (%)
Place of birth for the foreign-born population - Congo (%)
Place of birth for the foreign-born population - Democratic Republic of Congo (Zaire) (%)
Place of birth for the foreign-born population - Other Middle Africa (%)
Place of birth for the foreign-born population - Egypt (%)
Place of birth for the foreign-born population - Morocco (%)
Place of birth for the foreign-born population - Sudan (%)
Place of birth for the foreign-born population - Other Northern Africa (%)
Place of birth for the foreign-born population - South Africa (%)
Place of birth for the foreign-born population - Other Southern Africa (%)
Place of birth for the foreign-born population - Cabo Verde (%)
Place of birth for the foreign-born population - Ghana (%)
Place of birth for the foreign-born population - Liberia (%)
Place of birth for the foreign-born population - Nigeria (%)
Place of birth for the foreign-born population - Senegal (%)
Place of birth for the foreign-born population - Sierra Leone (%)
Place of birth for the foreign-born population - Other Western Africa (%)
Place of birth for the foreign-born population - Australia (%)
Place of birth for the foreign-born population - New Zealand (%)
Place of birth for the foreign-born population - Fiji (%)
Place of birth for the foreign-born population - Micronesia (%)
Place of birth for the foreign-born population - Bahamas (%)
Place of birth for the foreign-born population - Barbados (%)
Place of birth for the foreign-born population - Cuba (%)
Place of birth for the foreign-born population - Dominica (%)
Place of birth for the foreign-born population - Dominican Republic (%)
Place of birth for the foreign-born population - Grenada (%)
Place of birth for the foreign-born population - Haiti (%)
Place of birth for the foreign-born population - Jamaica (%)
Place of birth for the foreign-born population - St. Vincent and the Grenadines (%)
Place of birth for the foreign-born population - Trinidad and Tobago (%)
Place of birth for the foreign-born population - West Indies (%)
Place of birth for the foreign-born population - Other Caribbean (%)
Place of birth for the foreign-born population - Belize (%)
Place of birth for the foreign-born population - Costa Rica (%)
Place of birth for the foreign-born population - El Salvador (%)
Place of birth for the foreign-born population - Guatemala (%)
Place of birth for the foreign-born population - Honduras (%)
Place of birth for the foreign-born population - Mexico (%)
Place of birth for the foreign-born population - Nicaragua (%)
Place of birth for the foreign-born population - Panama (%)
Place of birth for the foreign-born population - Other Central America (%)
Place of birth for the foreign-born population - Argentina (%)
Place of birth for the foreign-born population - Bolivia (%)
Place of birth for the foreign-born population - Brazil (%)
Place of birth for the foreign-born population - Chile (%)
Place of birth for the foreign-born population - Colombia (%)
Place of birth for the foreign-born population - Ecuador (%)
Place of birth for the foreign-born population - Guyana (%)
Place of birth for the foreign-born population - Peru (%)
Place of birth for the foreign-born population - Uruguay (%)
Place of birth for the foreign-born population - Venezuela (%)
Place of birth for the foreign-born population - Other South America (%)
Place of birth for the foreign-born population - Canada (%)
Place of birth for the foreign-born population - Other Northern America (%)
Place of birth for the foreign-born population - Other (%)
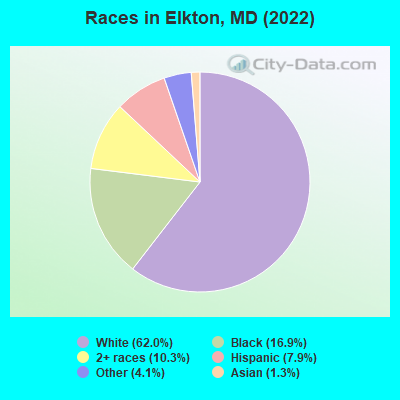
According to 2022 data, the most numerous races in Elkton, MD are White alone (9,910 residents), Black alone (2,710 residents), and Hispanic (1,267 residents). 88.9% of Elkton residents speak English at home. 6.3% of Elkton, MD residents are foreign-born (3.0% born in Asia, 2.0% born in Latin America, 0.6% born in Europe), which is 155.4% less than the foreign-born rate of 16.0% across the entire state of Maryland.
Race distribution in Elkton
2000 2022
3,286,547 62.1% White alone 1,464,735 27.7% Black alone 227,916 4.3% Hispanic 209,738 4.0% Asian alone 82,946 1.6% Two or more races 13,312 0.3% American Indian alone 9,379 0.2% Other race alone 1,913 0.04% Native Hawaiian and Other
2,906,492 47.1% White alone 1,800,914 29.2% Black alone 705,842 11.4% Hispanic 401,818 6.5% Asian alone 291,317 4.7% Two or more races 46,930 0.8% Other race alone 8,930 0.1% American Indian alone 2,417 0.04% Native Hawaiian and Other
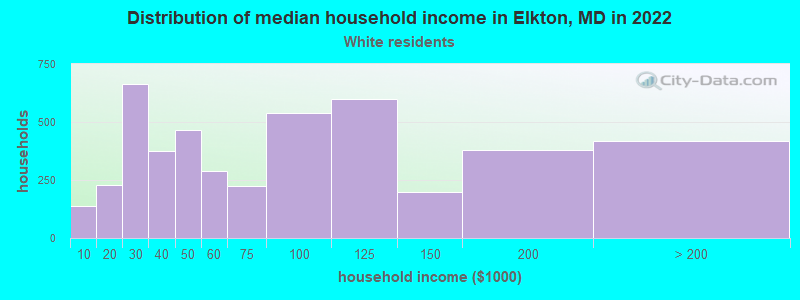
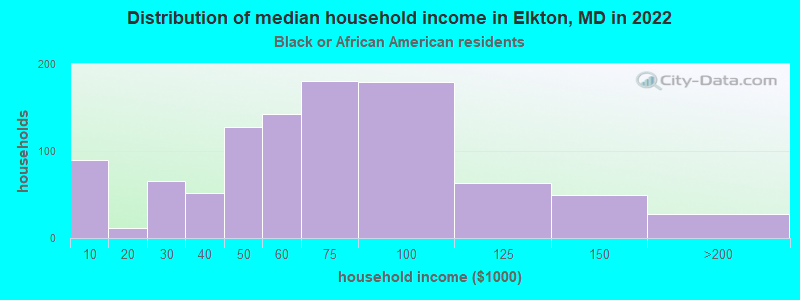
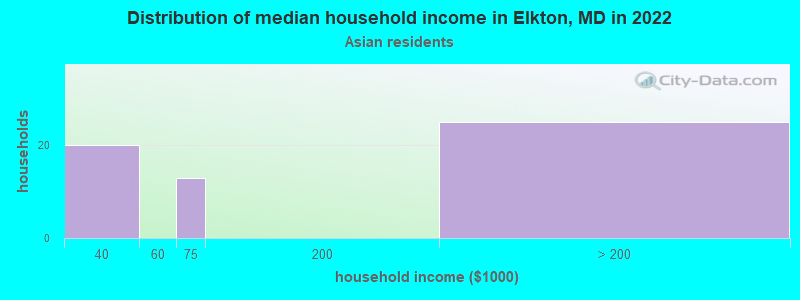
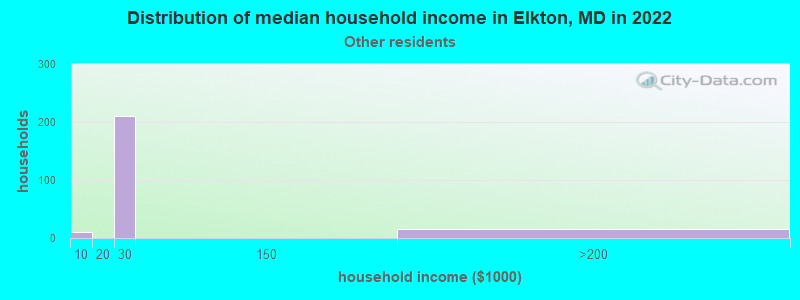
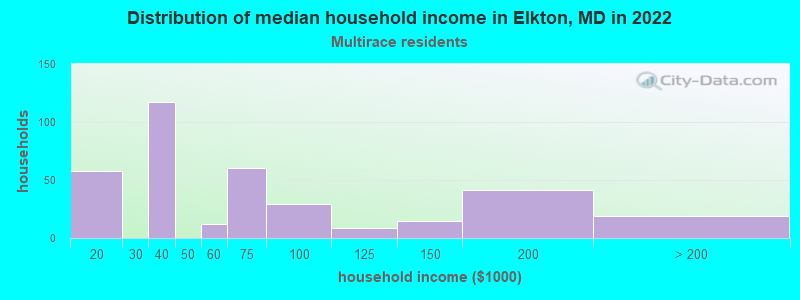
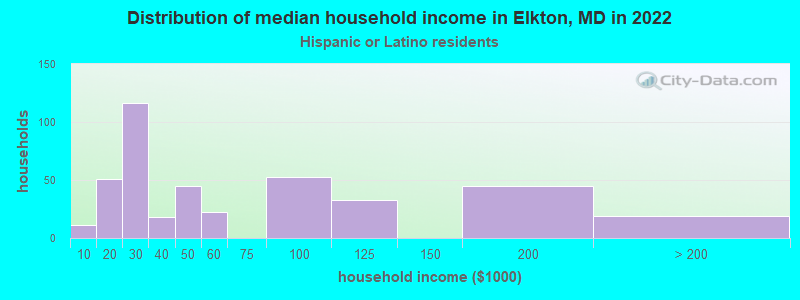
Income and house value in Elkton Median household income in 2022 $57,499 White non-Hispanic householders$50,143 Black householders$18,772 Some other race householders$52,407 Two or more races householders$30,414 Hispanic or Latino race householdersMedian 2022 house value $250,722 White Non-Hispanic householders$213,126 Black or African American householders $264,351 Asian householders$223,230 Some other race householders$241,323 Hispanic or Latino householders
Median age by race in Elkton
44.6 Median age for White residents44.9 45.3 34.9 Median age for Black or African American residents34.2 41.4 -662,169,757.6 Median age for American Indian / Alaska Native residents-667,768,594.4 -676,818,950.3 43.8 Median age for Asian residents49.0 46.9 -666,666,666.0 Median age for Native Hawaiian / Pacific Islander residents-666,666,666.0 -666,666,666.0 27.2 Median age for Other race residents26.2 27.8 16.7 Median age for Two or more races residents12.8 22.7 44.7 Median age for White alone residents45.7 45.2 38.5 Median age for Hispanic or Latino residents28.1 31.3
Owner/renter occupied households by race in Elkton
House owners and renters - White residents 2,672 58.5% Owner occupied1,899 41.5% Renter occupiedHouse owners and renters - Black or African American residents 192 22.4% Owner occupied665 77.6% Renter occupiedHouse owners and renters - Asian residents 67 100.0% Owner occupiedHouse owners and renters - Other race residents 22 10.3% Owner occupied190 89.7% Renter occupiedHouse owners and renters - Two or more races residents 143 57.6% Owner occupied105 42.4% Renter occupiedHouse owners and renters - White alone residents 2,603 58.3% Owner occupied1,860 41.7% Renter occupiedHouse owners and renters - Hispanic or Latino residents 157 34.6% Owner occupied297 65.4% Renter occupied
Language usage in Elkton
English speakers - Total 88.9% of residents of Elkton speak English at home.
4.5% of residents speak Spanish at home 334 49.6% Speak English very well339 50.4% Speak English less than very well6.1% of residents speak other language at home 555 60.3% Speak English very well366 39.7% Speak English less than very well
English speakers - Born in the United States 95.9% of residents of Elkton speak English at home.
2.7% of residents speak Spanish at home 146 71.2% Speak English very well59 28.8% Speak English less than very well1.1% of residents speak other language at home 73 90.1% Speak English very well8 9.9% Speak English less than very well
English speakers - Native, born elsewhere 48.9% of residents of Elkton speak English at home.
25.2% of residents speak Spanish at home 49 71.0% Speak English very well20 29.0% Speak English less than very well32.5% of residents speak other language at home 7 7.9% Speak English very well82 92.1% Speak English less than very well
English speakers - Foreign-born 9.2% of residents of Elkton speak English at home.
27.3% of residents speak Spanish at home 38 13.9% Speak English very well235 86.1% Speak English less than very well63.8% of residents speak other language at home 408 63.8% Speak English very well231 36.2% Speak English less than very well
White (Caucasian) - Speak only English Native:
97.3% (9,328)Foreign-born:
1.1% (4)
White (Caucasian) - Speak another language Native:
2.5% (244)Foreign-born:
66.3% (258)
Black or African American - Speak only English Native:
93.5% (2,089)Foreign-born:
21.7% (16)
Black or African American - Speak another language Native:
6.7% (149)Foreign-born:
79.0% (59)
Asian - Speak only English Native:
97.1% (2)Foreign-born:
30.6% (63)
Other race - Speak only English Native:
88.6% (642)Foreign-born:
15.6% (14)
Other race - Speak another language Native:
20.9% (152)Foreign-born:
82.8% (74)
Two or more races - Speak another language Native:
6.2% (105)Foreign-born:
100.0% (50)
White alone - Speak only English Native:
98.3% (9,275)Foreign-born:
1.4% (5)
White alone - Speak another language Native:
1.5% (144)Foreign-born:
77.9% (262)
Hispanic or Latino - Speak another language Native:
48.4% (422)Foreign-born:
100.0% (300)
Foreign-born residents in Elkton 1,002 residents are foreign born (3.0% Asia , 2.0% Latin America , 0.6% Europe ).
This city:
6.3%Maryland:
15.7%
Marital status for residents in Elkton Marital status - White (Caucasian) population 15 years and over
Males 35.9% Never married51.7% Now married0.9% Separated4.4% Widowed7.2% DivorcedFemales 28.8% Never married44.2% Now married0.8% Separated11.8% Widowed14.5% DivorcedWomen who gave birth in the past 12 months Now married:
60.8% (130)Unmarried:
39.2% (84)
Women who did not give birth in the past 12 months Now married:
45.1% (1,205)Unmarried:
54.9% (1,465)
Marital status - Black or African American population 15 years and over
Males 55.1% Never married27.4% Now married3.3% Separated0.0% Widowed14.2% DivorcedFemales 39.3% Never married27.2% Now married9.0% Separated3.6% Widowed20.8% DivorcedWomen who gave birth in the past 12 months Now married:
45.1% (23)Unmarried:
54.9% (27)
Women who did not give birth in the past 12 months Now married:
29.4% (141)Unmarried:
70.6% (339)
Marital status - Asian population 15 years and over
Males 19.3% Never married80.7% Now married0.0% Separated0.0% Widowed0.0% DivorcedFemales 0.0% Never married88.2% Now married0.0% Separated0.0% Widowed11.8% DivorcedWomen who did not give birth in the past 12 months Now married:
100.0% (80)Unmarried:
0.0% (0)
Marital status - Other race population 15 years and over
Males 71.7% Never married28.3% Now married0.0% Separated0.0% Widowed0.0% DivorcedFemales 69.4% Never married30.6% Now married0.0% Separated0.0% Widowed0.0% DivorcedWomen who did not give birth in the past 12 months Now married:
30.6% (96)Unmarried:
69.4% (219)
Marital status - Two or more races population 15 years and over
Males 66.4% Never married16.3% Now married1.7% Separated0.0% Widowed15.6% DivorcedFemales 60.0% Never married23.0% Now married0.0% Separated0.0% Widowed17.0% DivorcedWomen who did not give birth in the past 12 months Now married:
14.9% (80)Unmarried:
85.1% (457)
Marital status - White alone, not Hispanic / Latino population 15 years and over
Males 35.5% Never married51.3% Now married1.0% Separated4.6% Widowed7.6% DivorcedFemales 29.0% Never married43.9% Now married0.8% Separated11.7% Widowed14.7% DivorcedWomen who gave birth in the past 12 months Now married:
51.1% (88)Unmarried:
48.9% (84)
Women who did not give birth in the past 12 months Now married:
45.4% (1,214)Unmarried:
54.6% (1,462)
Marital status - Hispanic or Latino population 15 years and over
Males 43.2% Never married42.3% Now married0.0% Separated0.0% Widowed14.5% DivorcedFemales 30.5% Never married52.0% Now married0.0% Separated5.2% Widowed12.4% DivorcedWomen who gave birth in the past 12 months Now married:
100.0% (71)Unmarried:
0.0% (0)
Women who did not give birth in the past 12 months Now married:
43.0% (104)Unmarried:
57.0% (138)
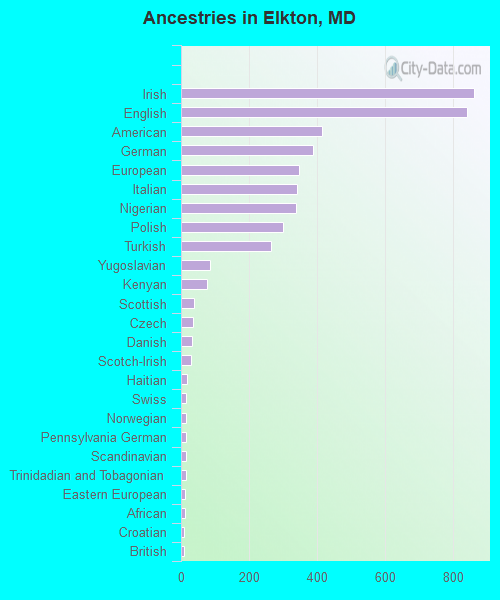
Ancestries in Elkton
864 11.9% Irish841 11.6% English416 5.7% American390 5.4% German347 4.8% European341 4.7% Italian340 4.7% Nigerian301 4.1% Polish266 3.7% Turkish85 1.2% Yugoslavian78 1.1% Kenyan39 0.5% Scottish36 0.5% Czech32 0.4% Danish28 0.4% Scotch-Irish18 0.2% Haitian16 0.2% Swiss14 0.2% Norwegian14 0.2% Pennsylvania German14 0.2% Scandinavian14 0.2% Trinidadian and Tobagonian13 0.2% Eastern European13 0.2% African10 0.1% Croatian9 0.1% British8 0.1% Ukrainian6 0.08% French2 0.03% Sierra Leonean
Children Nativity (place of birth) in Elkton
Children under 6 years - Living with two parents Both parents native 266 100.0% NativeBoth parents foreign-born 127 100.0% NativeOne native, one foreign-born parent 20 100.0% NativeChildren under 6 years - Living with one parent Native parent 337 100.0% NativeForeign-born parent 27 100.0% NativeChildren 6 to 17 years - Living with two parents Both parents native 699 99.8% Native1 0.2% Foreign-bornBoth parents foreign-born 81 49.6% Native82 50.4% Foreign-bornOne native, one foreign-born parent 135 100.0% NativeChildren 6 to 17 years - Living with one parent Native parent 950 100.0% NativeForeign-born parent 41 50.9% Native39 49.1% Foreign-born
Grandparents responsible for own grandchildren in Elkton
Grandparents (30 to 59 years) White / Caucasian 146 100.0% Responsible for grandchildrenBlack or African American 16 100.0% Not responsible for grandchildrenAsian 16 100.0% Not responsible for grandchildrenTwo or more races 28 100.0% Responsible for grandchildrenWhite alone, not Hispanic / Latino 149 100.0% Responsible for grandchildrenHispanic or Latino 23 100.0% Responsible for grandchildrenGrandparents (60 years and over) White / Caucasian 23 13.3% Responsible for grandchildren148 86.7% Not responsible for grandchildrenBlack or African American 2 100.0% Responsible for grandchildrenAsian 27 100.0% Not responsible for grandchildrenWhite alone, not Hispanic / Latino 23 14.1% Responsible for grandchildren138 85.9% Not responsible for grandchildrenHispanic or Latino 16 100.0% Not responsible for grandchildren