Races in Elk River, Minnesota (MN) Detailed Stats
Data:
Races - White alone (%)
Races - White alone (% change since 2000)
Races - Black alone (%)
Races - Black alone (% change since 2000)
Races - American Indian alone (%)
Races - American Indian alone (% change since 2000)
Races - Asian alone (%)
Races - Asian alone (% change since 2000)
Races - Hispanic (%)
Races - Hispanic (% change since 2000)
Races - Native Hawaiian and Other Pacific Islander alone (%)
Races - Native Hawaiian and Other Pacific Islander alone (% change since 2000)
Races - Two or more races(%)
Races - Two or more races(% change since 2000)
Races - Other race alone (%)
Races - Other race alone (% change since 2000)
Racial diversity
Place of birth - Born in state of residence (%)
Place of birth - Born in state of residence (%) - White
Place of birth - Born in state of residence (%) - Black or African American
Place of birth - Born in state of residence (%) - Asian
Place of birth - Born in state of residence (%) - Hispanic or Latino
Place of birth - Born in state of residence (%) - American Indian and Alaska Native
Place of birth - Born in state of residence (%) - Multirace
Place of birth - Born in state of residence (%) - Other Race
Place of birth - Born in other state (%)
Place of birth - Born in other state (%) - White
Place of birth - Born in other state (%) - Black or African American
Place of birth - Born in other state (%) - Asian
Place of birth - Born in other state (%) - Hispanic or Latino
Place of birth - Born in other state (%) - American Indian and Alaska Native
Place of birth - Born in other state (%) - Multirace
Place of birth - Born in other state (%) - Other Race
Place of birth - Native, outside of US (%)
Place of birth - Native, outside of US (%) - White
Place of birth - Native, outside of US (%) - Black or African American
Place of birth - Native, outside of US (%) - Asian
Place of birth - Native, outside of US (%) - Hispanic or Latino
Place of birth - Native, outside of US (%) - American Indian and Alaska Native
Place of birth - Native, outside of US (%) - Multirace
Place of birth - Native, outside of US (%) - Other Race
Place of birth - Foreign born (%)
Place of birth - Foreign born (%) - White
Place of birth - Foreign born (%) - Black or African American
Place of birth - Foreign born (%) - Asian
Place of birth - Foreign born (%) - Hispanic or Latino
Place of birth - Foreign born (%) - American Indian and Alaska Native
Place of birth - Foreign born (%) - Multirace
Place of birth - Foreign born (%) - Other Race
Residents speaking English at home (%)
Residents speaking English at home - Born in the United States (%)
Residents speaking English at home - Native, born elsewhere (%)
Residents speaking English at home - Foreign born (%)
Residents speaking Spanish at home (%)
Residents speaking Spanish at home - Born in the United States (%)
Residents speaking Spanish at home - Native, born elsewhere (%)
Residents speaking Spanish at home - Foreign born (%)
Residents speaking other language at home (%)
Residents speaking other language at home - Born in the United States (%)
Residents speaking other language at home - Native, born elsewhere (%)
Residents speaking other language at home - Foreign born (%)
Marital status - Never married (%)
Marital status - Now married (%)
Marital status - Separated (%)
Marital status - Widowed (%)
Marital status - Divorced (%)
Ancestries Reported - Arab (%)
Ancestries Reported - Czech (%)
Ancestries Reported - Danish (%)
Ancestries Reported - Dutch (%)
Ancestries Reported - English (%)
Ancestries Reported - French (%)
Ancestries Reported - French Canadian (%)
Ancestries Reported - German (%)
Ancestries Reported - Greek (%)
Ancestries Reported - Hungarian (%)
Ancestries Reported - Irish (%)
Ancestries Reported - Italian (%)
Ancestries Reported - Lithuanian (%)
Ancestries Reported - Norwegian (%)
Ancestries Reported - Polish (%)
Ancestries Reported - Portuguese (%)
Ancestries Reported - Russian (%)
Ancestries Reported - Scotch-Irish (%)
Ancestries Reported - Scottish (%)
Ancestries Reported - Slovak (%)
Ancestries Reported - Subsaharan African (%)
Ancestries Reported - Swedish (%)
Ancestries Reported - Swiss (%)
Ancestries Reported - Ukrainian (%)
Ancestries Reported - United States (%)
Ancestries Reported - Welsh (%)
Ancestries Reported - West Indian (%)
Ancestries Reported - Other (%)
Geographical mobility - Same house 1 year ago (%)
Geographical mobility - Same house 1 year ago (%) - White
Geographical mobility - Same house 1 year ago (%) - Black or African American
Geographical mobility - Same house 1 year ago (%) - Asian
Geographical mobility - Same house 1 year ago (%) - Hispanic or Latino
Geographical mobility - Same house 1 year ago (%) - American Indian and Alaska Native
Geographical mobility - Same house 1 year ago (%) - Multirace
Geographical mobility - Same house 1 year ago (%) - Other Race
Geographical mobility - Moved within same county (%)
Geographical mobility - Moved within same county (%) - White
Geographical mobility - Moved within same county (%) - Black or African American
Geographical mobility - Moved within same county (%) - Asian
Geographical mobility - Moved within same county (%) - Hispanic or Latino
Geographical mobility - Moved within same county (%) - American Indian and Alaska Native
Geographical mobility - Moved within same county (%) - Multirace
Geographical mobility - Moved within same county (%) - Other Race
Geographical mobility - Moved from different county within same state (%)
Geographical mobility - Moved from different county within same state (%) - White
Geographical mobility - Moved from different county within same state (%) - Black or African American
Geographical mobility - Moved from different county within same state (%) - Asian
Geographical mobility - Moved from different county within same state (%) - Hispanic or Latino
Geographical mobility - Moved from different county within same state (%) - American Indian and Alaska Native
Geographical mobility - Moved from different county within same state (%) - Multirace
Geographical mobility - Moved from different county within same state (%) - Other Race
Geographical mobility - Moved from different state (%)
Geographical mobility - Moved from different state (%) - White
Geographical mobility - Moved from different state (%) - Black or African American
Geographical mobility - Moved from different state (%) - Asian
Geographical mobility - Moved from different state (%) - Hispanic or Latino
Geographical mobility - Moved from different state (%) - American Indian and Alaska Native
Geographical mobility - Moved from different state (%) - Multirace
Geographical mobility - Moved from different state (%) - Other Race
Geographical mobility - Moved from abroad (%)
Geographical mobility - Moved from abroad (%) - White
Geographical mobility - Moved from abroad (%) - Black or African American
Geographical mobility - Moved from abroad (%) - Asian
Geographical mobility - Moved from abroad (%) - Hispanic or Latino
Geographical mobility - Moved from abroad (%) - American Indian and Alaska Native
Geographical mobility - Moved from abroad (%) - Multirace
Geographical mobility - Moved from abroad (%) - Other Race
Place of birth for the foreign-born population - Ireland (%)
Place of birth for the foreign-born population - Denmark (%)
Place of birth for the foreign-born population - Norway (%)
Place of birth for the foreign-born population - Sweden (%)
Place of birth for the foreign-born population - United Kingdom (%)
Place of birth for the foreign-born population - England (%)
Place of birth for the foreign-born population - Scotland (%)
Place of birth for the foreign-born population - Other Northern Europe (%)
Place of birth for the foreign-born population - Austria (%)
Place of birth for the foreign-born population - Belgium (%)
Place of birth for the foreign-born population - France (%)
Place of birth for the foreign-born population - Germany (%)
Place of birth for the foreign-born population - Netherlands (%)
Place of birth for the foreign-born population - Switzerland (%)
Place of birth for the foreign-born population - Other Western Europe (%)
Place of birth for the foreign-born population - Greece (%)
Place of birth for the foreign-born population - Italy (%)
Place of birth for the foreign-born population - Portugal (%)
Place of birth for the foreign-born population - Spain (%)
Place of birth for the foreign-born population - Other Southern Europe (%)
Place of birth for the foreign-born population - Albania (%)
Place of birth for the foreign-born population - Belarus (%)
Place of birth for the foreign-born population - Bosnia and Herzegovina (%)
Place of birth for the foreign-born population - Bulgaria (%)
Place of birth for the foreign-born population - Croatia (%)
Place of birth for the foreign-born population - Czechoslovakia (%)
Place of birth for the foreign-born population - Hungary (%)
Place of birth for the foreign-born population - Latvia (%)
Place of birth for the foreign-born population - Lithuania (%)
Place of birth for the foreign-born population - North Macedonia (Macedonia) (%)
Place of birth for the foreign-born population - Moldova (%)
Place of birth for the foreign-born population - Poland (%)
Place of birth for the foreign-born population - Romania (%)
Place of birth for the foreign-born population - Russia (%)
Place of birth for the foreign-born population - Serbia (%)
Place of birth for the foreign-born population - Ukraine (%)
Place of birth for the foreign-born population - Other Eastern Europe (%)
Place of birth for the foreign-born population - China (%)
Place of birth for the foreign-born population - Hong Kong (%)
Place of birth for the foreign-born population - Taiwan (%)
Place of birth for the foreign-born population - Japan (%)
Place of birth for the foreign-born population - Korea (%)
Place of birth for the foreign-born population - Other Eastern Asia (%)
Place of birth for the foreign-born population - Afghanistan (%)
Place of birth for the foreign-born population - Bangladesh (%)
Place of birth for the foreign-born population - India (%)
Place of birth for the foreign-born population - Iran (%)
Place of birth for the foreign-born population - Kazakhstan (%)
Place of birth for the foreign-born population - Nepal (%)
Place of birth for the foreign-born population - Pakistan (%)
Place of birth for the foreign-born population - Sri Lanka (%)
Place of birth for the foreign-born population - Uzbekistan (%)
Place of birth for the foreign-born population - Other South Central Asia (%)
Place of birth for the foreign-born population - Burma (%)
Place of birth for the foreign-born population - Cambodia (%)
Place of birth for the foreign-born population - Indonesia (%)
Place of birth for the foreign-born population - Laos (%)
Place of birth for the foreign-born population - Malaysia (%)
Place of birth for the foreign-born population - Philippines (%)
Place of birth for the foreign-born population - Singapore (%)
Place of birth for the foreign-born population - Thailand (%)
Place of birth for the foreign-born population - Vietnam (%)
Place of birth for the foreign-born population - Other South Eastern Asia (%)
Place of birth for the foreign-born population - Armenia (%)
Place of birth for the foreign-born population - Iraq (%)
Place of birth for the foreign-born population - Israel (%)
Place of birth for the foreign-born population - Jordan (%)
Place of birth for the foreign-born population - Kuwait (%)
Place of birth for the foreign-born population - Lebanon (%)
Place of birth for the foreign-born population - Saudi Arabia (%)
Place of birth for the foreign-born population - Syria (%)
Place of birth for the foreign-born population - Turkey (%)
Place of birth for the foreign-born population - Yemen (%)
Place of birth for the foreign-born population - Other Western Asia (%)
Place of birth for the foreign-born population - Eritrea (%)
Place of birth for the foreign-born population - Ethiopia (%)
Place of birth for the foreign-born population - Kenya (%)
Place of birth for the foreign-born population - Somalia (%)
Place of birth for the foreign-born population - Uganda (%)
Place of birth for the foreign-born population - Zimbabwe (%)
Place of birth for the foreign-born population - Other Eastern Africa (%)
Place of birth for the foreign-born population - Cameroon (%)
Place of birth for the foreign-born population - Congo (%)
Place of birth for the foreign-born population - Democratic Republic of Congo (Zaire) (%)
Place of birth for the foreign-born population - Other Middle Africa (%)
Place of birth for the foreign-born population - Egypt (%)
Place of birth for the foreign-born population - Morocco (%)
Place of birth for the foreign-born population - Sudan (%)
Place of birth for the foreign-born population - Other Northern Africa (%)
Place of birth for the foreign-born population - South Africa (%)
Place of birth for the foreign-born population - Other Southern Africa (%)
Place of birth for the foreign-born population - Cabo Verde (%)
Place of birth for the foreign-born population - Ghana (%)
Place of birth for the foreign-born population - Liberia (%)
Place of birth for the foreign-born population - Nigeria (%)
Place of birth for the foreign-born population - Senegal (%)
Place of birth for the foreign-born population - Sierra Leone (%)
Place of birth for the foreign-born population - Other Western Africa (%)
Place of birth for the foreign-born population - Australia (%)
Place of birth for the foreign-born population - New Zealand (%)
Place of birth for the foreign-born population - Fiji (%)
Place of birth for the foreign-born population - Micronesia (%)
Place of birth for the foreign-born population - Bahamas (%)
Place of birth for the foreign-born population - Barbados (%)
Place of birth for the foreign-born population - Cuba (%)
Place of birth for the foreign-born population - Dominica (%)
Place of birth for the foreign-born population - Dominican Republic (%)
Place of birth for the foreign-born population - Grenada (%)
Place of birth for the foreign-born population - Haiti (%)
Place of birth for the foreign-born population - Jamaica (%)
Place of birth for the foreign-born population - St. Vincent and the Grenadines (%)
Place of birth for the foreign-born population - Trinidad and Tobago (%)
Place of birth for the foreign-born population - West Indies (%)
Place of birth for the foreign-born population - Other Caribbean (%)
Place of birth for the foreign-born population - Belize (%)
Place of birth for the foreign-born population - Costa Rica (%)
Place of birth for the foreign-born population - El Salvador (%)
Place of birth for the foreign-born population - Guatemala (%)
Place of birth for the foreign-born population - Honduras (%)
Place of birth for the foreign-born population - Mexico (%)
Place of birth for the foreign-born population - Nicaragua (%)
Place of birth for the foreign-born population - Panama (%)
Place of birth for the foreign-born population - Other Central America (%)
Place of birth for the foreign-born population - Argentina (%)
Place of birth for the foreign-born population - Bolivia (%)
Place of birth for the foreign-born population - Brazil (%)
Place of birth for the foreign-born population - Chile (%)
Place of birth for the foreign-born population - Colombia (%)
Place of birth for the foreign-born population - Ecuador (%)
Place of birth for the foreign-born population - Guyana (%)
Place of birth for the foreign-born population - Peru (%)
Place of birth for the foreign-born population - Uruguay (%)
Place of birth for the foreign-born population - Venezuela (%)
Place of birth for the foreign-born population - Other South America (%)
Place of birth for the foreign-born population - Canada (%)
Place of birth for the foreign-born population - Other Northern America (%)
Place of birth for the foreign-born population - Other (%)
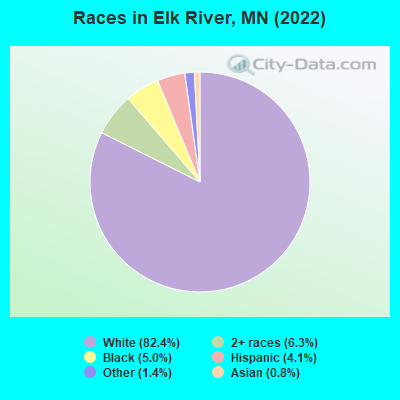
According to 2022 data, the most numerous races in Elk River, MN are White alone (22,031 residents), Black alone (1,347 residents), and Hispanic (1,102 residents). 93.8% of Elk River residents speak English at home. 5.0% of Elk River, MN residents are foreign-born (1.6% born in Africa, 1.3% born in Europe, 1.0% born in Latin America, 0.9% born in Asia), which is 61.4% less than the foreign-born rate of 8.0% across the entire state of Minnesota.
Race distribution in Elk River
2000 2022
4,337,143 88.2% White alone 168,813 3.4% Black alone 143,382 2.9% Hispanic 141,083 2.9% Asian alone 70,304 1.4% Two or more races 52,009 1.1% American Indian alone 5,031 0.1% Other race alone 1,714 0.03% Native Hawaiian and Other
4,356,347 76.2% White alone 395,179 6.9% Black alone 333,830 5.8% Hispanic 294,800 5.2% Asian alone 259,649 4.5% Two or more races 42,125 0.7% American Indian alone 32,976 0.6% Other race alone 2,278 0.04% Native Hawaiian and Other
Income and house value in Elk River Median household income in 2022 $94,858 White non-Hispanic householders$127,340 Black householders$119,897 Asian householders$3,446 Some other race householders$174,339 Two or more races householders$86,440 Hispanic or Latino race householdersMedian 2022 house value $336,775 White Non-Hispanic householders$261,652 Two or more races householders$523,304 Hispanic or Latino householders
Median age by race in Elk River
37.5 Median age for White residents35.3 40.2 27.9 Median age for Black or African American residents31.4 20.3 40.3 Median age for American Indian / Alaska Native residents39.7 -677,852,348.3 52.3 Median age for Asian residents30.2 59.9 -666,666,666.0 Median age for Native Hawaiian / Pacific Islander residents-666,666,666.0 -666,666,666.0 24.7 Median age for Other race residents49.4 15.9 20.9 Median age for Two or more races residents21.2 23.6 37.8 Median age for White alone residents35.3 40.2 25.1 Median age for Hispanic or Latino residents24.8 33.3
Owner/renter occupied households by race in Elk River
House owners and renters - White residents 7,142 82.2% Owner occupied1,543 17.8% Renter occupiedHouse owners and renters - Black or African American residents 100 57.8% Owner occupied73 42.2% Renter occupiedHouse owners and renters - Asian residents 40 55.0% Owner occupied33 45.0% Renter occupiedHouse owners and renters - Other race residents 292 87.1% Owner occupied43 12.9% Renter occupiedHouse owners and renters - Two or more races residents 135 44.9% Owner occupied166 55.1% Renter occupiedHouse owners and renters - White alone residents 7,072 82.7% Owner occupied1,483 17.3% Renter occupiedHouse owners and renters - Hispanic or Latino residents 112 48.4% Owner occupied119 51.6% Renter occupied
Language usage in Elk River
English speakers - Total 93.8% of residents of Elk River speak English at home.
2.9% of residents speak Spanish at home 326 44.4% Speak English very well408 55.6% Speak English less than very well3.3% of residents speak other language at home 552 67.3% Speak English very well268 32.7% Speak English less than very well
English speakers - Born in the United States 97.3% of residents of Elk River speak English at home.
2.5% of residents speak Spanish at home 129 97.7% Speak English very well3 2.3% Speak English less than very well0.3% of residents speak other language at home 15 100.0% Speak English very well
English speakers - Native, born elsewhere 46.9% of residents of Elk River speak English at home.
23.8% of residents speak Spanish at home 31 100.0% Speak English very well
English speakers - Foreign-born 21.5% of residents of Elk River speak English at home.
23.7% of residents speak Spanish at home 16 5.6% Speak English very well271 94.4% Speak English less than very well57.0% of residents speak other language at home 433 62.6% Speak English very well259 37.4% Speak English less than very well
White (Caucasian) - Speak only English Native:
98.9% (20,344)Foreign-born:
46.4% (209)
White (Caucasian) - Speak another language Native:
1.1% (227)Foreign-born:
46.5% (209)
Black or African American - Speak only English Native:
94.4% (506)Foreign-born:
5.4% (24)
Black or African American - Speak another language Native:
3.3% (18)Foreign-born:
96.1% (432)
Asian - Speak only English Native:
100.0% (55)Foreign-born:
38.7% (94)
Other race - Speak another language Native:
11.3% (54)Foreign-born:
97.5% (238)
Two or more races - Speak only English Native:
98.8% (1,577)Foreign-born:
86.9% (9)
White alone - Speak only English Native:
99.3% (20,223)Foreign-born:
48.7% (210)
White alone - Speak another language Native:
0.7% (142)Foreign-born:
60.2% (260)
Hispanic or Latino - Speak another language Native:
23.3% (152)Foreign-born:
96.9% (231)
Foreign-born residents in Elk River 1,325 residents are foreign born (1.6% Africa , 1.3% Europe , 1.0% Latin America , 0.9% Asia ).
This city:
5.0%Minnesota:
8.5%
Marital status for residents in Elk River Marital status - White (Caucasian) population 15 years and over
Males 36.0% Never married51.3% Now married1.1% Separated4.4% Widowed7.3% DivorcedFemales 27.6% Never married48.9% Now married1.3% Separated8.9% Widowed13.3% DivorcedWomen who gave birth in the past 12 months Now married:
57.2% (190)Unmarried:
42.8% (142)
Women who did not give birth in the past 12 months Now married:
44.8% (2,143)Unmarried:
55.2% (2,639)
Marital status - Black or African American population 15 years and over
Males 42.1% Never married57.9% Now married0.0% Separated0.0% Widowed0.0% DivorcedFemales 40.6% Never married43.9% Now married0.0% Separated14.2% Widowed1.2% DivorcedWomen who gave birth in the past 12 months Now married:
100.0% (41)Unmarried:
0.0% (0)
Women who did not give birth in the past 12 months Now married:
23.9% (43)Unmarried:
76.1% (138)
Marital status - Asian population 15 years and over
Males 62.8% Never married34.9% Now married0.0% Separated0.0% Widowed2.3% DivorcedFemales 46.8% Never married36.5% Now married0.0% Separated0.0% Widowed16.7% DivorcedWomen who did not give birth in the past 12 months Now married:
23.8% (32)Unmarried:
76.2% (102)
Marital status - Other race population 15 years and over
Males 39.9% Never married47.4% Now married0.0% Separated0.0% Widowed12.8% DivorcedFemales 65.6% Never married34.4% Now married0.0% Separated0.0% Widowed0.0% DivorcedWomen who gave birth in the past 12 months Now married:
100.0% (33)Unmarried:
0.0% (0)
Women who did not give birth in the past 12 months Now married:
21.2% (52)Unmarried:
78.8% (195)
Marital status - Two or more races population 15 years and over
Males 72.2% Never married22.9% Now married0.0% Separated0.0% Widowed5.0% DivorcedFemales 39.8% Never married47.0% Now married0.0% Separated3.8% Widowed9.4% DivorcedWomen who did not give birth in the past 12 months Now married:
48.5% (324)Unmarried:
51.5% (343)
Marital status - White alone, not Hispanic / Latino population 15 years and over
Males 35.9% Never married51.4% Now married1.0% Separated4.4% Widowed7.3% DivorcedFemales 27.1% Never married49.2% Now married1.1% Separated9.1% Widowed13.5% DivorcedWomen who gave birth in the past 12 months Now married:
57.2% (190)Unmarried:
42.8% (142)
Women who did not give birth in the past 12 months Now married:
45.0% (2,095)Unmarried:
55.0% (2,559)
Marital status - Hispanic or Latino population 15 years and over
Males 51.7% Never married37.7% Now married1.5% Separated0.0% Widowed9.1% DivorcedFemales 38.3% Never married54.1% Now married7.6% Separated0.0% Widowed0.0% DivorcedWomen who gave birth in the past 12 months Now married:
100.0% (27)Unmarried:
0.0% (0)
Women who did not give birth in the past 12 months Now married:
49.1% (114)Unmarried:
50.9% (118)
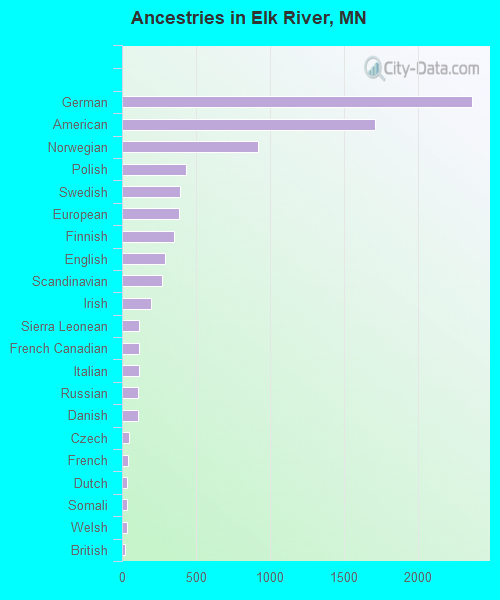
Ancestries in Elk River
2,363 23.0% German1,713 16.7% American921 9.0% Norwegian434 4.2% Polish389 3.8% Swedish385 3.7% European353 3.4% Finnish290 2.8% English273 2.7% Scandinavian194 1.9% Irish118 1.1% Sierra Leonean117 1.1% French Canadian113 1.1% Italian109 1.1% Russian108 1.1% Danish48 0.5% Czech43 0.4% French37 0.4% Dutch33 0.3% Somali32 0.3% Welsh22 0.2% British19 0.2% Northern European18 0.2% African18 0.2% Ukrainian12 0.1% Sudanese10 0.10% Nigerian8 0.08% Hungarian7 0.07% Scottish4 0.04% Liberian3 0.03% Greek2 0.02% Arab
Geographical mobility in Elk River Same house 1 year ago 19,227 87.4% White (Caucasian)736 54.7% Black or African American6 20.4% American Indian / Alaska Native295 98.6% Asian669 85.4% Other race1,632 84.9% Two or more races19,041 87.5% White alone, not Hispanic / Latino678 69.5% Hispanic or LatinoMoved within same county 638 2.9% White / Caucasian17 0.9% Two or more races652 3.0% White alone, not Hispanic / LatinoMoved within same state 1,705 7.8% White / Caucasian71 5.3% Black or African American27 85.4% American Indian / Alaska Native103 13.2% Other race243 12.7% Two or more races1,719 7.9% White alone, not Hispanic / Latino140 14.3% Hispanic or LatinoMoved from different state 469 2.1% White / Caucasian30 2.2% Black or African American8 2.6% Asian7 0.9% Other race22 1.2% Two or more races368 1.7% White alone, not Hispanic / Latino142 14.6% Hispanic or LatinoMoved from abroad 17 0.1% White185 13.7% Black or African American20 2.6% Other race18 0.1% White alone, not Hispanic / Latino21 2.1% Hispanic or Latino
Children Nativity (place of birth) in Elk River
Children under 6 years - Living with two parents Both parents native 1,343 100.0% Native1 0.0% Foreign-bornBoth parents foreign-born 127 89.7% Native15 10.3% Foreign-bornOne native, one foreign-born parent 19 100.0% NativeChildren under 6 years - Living with one parent Native parent 484 100.0% NativeChildren 6 to 17 years - Living with two parents Both parents native 2,294 99.6% Native10 0.4% Foreign-bornBoth parents foreign-born 79 56.8% Native60 43.2% Foreign-bornOne native, one foreign-born parent 230 100.0% NativeChildren 6 to 17 years - Living with one parent Native parent 1,282 100.0% Native
Grandparents responsible for own grandchildren in Elk River
Grandparents (30 to 59 years) White / Caucasian 76 45.0% Responsible for grandchildren93 55.0% Not responsible for grandchildrenWhite alone, not Hispanic / Latino 76 45.0% Responsible for grandchildren93 55.0% Not responsible for grandchildrenGrandparents (60 years and over) White / Caucasian 21 27.6% Responsible for grandchildren56 72.4% Not responsible for grandchildrenWhite alone, not Hispanic / Latino 21 27.6% Responsible for grandchildren56 72.4% Not responsible for grandchildren