Races in Elk City, Oklahoma (OK) Detailed Stats
Ancestries, Foreign-born residents, place of birth
Settings
X


Recent posts about races in Elk City, Oklahoma on our local forum with over 2,400,000 registered users:
 | Relocating to Elk City, OK (13 replies) |
| Where do we live?? Moving from WA (16 replies) |
| Californians Moving to Oklahoma (104 replies) |
| Fastest growing city in Ok by 2040 (10 replies) |
| OK Route 66 in a 56-Year Old 356: what are your Route 66 “must see” spots in Oklahoma? (19 replies) |
| Moving to Cheyenne - Elk City Area (22 replies) |
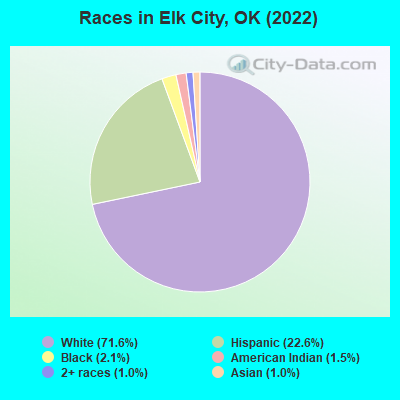
According to 2022 data, the most numerous races in Elk City, OK are White alone (8,331 residents), Hispanic (2,630 residents), and Two or more races (116 residents). 84.2% of Elk City residents speak English at home. 8.4% of Elk City, OK residents are foreign-born (7.7% born in Latin America), which is 28.5% greater than the foreign-born rate of 6.0% across the entire state of Oklahoma.
Race distribution in Elk City
2000
2022

- 9,04986.1%White alone
- 6266.0%Hispanic
- 3123.0%Black alone
- 2942.8%American Indian alone
- 1631.6%Two or more races
- 570.5%Asian alone
- 70.07%Other race alone
- 20.02%Native Hawaiian and Other
Pacific Islander alone

-
- 8,33171.6%White alone
- 2,63022.6%Hispanic
- 2412.1%Black alone
- 1741.5%American Indian alone
- 1161.0%Two or more races
- 1151.0%Asian alone
2000
2022
-
- 2,556,36874.1%White alone
- 266,1587.7%American Indian alone
- 257,9817.5%Black alone
- 179,3045.2%Hispanic
- 140,2494.1%Two or more races
- 46,1721.3%Asian alone
- 2,3220.07%Other race alone
- 2,1000.06%Native Hawaiian and Other
Pacific Islander alone

-
- 2,517,40362.6%White alone
- 486,69212.1%Hispanic
- 364,4539.1%Two or more races
- 273,6506.8%American Indian alone
- 268,5436.7%Black alone
- 92,6722.3%Asian alone
- 10,7860.3%Other race alone
- 5,6010.1%Native Hawaiian and Other
Pacific Islander alone

Income and house value in Elk City
- Median household income in 2022
- $46,262White non-Hispanic householders
- $28,307Black householders
- $80,171American Indian and Alaska Native householders
- $45,936Hispanic or Latino race householders
- Median 2022 house value
- $203,295White Non-Hispanic householders
- $45,001Black or African American householders
- $81,821American Indian or Alaska Native householders
- $70,807Asian householders
- $31,466Some other race householders
- $40,910Two or more races householders
- $96,612Hispanic or Latino householders
Household income for White non-Hispanic householders

Household income for Black householders

Household income for American Indian and Alaska Native householders

Household income for Asian householders

Household income for Some other race householders

Household income for Two or more races householders

Household income for Hispanic or Latino race householders

Median age by race in Elk City
- 34.7Median age for White residents
- 32.0Males
- 37.7Females
- 18.9Median age for Black or African American residents
- 26.7Males
- 1.9Females
- 53.2Median age for American Indian / Alaska Native residents
- 9.5Males
- 54.9Females
- 29.4Median age for Asian residents
- 29.1Males
- -666,666,666.0Females
- -725,225,224.5Median age for Native Hawaiian / Pacific Islander residents
- -675,324,674.6Males
- -767,251,461.2Females
- 53.0Median age for Other race residents
- 61.0Males
- 53.2Females
- 30.6Median age for Two or more races residents
- 38.1Males
- 25.7Females
- 39.3Median age for White alone residents
- 37.6Males
- 42.9Females
- 26.0Median age for Hispanic or Latino residents
- 31.1Males
- 14.2Females
Owner/renter occupied households by race in Elk City
- House owners and renters - White residents
- 2,76362.5%Owner occupied
- 1,66037.5%Renter occupied
- House owners and renters - Black or African American residents
- 10690.5%Owner occupied
- 119.5%Renter occupied
- House owners and renters - American Indian / Alaska Native residents
- 4881.1%Owner occupied
- 1118.9%Renter occupied
- House owners and renters - Asian residents
- 615.4%Owner occupied
- 3484.6%Renter occupied
- House owners and renters - Other race residents
- 5239.6%Owner occupied
- 8060.4%Renter occupied
- House owners and renters - Two or more races residents
- 14697.1%Owner occupied
- 42.9%Renter occupied
- House owners and renters - White alone residents
- 2,49563.9%Owner occupied
- 1,41236.1%Renter occupied
- House owners and renters - Hispanic or Latino residents
- 58559.2%Owner occupied
- 40440.8%Renter occupied
Language usage in Elk City
- English speakers - Total
- 84.2% of residents of Elk City speak English at home.
- 15.3% of residents speak Spanish at home
- 1,26276.9%Speak English very well
- 38023.1%Speak English less than very well
- 0.7% of residents speak other language at home
- 6788.2%Speak English very well
- 911.8%Speak English less than very well
- English speakers - Born in the United States
- 88.5% of residents of Elk City speak English at home.
- 11.5% of residents speak Spanish at home
- 438100.0%Speak English very well
- English speakers - Foreign-born
- 12.7% of residents of Elk City speak English at home.
- 80.3% of residents speak Spanish at home
- 41653.1%Speak English very well
- 36746.9%Speak English less than very well
- 7.3% of residents speak other language at home
- 6287.3%Speak English very well
- 912.7%Speak English less than very well
White (Caucasian) - Speak only English
| Native: | 92.9% (7,846) |
| Foreign-born: | 35.8% (119) |
White (Caucasian) - Speak another language
| Native: | 5.6% (471) |
| Foreign-born: | 65.4% (217) |
Other race - Speak another language
| Native: | 53.5% (104) |
| Foreign-born: | 100.0% (144) |
Two or more races - Speak another language
| Native: | 8.0% (34) |
| Foreign-born: | 100.0% (331) |
White alone - Speak only English
| Native: | 98.0% (7,556) |
| Foreign-born: | 100.0% (20) |
Hispanic or Latino - Speak only English
| Native: | 54.1% (817) |
| Foreign-born: | 13.6% (125) |
Hispanic or Latino - Speak another language
| Native: | 45.9% (694) |
| Foreign-born: | 87.1% (801) |
Foreign-born residents in Elk City
976 residents are foreign born (7.7% Latin America).
| This city: | 8.4% |
| Oklahoma: | 6.1% |


Marital status for residents in Elk City
Marital status - White (Caucasian) population 15 years and over
- Males
- 32.3%Never married
- 51.2%Now married
- 1.0%Separated
- 2.8%Widowed
- 12.7%Divorced
- Females
- 17.4%Never married
- 47.5%Now married
- 3.6%Separated
- 12.2%Widowed
- 19.3%Divorced
Women who gave birth in the past 12 months
| Now married: | 69.2% (228) |
| Unmarried: | 30.8% (101) |
Women who did not give birth in the past 12 months
| Now married: | 50.9% (870) |
| Unmarried: | 49.1% (838) |
Marital status - Black or African American population 15 years and over
- Males
- 82.1%Never married
- 6.6%Now married
- 0.0%Separated
- 6.0%Widowed
- 5.3%Divorced
- Females
- 50.0%Never married
- 50.0%Now married
- 0.0%Separated
- 0.0%Widowed
- 0.0%Divorced
Women who gave birth in the past 12 months
| Now married: | 100.0% (4) |
| Unmarried: | 0.0% (0) |
Women who did not give birth in the past 12 months
| Now married: | 46.2% (11) |
| Unmarried: | 53.8% (13) |
Marital status - American Indian / Alaska Native population 15 years and over
- Males
- 0.0%Never married
- 75.0%Now married
- 0.0%Separated
- 0.0%Widowed
- 25.0%Divorced
- Females
- 5.0%Never married
- 67.8%Now married
- 27.3%Separated
- 0.0%Widowed
- 0.0%Divorced
Women who did not give birth in the past 12 months
| Now married: | 50.0% (6) |
| Unmarried: | 50.0% (6) |
Marital status - Asian population 15 years and over
- Males
- 51.7%Never married
- 48.3%Now married
- 0.0%Separated
- 0.0%Widowed
- 0.0%Divorced
- Females
- 62.5%Never married
- 37.5%Now married
- 0.0%Separated
- 0.0%Widowed
- 0.0%Divorced
Women who did not give birth in the past 12 months
| Now married: | 100.0% (6) |
| Unmarried: | 0.0% (0) |
Marital status - Other race population 15 years and over
- Males
- 0.0%Never married
- 73.4%Now married
- 0.0%Separated
- 0.0%Widowed
- 26.6%Divorced
- Females
- 25.7%Never married
- 74.3%Now married
- 0.0%Separated
- 0.0%Widowed
- 0.0%Divorced
Women who did not give birth in the past 12 months
| Now married: | 0.0% (0) |
| Unmarried: | 100.0% (43) |
Marital status - Two or more races population 15 years and over
- Males
- 41.0%Never married
- 45.7%Now married
- 2.9%Separated
- 1.6%Widowed
- 8.9%Divorced
- Females
- 19.0%Never married
- 65.7%Now married
- 1.9%Separated
- 0.0%Widowed
- 13.3%Divorced
Women who gave birth in the past 12 months
| Now married: | 100.0% (4) |
| Unmarried: | 0.0% (0) |
Women who did not give birth in the past 12 months
| Now married: | 65.7% (87) |
| Unmarried: | 34.3% (45) |
Marital status - White alone, not Hispanic / Latino population 15 years and over
- Males
- 23.8%Never married
- 54.8%Now married
- 1.3%Separated
- 3.6%Widowed
- 16.4%Divorced
- Females
- 16.0%Never married
- 47.5%Now married
- 3.8%Separated
- 12.4%Widowed
- 20.3%Divorced
Women who gave birth in the past 12 months
| Now married: | 69.2% (235) |
| Unmarried: | 30.8% (105) |
Women who did not give birth in the past 12 months
| Now married: | 50.7% (805) |
| Unmarried: | 49.3% (782) |
Marital status - Hispanic or Latino population 15 years and over
- Males
- 54.9%Never married
- 41.0%Now married
- 0.0%Separated
- 0.0%Widowed
- 4.0%Divorced
- Females
- 31.2%Never married
- 61.9%Now married
- 0.0%Separated
- 3.7%Widowed
- 3.3%Divorced
Women who gave birth in the past 12 months
| Now married: | 100.0% (3) |
| Unmarried: | 0.0% (0) |
Women who did not give birth in the past 12 months
| Now married: | 51.3% (171) |
| Unmarried: | 48.7% (162) |
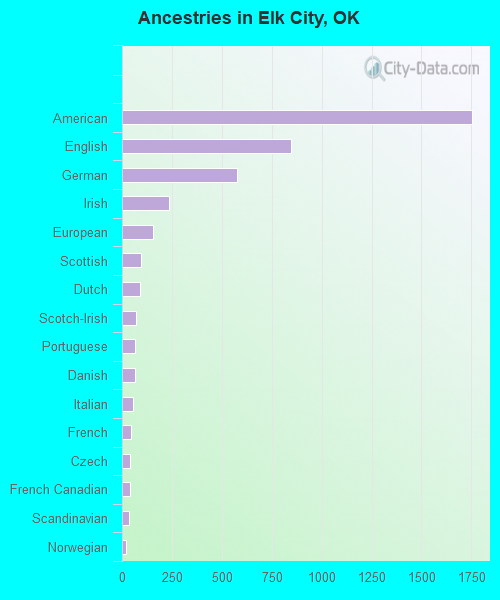
Ancestries in Elk City

- 1,75127.7%American
- 84713.4%English
- 5749.1%German
- 2353.7%Irish
- 1572.5%European
- 971.5%Scottish
- 901.4%Dutch
- 691.1%Scotch-Irish
- 651.0%Portuguese
- 641.0%Danish
- 540.9%Italian
- 460.7%French
- 420.7%Czech
- 400.6%French Canadian
- 340.5%Scandinavian
- 220.3%Norwegian
- 90.1%Cajun
- 50.08%Pennsylvania German
- 40.06%Northern European
- 20.03%Lebanese
Geographical mobility in Elk City

- Same house 1 year ago
- 7,73282.7%White (Caucasian)
- 32295.8%Black or African American
- 12268.9%American Indian / Alaska Native
- 116100.0%Asian
- 26876.0%Other race
- 57282.9%Two or more races
- 6,76183.7%White alone, not Hispanic / Latino
- 2,02079.3%Hispanic or Latino

-
- Moved within same county
- 6436.9%White / Caucasian
- 10.2%Black or African American
- 21.4%American Indian / Alaska Native
- 679.7%Two or more races
- 6778.4%White alone, not Hispanic / Latino
- 391.5%Hispanic or Latino

-
- Moved within same state
- 6707.2%White / Caucasian
- 216.3%Black or African American
- 395.6%Two or more races
- 3023.7%White alone, not Hispanic / Latino
- 39715.6%Hispanic or Latino

-
- Moved from different state
- 2672.9%White / Caucasian
- 10.3%Black or African American
- 6637.3%American Indian / Alaska Native
- 10429.4%Other race
- 81.1%Two or more races
- 2793.5%White alone, not Hispanic / Latino
- 763.0%Hispanic or Latino

-
- Moved from abroad
- 240.3%White
- 300.4%White alone, not Hispanic / Latino

Children Nativity (place of birth) in Elk City
Place of birth for residents in Elk City
![Place of birth for the foreign-born population - Regions]()
- 882Americas
- 882Latin America
- 882Central America
- 73Asia
- 51Eastern Asia
- 51China
- 21South Eastern Asia
- 20Europe
- 20Northern Europe

![Place of birth for the foreign-born population - Countries]()
- 873Mexico
- 51China
- 21Philippines
- 20United Kingdom
- 8Honduras
