Races in Elizabethtown, Pennsylvania (PA) Detailed Stats
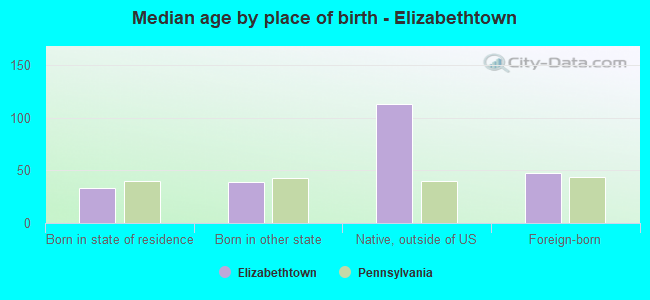
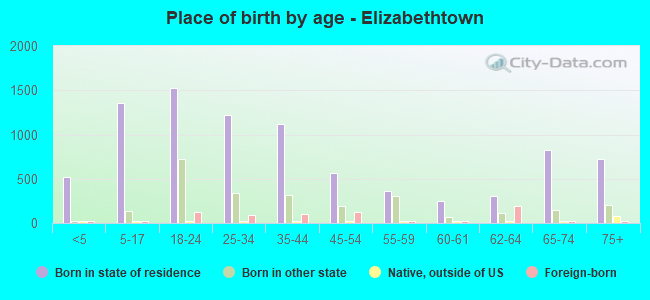
Ancestries, Foreign-born residents, place of birth
Settings
X


Recent posts about races in Elizabethtown, Pennsylvania on our local forum with over 2,400,000 registered users:
 | Art House Movie Theaters (7 replies) |
| City/area suggestions? (15 replies) |
| Considering relocating to Eastern PA From the Deeeeeeep South. Crazy? (123 replies) |
| Lancaster is awesome (23 replies) |
| High-speed internet in rural PA (4 replies) |
| Looking to relocate - mobile/manufactured home? (18 replies) |
Latest news about races in Elizabethtown, PA collected exclusively by city-data.com from local newspapers, TV, and radio stations
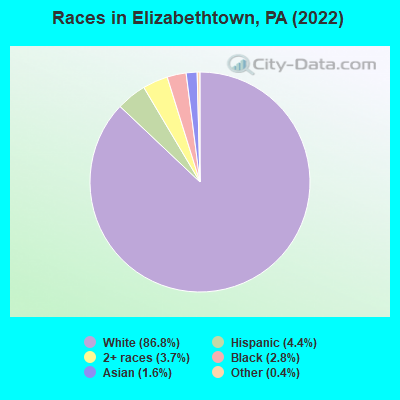
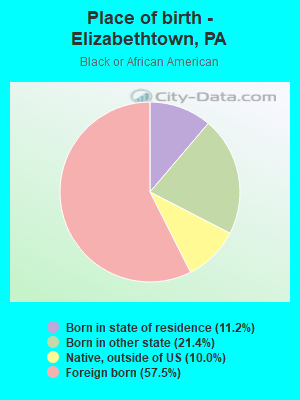
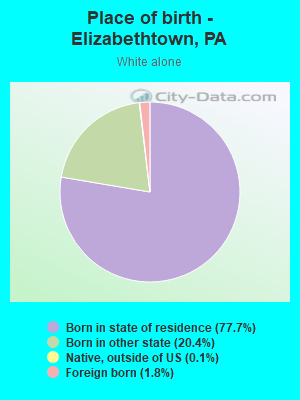
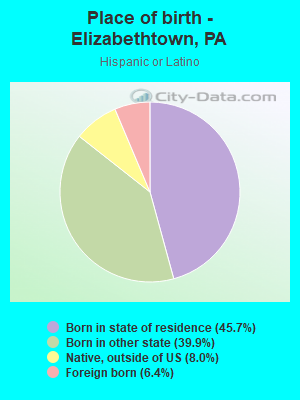
According to 2022 data, the most numerous races in Elizabethtown, PA are White alone (10,308 residents), Black alone (335 residents), and Hispanic (519 residents). 93.7% of Elizabethtown residents speak English at home. 6.6% of Elizabethtown, PA residents are foreign-born (2.0% born in Europe, 2.0% born in Asia, 1.9% born in Africa), which is 5.6% less than the foreign-born rate of 7.0% across the entire state of Pennsylvania.
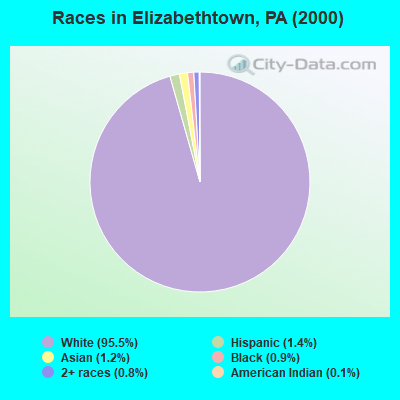
Race distribution in Elizabethtown
2000
2022

- 11,34995.5%White alone
- 1721.4%Hispanic
- 1461.2%Asian alone
- 1050.9%Black alone
- 900.8%Two or more races
- 120.1%American Indian alone
- 80.07%Other race alone
- 50.04%Native Hawaiian and Other
Pacific Islander alone
-
- 10,30886.8%White alone
- 5194.4%Hispanic
- 4363.7%Two or more races
- 3352.8%Black alone
- 1931.6%Asian alone
- 450.4%Other race alone
- 70.06%American Indian alone
2000
2022
-
- 10,322,45584.1%White alone
- 1,202,4379.8%Black alone
- 394,0883.2%Hispanic
- 218,2961.8%Asian alone
- 113,0970.9%Two or more races
- 13,0860.1%Other race alone
- 14,9040.1%American Indian alone
- 2,6910.02%Native Hawaiian and Other
Pacific Islander alone

-
- 9,487,22873.1%White alone
- 1,311,58110.1%Black alone
- 1,115,9978.6%Hispanic
- 493,9423.8%Two or more races
- 487,1243.8%Asian alone
- 63,5820.5%Other race alone
- 10,1300.08%American Indian alone
- 2,4240.02%Native Hawaiian and Other
Pacific Islander alone

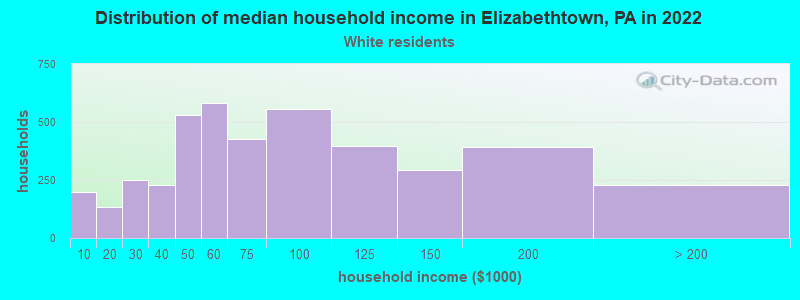
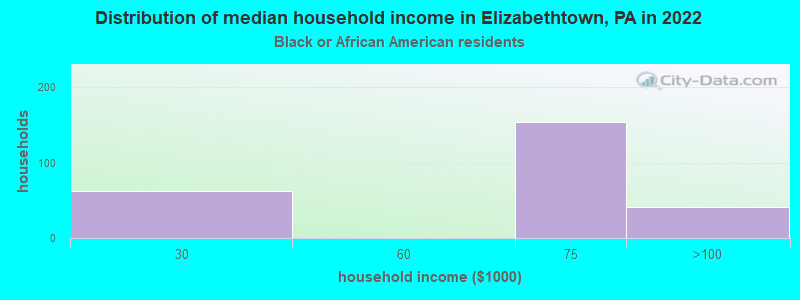
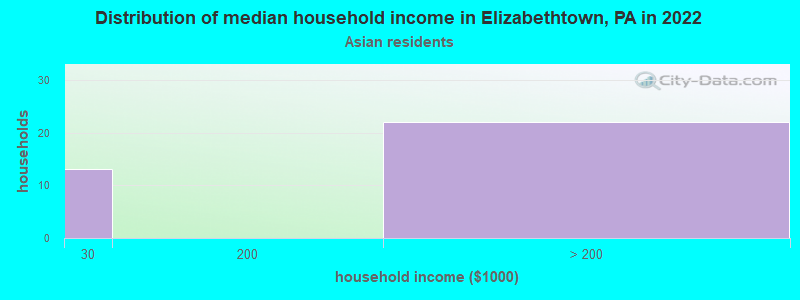
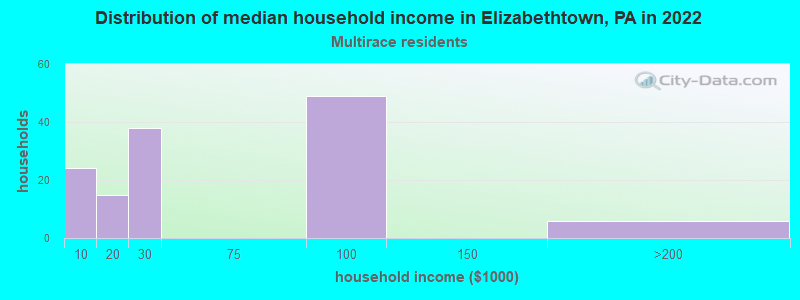
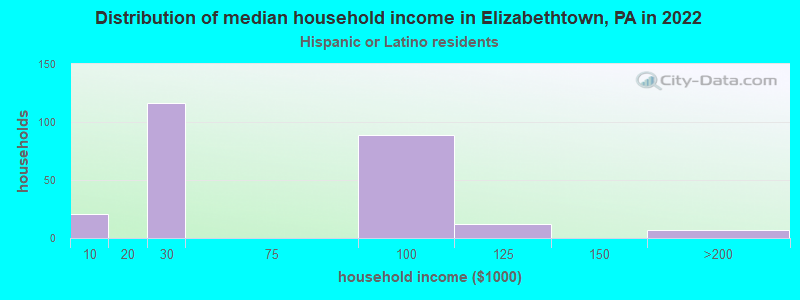
Income and house value in Elizabethtown
- Median household income in 2022
- $68,169White non-Hispanic householders
- $62,517Black householders
- $26,182Hispanic or Latino race householders
- Median 2022 house value
- $237,861White Non-Hispanic householders
- $238,509Asian householders
- $183,634Two or more races householders
- $445,692Hispanic or Latino householders
Household income for White non-Hispanic householders
Household income for Black householders
Household income for Asian householders
Household income for Two or more races householders
Household income for Hispanic or Latino race householders
Median age by race in Elizabethtown
- 35.7Median age for White residents
- 36.3Males
- 35.5Females
- 43.7Median age for Black or African American residents
- 47.3Males
- 39.9Females
- -642,857,142.2Median age for American Indian / Alaska Native residents
- -714,583,332.6Males
- -577,519,379.3Females
- 23.1Median age for Asian residents
- 28.6Males
- 23.9Females
- -612,499,999.4Median age for Native Hawaiian / Pacific Islander residents
- -760,416,665.9Males
- -747,474,746.7Females
- 38.4Median age for Other race residents
- -613,659,530.5Males
- -642,642,642.0Females
- 21.8Median age for Two or more races residents
- 26.2Males
- 16.3Females
- 36.4Median age for White alone residents
- 37.4Males
- 36.1Females
- 23.7Median age for Hispanic or Latino residents
- 24.6Males
- 21.9Females
Owner/renter occupied households by race in Elizabethtown
- House owners and renters - White residents
- 2,39756.9%Owner occupied
- 1,81943.1%Renter occupied
- House owners and renters - Black or African American residents
- 6934.7%Owner occupied
- 12965.3%Renter occupied
- House owners and renters - Asian residents
- 27100.0%Renter occupied
- House owners and renters - Other race residents
- 2852.3%Owner occupied
- 2547.7%Renter occupied
- House owners and renters - Two or more races residents
- 2414.5%Owner occupied
- 14185.5%Renter occupied
- House owners and renters - White alone residents
- 2,41357.0%Owner occupied
- 1,82243.0%Renter occupied
- House owners and renters - Hispanic or Latino residents
- 5621.0%Owner occupied
- 21179.0%Renter occupied
Language usage in Elizabethtown
- English speakers - Total
- 93.7% of residents of Elizabethtown speak English at home.
- 1.8% of residents speak Spanish at home
- 12963.9%Speak English very well
- 7336.1%Speak English less than very well
- 4.9% of residents speak other language at home
- 32358.5%Speak English very well
- 22941.5%Speak English less than very well
- English speakers - Born in the United States
- 92.6% of residents of Elizabethtown speak English at home.
- 5.3% of residents speak Spanish at home
- 12091.6%Speak English very well
- 118.4%Speak English less than very well
- 0.2% of residents speak other language at home
- 4100.0%Speak English very well
- English speakers - Native, born elsewhere
- 0.0% of residents of Elizabethtown speak English at home.
- 84.3% of residents speak Spanish at home
- 49.3%Speak English very well
- 3990.7%Speak English less than very well
- 13.7% of residents speak other language at home
- 7100.0%Speak English very well
- English speakers - Foreign-born
- 35.1% of residents of Elizabethtown speak English at home.
- 5.4% of residents speak Spanish at home
- 1748.6%Speak English very well
- 1851.4%Speak English less than very well
- 61.6% of residents speak other language at home
- 20852.0%Speak English very well
- 19248.0%Speak English less than very well
White (Caucasian) - Speak only English
| Native: | 98.1% (9,535) |
| Foreign-born: | 100.0% (160) |
White (Caucasian) - Speak another language
| Native: | 1.6% (159) |
| Foreign-born: | 16.7% (27) |
Black or African American - Speak another language
| Native: | 18.5% (37) |
| Foreign-born: | 89.3% (199) |
Asian - Speak another language
| Native: | 70.0% (3) |
| Foreign-born: | 99.0% (182) |
Two or more races - Speak another language
| Native: | 2.9% (14) |
| Foreign-born: | 100.0% (22) |
White alone - Speak only English
| Native: | 97.9% (9,451) |
| Foreign-born: | 100.0% (185) |
White alone - Speak another language
| Native: | 1.2% (118) |
| Foreign-born: | 13.8% (26) |
Hispanic or Latino - Speak another language
| Native: | 27.7% (129) |
| Foreign-born: | 99.2% (35) |
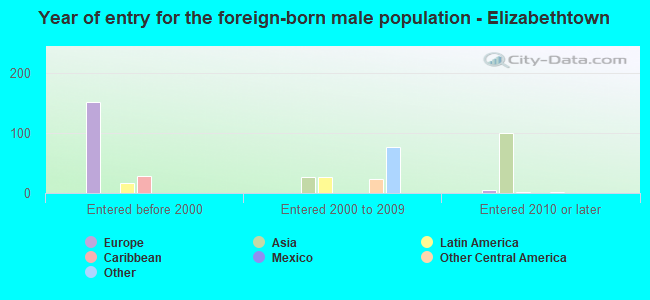
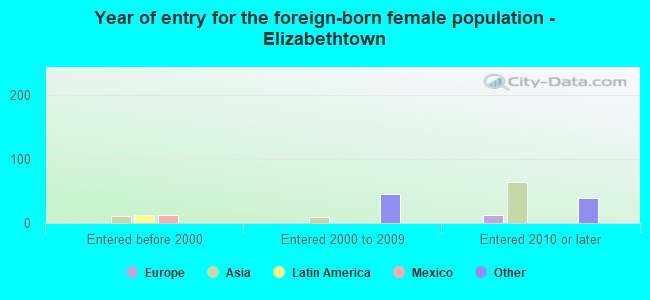
Foreign-born residents in Elizabethtown
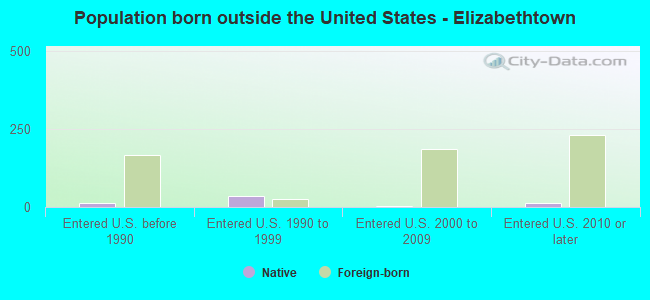
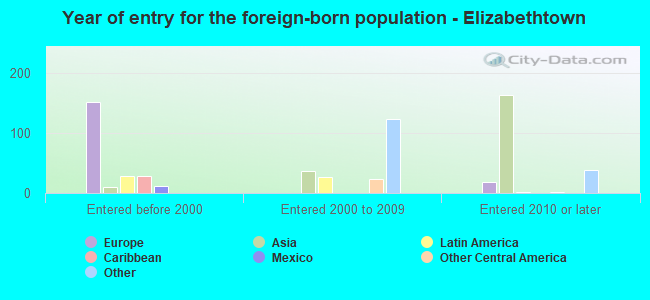
787 residents are foreign born (2.0% Europe, 2.0% Asia, 1.9% Africa).
| This city: | 6.6% |
| Pennsylvania: | 7.3% |

Marital status for residents in Elizabethtown
Marital status - White (Caucasian) population 15 years and over
- Males
- 35.9%Never married
- 52.0%Now married
- 0.7%Separated
- 0.8%Widowed
- 10.5%Divorced
- Females
- 37.9%Never married
- 43.5%Now married
- 1.7%Separated
- 8.4%Widowed
- 8.5%Divorced
Women who gave birth in the past 12 months
| Now married: | 100.0% (56) |
| Unmarried: | 0.0% (0) |
Women who did not give birth in the past 12 months
| Now married: | 35.7% (975) |
| Unmarried: | 64.3% (1,757) |
Marital status - Black or African American population 15 years and over
- Males
- 23.2%Never married
- 49.2%Now married
- 0.0%Separated
- 16.4%Widowed
- 11.2%Divorced
- Females
- 37.2%Never married
- 62.8%Now married
- 0.0%Separated
- 0.0%Widowed
- 0.0%Divorced
Women who did not give birth in the past 12 months
| Now married: | 55.0% (85) |
| Unmarried: | 45.0% (70) |
Marital status - Asian population 15 years and over
- Males
- 51.6%Never married
- 48.4%Now married
- 0.0%Separated
- 0.0%Widowed
- 0.0%Divorced
- Females
- 86.5%Never married
- 0.0%Now married
- 0.0%Separated
- 13.5%Widowed
- 0.0%Divorced
Women who did not give birth in the past 12 months
| Now married: | 0.0% (0) |
| Unmarried: | 100.0% (88) |
Marital status - Other race population 15 years and over
- Males
- 0.0%Never married
- 100.0%Now married
- 0.0%Separated
- 0.0%Widowed
- 0.0%Divorced
- Females
- 0.0%Never married
- 100.0%Now married
- 0.0%Separated
- 0.0%Widowed
- 0.0%Divorced
Women who did not give birth in the past 12 months
| Now married: | 100.0% (22) |
| Unmarried: | 0.0% (0) |
Marital status - Two or more races population 15 years and over
- Males
- 35.9%Never married
- 43.8%Now married
- 20.3%Separated
- 0.0%Widowed
- 0.0%Divorced
- Females
- 34.7%Never married
- 42.9%Now married
- 0.0%Separated
- 12.2%Widowed
- 10.2%Divorced
Women who did not give birth in the past 12 months
| Now married: | 45.0% (52) |
| Unmarried: | 55.0% (64) |
Marital status - White alone, not Hispanic / Latino population 15 years and over
- Males
- 35.5%Never married
- 52.4%Now married
- 0.7%Separated
- 0.9%Widowed
- 10.6%Divorced
- Females
- 36.4%Never married
- 44.8%Now married
- 1.8%Separated
- 8.6%Widowed
- 8.5%Divorced
Women who gave birth in the past 12 months
| Now married: | 100.0% (57) |
| Unmarried: | 0.0% (0) |
Women who did not give birth in the past 12 months
| Now married: | 37.5% (1,005) |
| Unmarried: | 62.5% (1,672) |
Marital status - Hispanic or Latino population 15 years and over
- Males
- 26.3%Never married
- 27.3%Now married
- 12.7%Separated
- 20.0%Widowed
- 13.7%Divorced
- Females
- 67.9%Never married
- 19.5%Now married
- 0.0%Separated
- 6.3%Widowed
- 6.3%Divorced
Women who did not give birth in the past 12 months
| Now married: | 18.0% (30) |
| Unmarried: | 82.0% (139) |
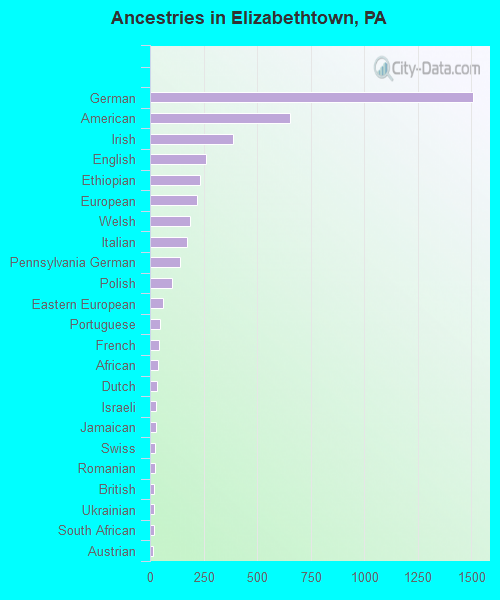
Ancestries in Elizabethtown

- 1,50729.7%German
- 65412.9%American
- 3877.6%Irish
- 2635.2%English
- 2324.6%Ethiopian
- 2184.3%European
- 1863.7%Welsh
- 1733.4%Italian
- 1402.8%Pennsylvania German
- 1032.0%Polish
- 631.2%Eastern European
- 460.9%Portuguese
- 440.9%French
- 360.7%African
- 350.7%Dutch
- 270.5%Israeli
- 260.5%Jamaican
- 230.5%Swiss
- 220.4%Romanian
- 200.4%British
- 190.4%Ukrainian
- 180.4%South African
- 160.3%Austrian
- 110.2%Norwegian
- 80.2%French Canadian
- 80.2%Macedonian
- 20.04%Croatian
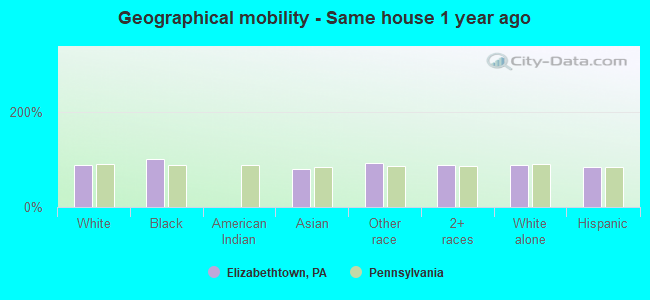
Geographical mobility in Elizabethtown

- Same house 1 year ago
- 8,94987.2%White (Caucasian)
- 487100.0%Black or African American
- 15278.7%Asian
- 7692.8%Other race
- 56588.9%Two or more races
- 8,97487.4%White alone, not Hispanic / Latino
- 43483.8%Hispanic or Latino
-
- Moved within same county
- 5175.0%White / Caucasian
- 61.3%Black or African American
- 5215.1%White alone, not Hispanic / Latino
- 142.8%Hispanic or Latino
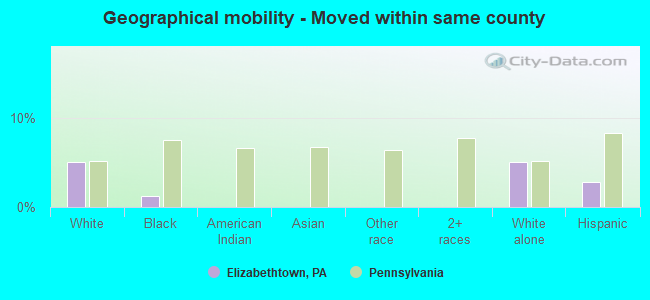
-
- Moved within same state
- 5375.2%White / Caucasian
- 30.7%Black or African American
- 957.6%American Indian / Alaska Native
- 375.8%Two or more races
- 5295.2%White alone, not Hispanic / Latino
- 244.6%Hispanic or Latino
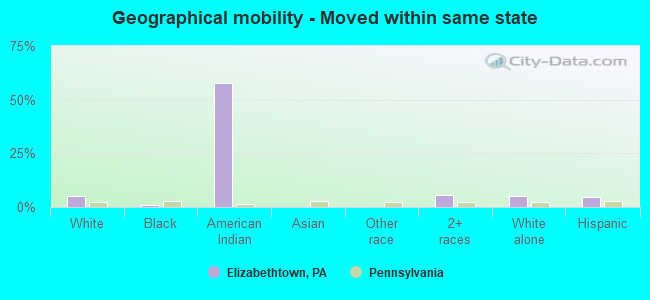
-
- Moved from different state
- 2612.5%White / Caucasian
- 51.0%Black or African American
- 81.3%Two or more races
- 2362.3%White alone, not Hispanic / Latino
- 183.4%Hispanic or Latino
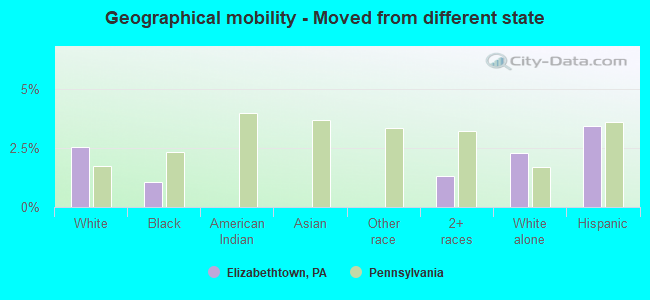
-
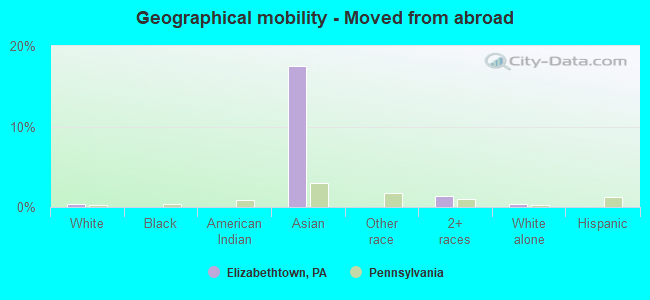
- Moved from abroad
- 350.3%White
- 3417.5%Asian
- 91.4%Two or more races
- 440.4%White alone, not Hispanic / Latino
Children Nativity (place of birth) in Elizabethtown
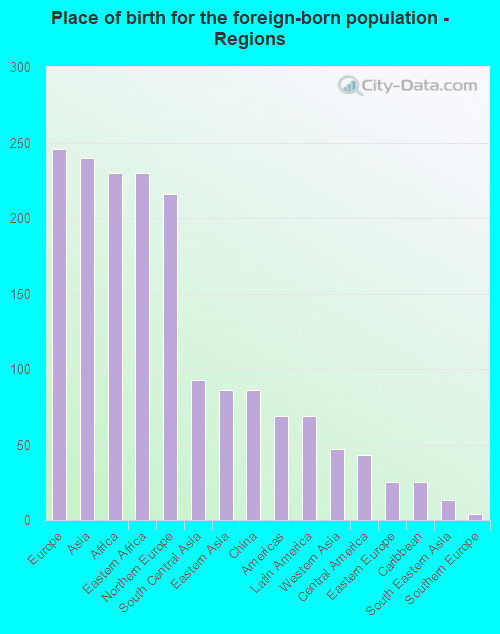
Place of birth for residents in Elizabethtown
![Place of birth for the foreign-born population - Regions]()
- 246Europe
- 240Asia
- 230Africa
- 230Eastern Africa
- 216Northern Europe
- 93South Central Asia
- 86Eastern Asia
- 86China
- 69Americas
- 69Latin America
- 47Western Asia
- 43Central America
- 25Eastern Europe
- 25Caribbean
- 13South Eastern Asia
- 4Southern Europe
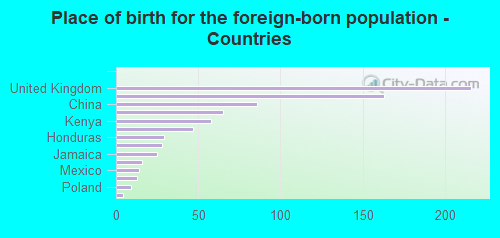
![Place of birth for the foreign-born population - Countries]()
- 216United Kingdom
- 163Ethiopia
- 86China
- 65India
- 58Kenya
- 47Israel
- 29Honduras
- 28Pakistan
- 25Jamaica
- 16Bosnia and Herzegovina
- 14Mexico
- 13Cambodia
- 9Poland
- 4Spain
Grandparents responsible for own grandchildren in Elizabethtown
Zip codes: 17022.