Races in Elizabeth City, North Carolina (NC) Detailed Stats
Data:
Races - White alone (%)
Races - White alone (% change since 2000)
Races - Black alone (%)
Races - Black alone (% change since 2000)
Races - American Indian alone (%)
Races - American Indian alone (% change since 2000)
Races - Asian alone (%)
Races - Asian alone (% change since 2000)
Races - Hispanic (%)
Races - Hispanic (% change since 2000)
Races - Native Hawaiian and Other Pacific Islander alone (%)
Races - Native Hawaiian and Other Pacific Islander alone (% change since 2000)
Races - Two or more races(%)
Races - Two or more races(% change since 2000)
Races - Other race alone (%)
Races - Other race alone (% change since 2000)
Racial diversity
Place of birth - Born in state of residence (%)
Place of birth - Born in state of residence (%) - White
Place of birth - Born in state of residence (%) - Black or African American
Place of birth - Born in state of residence (%) - Asian
Place of birth - Born in state of residence (%) - Hispanic or Latino
Place of birth - Born in state of residence (%) - American Indian and Alaska Native
Place of birth - Born in state of residence (%) - Multirace
Place of birth - Born in state of residence (%) - Other Race
Place of birth - Born in other state (%)
Place of birth - Born in other state (%) - White
Place of birth - Born in other state (%) - Black or African American
Place of birth - Born in other state (%) - Asian
Place of birth - Born in other state (%) - Hispanic or Latino
Place of birth - Born in other state (%) - American Indian and Alaska Native
Place of birth - Born in other state (%) - Multirace
Place of birth - Born in other state (%) - Other Race
Place of birth - Native, outside of US (%)
Place of birth - Native, outside of US (%) - White
Place of birth - Native, outside of US (%) - Black or African American
Place of birth - Native, outside of US (%) - Asian
Place of birth - Native, outside of US (%) - Hispanic or Latino
Place of birth - Native, outside of US (%) - American Indian and Alaska Native
Place of birth - Native, outside of US (%) - Multirace
Place of birth - Native, outside of US (%) - Other Race
Place of birth - Foreign born (%)
Place of birth - Foreign born (%) - White
Place of birth - Foreign born (%) - Black or African American
Place of birth - Foreign born (%) - Asian
Place of birth - Foreign born (%) - Hispanic or Latino
Place of birth - Foreign born (%) - American Indian and Alaska Native
Place of birth - Foreign born (%) - Multirace
Place of birth - Foreign born (%) - Other Race
Residents speaking English at home (%)
Residents speaking English at home - Born in the United States (%)
Residents speaking English at home - Native, born elsewhere (%)
Residents speaking English at home - Foreign born (%)
Residents speaking Spanish at home (%)
Residents speaking Spanish at home - Born in the United States (%)
Residents speaking Spanish at home - Native, born elsewhere (%)
Residents speaking Spanish at home - Foreign born (%)
Residents speaking other language at home (%)
Residents speaking other language at home - Born in the United States (%)
Residents speaking other language at home - Native, born elsewhere (%)
Residents speaking other language at home - Foreign born (%)
Marital status - Never married (%)
Marital status - Now married (%)
Marital status - Separated (%)
Marital status - Widowed (%)
Marital status - Divorced (%)
Ancestries Reported - Arab (%)
Ancestries Reported - Czech (%)
Ancestries Reported - Danish (%)
Ancestries Reported - Dutch (%)
Ancestries Reported - English (%)
Ancestries Reported - French (%)
Ancestries Reported - French Canadian (%)
Ancestries Reported - German (%)
Ancestries Reported - Greek (%)
Ancestries Reported - Hungarian (%)
Ancestries Reported - Irish (%)
Ancestries Reported - Italian (%)
Ancestries Reported - Lithuanian (%)
Ancestries Reported - Norwegian (%)
Ancestries Reported - Polish (%)
Ancestries Reported - Portuguese (%)
Ancestries Reported - Russian (%)
Ancestries Reported - Scotch-Irish (%)
Ancestries Reported - Scottish (%)
Ancestries Reported - Slovak (%)
Ancestries Reported - Subsaharan African (%)
Ancestries Reported - Swedish (%)
Ancestries Reported - Swiss (%)
Ancestries Reported - Ukrainian (%)
Ancestries Reported - United States (%)
Ancestries Reported - Welsh (%)
Ancestries Reported - West Indian (%)
Ancestries Reported - Other (%)
Geographical mobility - Same house 1 year ago (%)
Geographical mobility - Same house 1 year ago (%) - White
Geographical mobility - Same house 1 year ago (%) - Black or African American
Geographical mobility - Same house 1 year ago (%) - Asian
Geographical mobility - Same house 1 year ago (%) - Hispanic or Latino
Geographical mobility - Same house 1 year ago (%) - American Indian and Alaska Native
Geographical mobility - Same house 1 year ago (%) - Multirace
Geographical mobility - Same house 1 year ago (%) - Other Race
Geographical mobility - Moved within same county (%)
Geographical mobility - Moved within same county (%) - White
Geographical mobility - Moved within same county (%) - Black or African American
Geographical mobility - Moved within same county (%) - Asian
Geographical mobility - Moved within same county (%) - Hispanic or Latino
Geographical mobility - Moved within same county (%) - American Indian and Alaska Native
Geographical mobility - Moved within same county (%) - Multirace
Geographical mobility - Moved within same county (%) - Other Race
Geographical mobility - Moved from different county within same state (%)
Geographical mobility - Moved from different county within same state (%) - White
Geographical mobility - Moved from different county within same state (%) - Black or African American
Geographical mobility - Moved from different county within same state (%) - Asian
Geographical mobility - Moved from different county within same state (%) - Hispanic or Latino
Geographical mobility - Moved from different county within same state (%) - American Indian and Alaska Native
Geographical mobility - Moved from different county within same state (%) - Multirace
Geographical mobility - Moved from different county within same state (%) - Other Race
Geographical mobility - Moved from different state (%)
Geographical mobility - Moved from different state (%) - White
Geographical mobility - Moved from different state (%) - Black or African American
Geographical mobility - Moved from different state (%) - Asian
Geographical mobility - Moved from different state (%) - Hispanic or Latino
Geographical mobility - Moved from different state (%) - American Indian and Alaska Native
Geographical mobility - Moved from different state (%) - Multirace
Geographical mobility - Moved from different state (%) - Other Race
Geographical mobility - Moved from abroad (%)
Geographical mobility - Moved from abroad (%) - White
Geographical mobility - Moved from abroad (%) - Black or African American
Geographical mobility - Moved from abroad (%) - Asian
Geographical mobility - Moved from abroad (%) - Hispanic or Latino
Geographical mobility - Moved from abroad (%) - American Indian and Alaska Native
Geographical mobility - Moved from abroad (%) - Multirace
Geographical mobility - Moved from abroad (%) - Other Race
Place of birth for the foreign-born population - Ireland (%)
Place of birth for the foreign-born population - Denmark (%)
Place of birth for the foreign-born population - Norway (%)
Place of birth for the foreign-born population - Sweden (%)
Place of birth for the foreign-born population - United Kingdom (%)
Place of birth for the foreign-born population - England (%)
Place of birth for the foreign-born population - Scotland (%)
Place of birth for the foreign-born population - Other Northern Europe (%)
Place of birth for the foreign-born population - Austria (%)
Place of birth for the foreign-born population - Belgium (%)
Place of birth for the foreign-born population - France (%)
Place of birth for the foreign-born population - Germany (%)
Place of birth for the foreign-born population - Netherlands (%)
Place of birth for the foreign-born population - Switzerland (%)
Place of birth for the foreign-born population - Other Western Europe (%)
Place of birth for the foreign-born population - Greece (%)
Place of birth for the foreign-born population - Italy (%)
Place of birth for the foreign-born population - Portugal (%)
Place of birth for the foreign-born population - Spain (%)
Place of birth for the foreign-born population - Other Southern Europe (%)
Place of birth for the foreign-born population - Albania (%)
Place of birth for the foreign-born population - Belarus (%)
Place of birth for the foreign-born population - Bosnia and Herzegovina (%)
Place of birth for the foreign-born population - Bulgaria (%)
Place of birth for the foreign-born population - Croatia (%)
Place of birth for the foreign-born population - Czechoslovakia (%)
Place of birth for the foreign-born population - Hungary (%)
Place of birth for the foreign-born population - Latvia (%)
Place of birth for the foreign-born population - Lithuania (%)
Place of birth for the foreign-born population - North Macedonia (Macedonia) (%)
Place of birth for the foreign-born population - Moldova (%)
Place of birth for the foreign-born population - Poland (%)
Place of birth for the foreign-born population - Romania (%)
Place of birth for the foreign-born population - Russia (%)
Place of birth for the foreign-born population - Serbia (%)
Place of birth for the foreign-born population - Ukraine (%)
Place of birth for the foreign-born population - Other Eastern Europe (%)
Place of birth for the foreign-born population - China (%)
Place of birth for the foreign-born population - Hong Kong (%)
Place of birth for the foreign-born population - Taiwan (%)
Place of birth for the foreign-born population - Japan (%)
Place of birth for the foreign-born population - Korea (%)
Place of birth for the foreign-born population - Other Eastern Asia (%)
Place of birth for the foreign-born population - Afghanistan (%)
Place of birth for the foreign-born population - Bangladesh (%)
Place of birth for the foreign-born population - India (%)
Place of birth for the foreign-born population - Iran (%)
Place of birth for the foreign-born population - Kazakhstan (%)
Place of birth for the foreign-born population - Nepal (%)
Place of birth for the foreign-born population - Pakistan (%)
Place of birth for the foreign-born population - Sri Lanka (%)
Place of birth for the foreign-born population - Uzbekistan (%)
Place of birth for the foreign-born population - Other South Central Asia (%)
Place of birth for the foreign-born population - Burma (%)
Place of birth for the foreign-born population - Cambodia (%)
Place of birth for the foreign-born population - Indonesia (%)
Place of birth for the foreign-born population - Laos (%)
Place of birth for the foreign-born population - Malaysia (%)
Place of birth for the foreign-born population - Philippines (%)
Place of birth for the foreign-born population - Singapore (%)
Place of birth for the foreign-born population - Thailand (%)
Place of birth for the foreign-born population - Vietnam (%)
Place of birth for the foreign-born population - Other South Eastern Asia (%)
Place of birth for the foreign-born population - Armenia (%)
Place of birth for the foreign-born population - Iraq (%)
Place of birth for the foreign-born population - Israel (%)
Place of birth for the foreign-born population - Jordan (%)
Place of birth for the foreign-born population - Kuwait (%)
Place of birth for the foreign-born population - Lebanon (%)
Place of birth for the foreign-born population - Saudi Arabia (%)
Place of birth for the foreign-born population - Syria (%)
Place of birth for the foreign-born population - Turkey (%)
Place of birth for the foreign-born population - Yemen (%)
Place of birth for the foreign-born population - Other Western Asia (%)
Place of birth for the foreign-born population - Eritrea (%)
Place of birth for the foreign-born population - Ethiopia (%)
Place of birth for the foreign-born population - Kenya (%)
Place of birth for the foreign-born population - Somalia (%)
Place of birth for the foreign-born population - Uganda (%)
Place of birth for the foreign-born population - Zimbabwe (%)
Place of birth for the foreign-born population - Other Eastern Africa (%)
Place of birth for the foreign-born population - Cameroon (%)
Place of birth for the foreign-born population - Congo (%)
Place of birth for the foreign-born population - Democratic Republic of Congo (Zaire) (%)
Place of birth for the foreign-born population - Other Middle Africa (%)
Place of birth for the foreign-born population - Egypt (%)
Place of birth for the foreign-born population - Morocco (%)
Place of birth for the foreign-born population - Sudan (%)
Place of birth for the foreign-born population - Other Northern Africa (%)
Place of birth for the foreign-born population - South Africa (%)
Place of birth for the foreign-born population - Other Southern Africa (%)
Place of birth for the foreign-born population - Cabo Verde (%)
Place of birth for the foreign-born population - Ghana (%)
Place of birth for the foreign-born population - Liberia (%)
Place of birth for the foreign-born population - Nigeria (%)
Place of birth for the foreign-born population - Senegal (%)
Place of birth for the foreign-born population - Sierra Leone (%)
Place of birth for the foreign-born population - Other Western Africa (%)
Place of birth for the foreign-born population - Australia (%)
Place of birth for the foreign-born population - New Zealand (%)
Place of birth for the foreign-born population - Fiji (%)
Place of birth for the foreign-born population - Micronesia (%)
Place of birth for the foreign-born population - Bahamas (%)
Place of birth for the foreign-born population - Barbados (%)
Place of birth for the foreign-born population - Cuba (%)
Place of birth for the foreign-born population - Dominica (%)
Place of birth for the foreign-born population - Dominican Republic (%)
Place of birth for the foreign-born population - Grenada (%)
Place of birth for the foreign-born population - Haiti (%)
Place of birth for the foreign-born population - Jamaica (%)
Place of birth for the foreign-born population - St. Vincent and the Grenadines (%)
Place of birth for the foreign-born population - Trinidad and Tobago (%)
Place of birth for the foreign-born population - West Indies (%)
Place of birth for the foreign-born population - Other Caribbean (%)
Place of birth for the foreign-born population - Belize (%)
Place of birth for the foreign-born population - Costa Rica (%)
Place of birth for the foreign-born population - El Salvador (%)
Place of birth for the foreign-born population - Guatemala (%)
Place of birth for the foreign-born population - Honduras (%)
Place of birth for the foreign-born population - Mexico (%)
Place of birth for the foreign-born population - Nicaragua (%)
Place of birth for the foreign-born population - Panama (%)
Place of birth for the foreign-born population - Other Central America (%)
Place of birth for the foreign-born population - Argentina (%)
Place of birth for the foreign-born population - Bolivia (%)
Place of birth for the foreign-born population - Brazil (%)
Place of birth for the foreign-born population - Chile (%)
Place of birth for the foreign-born population - Colombia (%)
Place of birth for the foreign-born population - Ecuador (%)
Place of birth for the foreign-born population - Guyana (%)
Place of birth for the foreign-born population - Peru (%)
Place of birth for the foreign-born population - Uruguay (%)
Place of birth for the foreign-born population - Venezuela (%)
Place of birth for the foreign-born population - Other South America (%)
Place of birth for the foreign-born population - Canada (%)
Place of birth for the foreign-born population - Other Northern America (%)
Place of birth for the foreign-born population - Other (%)
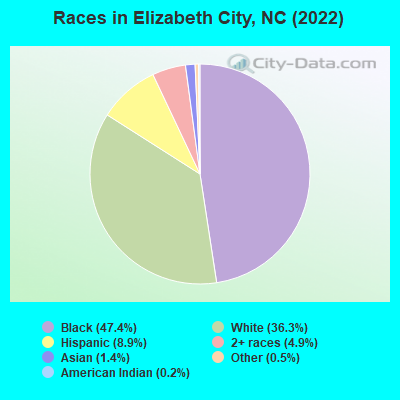
According to 2022 data, the most numerous races in Elizabeth City, NC are White alone (6,897 residents), Black alone (8,995 residents), and Hispanic (1,683 residents). 92.4% of Elizabeth City residents speak English at home. 3.3% of Elizabeth City, NC residents are foreign-born (1.6% born in Latin America, 1.1% born in Asia, 0.4% born in Europe), which is 142.5% less than the foreign-born rate of 8.0% across the entire state of North Carolina.
Race distribution in Elizabeth City
2000 2022
5,647,155 70.2% White alone 1,723,301 21.4% Black alone 378,963 4.7% Hispanic 112,416 1.4% Asian alone 95,333 1.2% American Indian alone 79,965 1.0% Two or more races 9,015 0.1% Other race alone 3,165 0.04% Native Hawaiian and Other
6,497,519 60.7% White alone 2,155,650 20.1% Black alone 1,114,799 10.4% Hispanic 438,061 4.1% Two or more races 341,052 3.2% Asian alone 91,758 0.9% American Indian alone 50,180 0.5% Other race alone 9,954 0.09% Native Hawaiian and Other
Income and house value in Elizabeth City Median household income in 2022 $57,750 White non-Hispanic householders$53,170 Black householders$54,871 Asian householders$30,905 Two or more races householders$32,082 Hispanic or Latino race householdersMedian 2022 house value $227,935 White Non-Hispanic householders$188,763 Black or African American householders$319,337 American Indian or Alaska Native householders $134,831 Asian householders$390,301 Two or more races householders$131,425 Hispanic or Latino householders
Median age by race in Elizabeth City
43.6 Median age for White residents40.5 45.4 33.8 Median age for Black or African American residents30.1 40.2 38.5 Median age for American Indian / Alaska Native residents-668,604,650.5 28.7 32.0 Median age for Asian residents32.3 30.6 -609,884,331.7 Median age for Native Hawaiian / Pacific Islander residents-611,708,482.1 -612,403,100.2 35.2 Median age for Other race residents45.1 23.2 16.4 Median age for Two or more races residents11.2 24.5 43.5 Median age for White alone residents41.4 45.6 24.1 Median age for Hispanic or Latino residents19.8 26.4
Owner/renter occupied households by race in Elizabeth City
House owners and renters - White residents 1,962 59.3% Owner occupied1,345 40.7% Renter occupiedHouse owners and renters - Black or African American residents 1,052 29.9% Owner occupied2,462 70.1% Renter occupiedHouse owners and renters - American Indian / Alaska Native residents 1 2.1% Owner occupied51 97.9% Renter occupiedHouse owners and renters - Asian residents 36 44.5% Owner occupied45 55.5% Renter occupiedHouse owners and renters - Native Hawaiian / Pacific Islander residents 15 100.0% Renter occupiedHouse owners and renters - Other race residents 50 100.0% Renter occupiedHouse owners and renters - Two or more races residents 147 43.9% Owner occupied187 56.1% Renter occupiedHouse owners and renters - White alone residents 1,922 60.9% Owner occupied1,234 39.1% Renter occupiedHouse owners and renters - Hispanic or Latino residents 79 17.5% Owner occupied372 82.5% Renter occupied
Language usage in Elizabeth City
English speakers - Total 92.4% of residents of Elizabeth City speak English at home.
4.7% of residents speak Spanish at home 532 64.0% Speak English very well299 36.0% Speak English less than very well2.6% of residents speak other language at home 322 69.1% Speak English very well144 30.9% Speak English less than very well
English speakers - Born in the United States 95.6% of residents of Elizabeth City speak English at home.
1.2% of residents speak Spanish at home 52 60.5% Speak English very well34 39.5% Speak English less than very well3.3% of residents speak other language at home 231 92.8% Speak English very well18 7.2% Speak English less than very well
English speakers - Native, born elsewhere 27.7% of residents of Elizabeth City speak English at home.
71.3% of residents speak Spanish at home 258 63.9% Speak English very well146 36.1% Speak English less than very well2.1% of residents speak other language at home 12 100.0% Speak English very well
English speakers - Foreign-born 30.8% of residents of Elizabeth City speak English at home.
38.2% of residents speak Spanish at home 91 38.1% Speak English very well148 61.9% Speak English less than very well30.5% of residents speak other language at home 65 34.0% Speak English very well126 66.0% Speak English less than very well
White (Caucasian) - Speak only English Native:
95.6% (6,633)Foreign-born:
69.1% (74)
White (Caucasian) - Speak another language Native:
3.8% (265)Foreign-born:
42.9% (46)
Black or African American - Speak only English Native:
99.6% (8,301)Foreign-born:
32.4% (9)
Black or African American - Speak another language Native:
0.5% (43)Foreign-born:
67.5% (19)
Asian - Speak only English Native:
99.5% (68)Foreign-born:
33.4% (68)
Other race - Speak another language Native:
41.0% (123)Foreign-born:
100.0% (211)
Two or more races - Speak only English Native:
65.9% (875)Foreign-born:
89.9% (46)
Two or more races - Speak another language Native:
35.8% (475)Foreign-born:
2.9% (1)
White alone - Speak only English Native:
98.5% (6,443)Foreign-born:
64.0% (59)
White alone - Speak another language Native:
1.4% (94)Foreign-born:
36.0% (33)
Hispanic or Latino - Speak only English Native:
48.2% (643)Foreign-born:
18.2% (54)
Hispanic or Latino - Speak another language Native:
52.3% (698)Foreign-born:
82.1% (242)
Foreign-born residents in Elizabeth City 626 residents are foreign born (1.6% Latin America , 1.1% Asia , 0.4% Europe ).
This city:
3.3%North Carolina:
8.3%
Marital status for residents in Elizabeth City Marital status - White (Caucasian) population 15 years and over
Males 33.2% Never married47.7% Now married0.9% Separated4.8% Widowed13.4% DivorcedFemales 21.6% Never married39.0% Now married2.0% Separated16.2% Widowed21.2% DivorcedWomen who gave birth in the past 12 months Now married:
73.0% (185)Unmarried:
27.0% (68)
Women who did not give birth in the past 12 months Now married:
36.1% (500)Unmarried:
63.9% (885)
Marital status - Black or African American population 15 years and over
Males 51.4% Never married39.8% Now married0.2% Separated2.9% Widowed5.7% DivorcedFemales 39.1% Never married31.5% Now married5.9% Separated8.1% Widowed15.4% DivorcedWomen who gave birth in the past 12 months Now married:
16.0% (26)Unmarried:
84.0% (137)
Women who did not give birth in the past 12 months Now married:
32.1% (773)Unmarried:
67.9% (1,640)
Marital status - American Indian / Alaska Native population 15 years and over
Males 0.0% Never married100.0% Now married0.0% Separated0.0% Widowed0.0% DivorcedFemales 83.8% Never married16.2% Now married0.0% Separated0.0% Widowed0.0% DivorcedWomen who did not give birth in the past 12 months Now married:
0.0% (0)Unmarried:
100.0% (66)
Marital status - Asian population 15 years and over
Males 56.3% Never married24.2% Now married19.5% Separated0.0% Widowed0.0% DivorcedFemales 21.3% Never married78.7% Now married0.0% Separated0.0% Widowed0.0% DivorcedWomen who did not give birth in the past 12 months Now married:
70.5% (58)Unmarried:
29.5% (24)
Marital status - Other race population 15 years and over
Males 5.5% Never married33.9% Now married0.0% Separated0.0% Widowed60.6% DivorcedFemales 44.1% Never married47.5% Now married0.0% Separated8.4% Widowed0.0% DivorcedWomen who did not give birth in the past 12 months Now married:
51.8% (117)Unmarried:
48.2% (108)
Marital status - Two or more races population 15 years and over
Males 62.2% Never married30.4% Now married1.4% Separated0.0% Widowed6.1% DivorcedFemales 64.6% Never married17.9% Now married3.0% Separated1.5% Widowed13.0% DivorcedWomen who gave birth in the past 12 months Now married:
100.0% (18)Unmarried:
0.0% (0)
Women who did not give birth in the past 12 months Now married:
19.1% (103)Unmarried:
80.9% (434)
Marital status - White alone, not Hispanic / Latino population 15 years and over
Males 32.7% Never married47.1% Now married0.9% Separated5.1% Widowed14.2% DivorcedFemales 22.0% Never married40.6% Now married2.1% Separated17.1% Widowed18.2% DivorcedWomen who gave birth in the past 12 months Now married:
100.0% (192)Unmarried:
0.0% (0)
Women who did not give birth in the past 12 months Now married:
37.2% (481)Unmarried:
62.8% (810)
Marital status - Hispanic or Latino population 15 years and over
Males 28.4% Never married41.8% Now married0.0% Separated0.0% Widowed29.8% DivorcedFemales 42.0% Never married21.3% Now married0.0% Separated5.7% Widowed31.0% DivorcedWomen who gave birth in the past 12 months Now married:
0.0% (0)Unmarried:
100.0% (77)
Women who did not give birth in the past 12 months Now married:
26.1% (131)Unmarried:
73.9% (370)
Ancestries in Elizabeth City
831 8.2% American748 7.4% English296 2.9% German267 2.6% Irish117 1.2% Scottish94 0.9% Italian52 0.5% African38 0.4% Scotch-Irish35 0.3% British35 0.3% Polish27 0.3% Jamaican25 0.2% Nigerian25 0.2% Haitian23 0.2% European16 0.2% Pennsylvania German14 0.1% Ukrainian12 0.1% Dutch10 0.10% Israeli8 0.08% Northern European7 0.07% Swedish6 0.06% Portuguese4 0.04% French3 0.03% Scandinavian
Geographical mobility in Elizabeth City Same house 1 year ago 5,594 78.5% White (Caucasian)6,894 76.8% Black or African American56 52.5% American Indian / Alaska Native42 15.5% Asian18 100.0% Native Hawaiian / Pacific Islander459 85.3% Other race1,357 82.0% Two or more races5,280 78.0% White alone, not Hispanic / Latino1,512 89.8% Hispanic or LatinoMoved within same county 367 5.2% White / Caucasian1,216 13.6% Black or African American92 34.0% Asian157 9.5% Two or more races386 5.7% White alone, not Hispanic / LatinoMoved within same state 673 9.4% White / Caucasian530 5.9% Black or African American102 37.6% Asian21 4.0% Other race78 4.7% Two or more races671 9.9% White alone, not Hispanic / Latino40 2.4% Hispanic or LatinoMoved from different state 485 6.8% White / Caucasian184 2.0% Black or African American48 44.7% American Indian / Alaska Native61 11.3% Other race48 2.9% Two or more races413 6.1% White alone, not Hispanic / Latino153 9.1% Hispanic or LatinoMoved from abroad 13 0.2% White15 0.2% White alone, not Hispanic / Latino
Children Nativity (place of birth) in Elizabeth City
Children under 6 years - Living with two parents Both parents native 793 100.0% NativeBoth parents foreign-born 22 100.0% NativeOne native, one foreign-born parent 29 100.0% NativeChildren under 6 years - Living with one parent Native parent 486 100.0% NativeChildren 6 to 17 years - Living with two parents Both parents native 1,048 100.0% NativeBoth parents foreign-born 20 100.0% NativeOne native, one foreign-born parent 32 100.0% NativeChildren 6 to 17 years - Living with one parent Native parent 1,082 100.0% NativeForeign-born parent 163 55.9% Native128 44.1% Foreign-born
Grandparents responsible for own grandchildren in Elizabeth City
Grandparents (30 to 59 years) White / Caucasian 8 60.4% Responsible for grandchildren5 39.6% Not responsible for grandchildrenBlack or African American 26 31.7% Responsible for grandchildren55 68.3% Not responsible for grandchildrenWhite alone, not Hispanic / Latino 9 61.2% Responsible for grandchildren6 38.8% Not responsible for grandchildren
Grandparents (60 years and over) White / Caucasian 10 100.0% Not responsible for grandchildrenBlack or African American 83 100.0% Not responsible for grandchildrenWhite alone, not Hispanic / Latino 10 100.0% Not responsible for grandchildren