Races in East Renton Highlands, Washington (WA) Detailed Stats
Data:
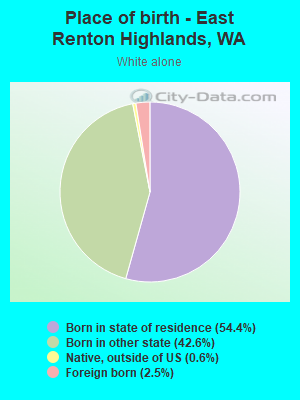
Races - White alone (%)
Races - White alone (% change since 2000)
Races - Black alone (%)
Races - Black alone (% change since 2000)
Races - American Indian alone (%)
Races - American Indian alone (% change since 2000)
Races - Asian alone (%)
Races - Asian alone (% change since 2000)
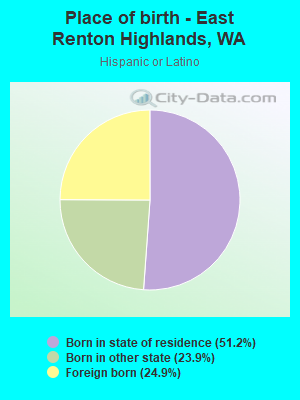
Races - Hispanic (%)
Races - Hispanic (% change since 2000)
Races - Native Hawaiian and Other Pacific Islander alone (%)
Races - Native Hawaiian and Other Pacific Islander alone (% change since 2000)
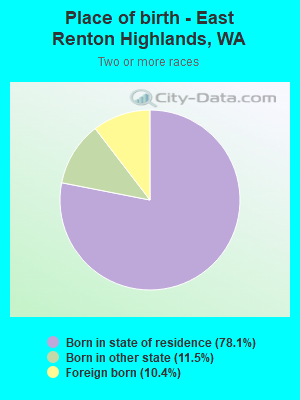
Races - Two or more races(%)
Races - Two or more races(% change since 2000)
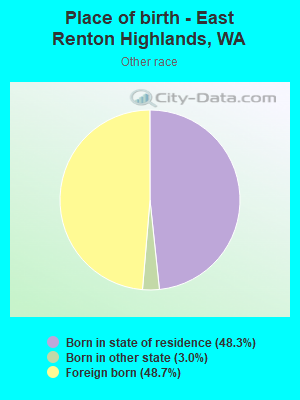
Races - Other race alone (%)
Races - Other race alone (% change since 2000)
Racial diversity
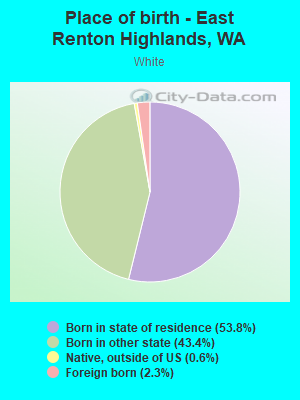
Place of birth - Born in state of residence (%)
Place of birth - Born in state of residence (%) - White
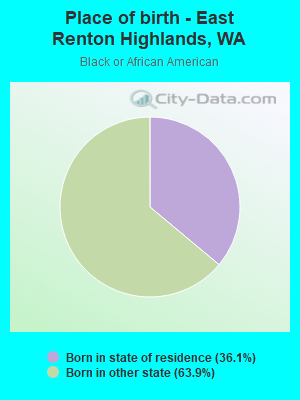
Place of birth - Born in state of residence (%) - Black or African American
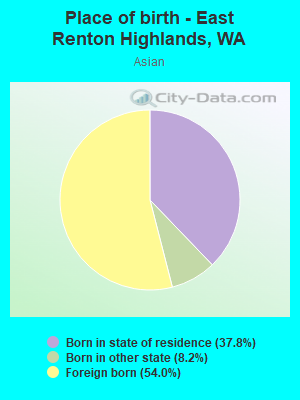
Place of birth - Born in state of residence (%) - Asian
Place of birth - Born in state of residence (%) - Hispanic or Latino
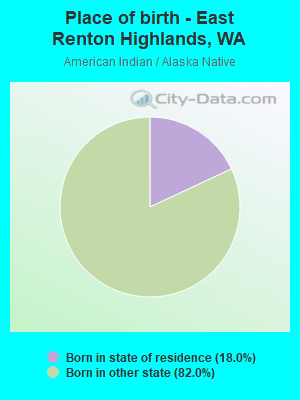
Place of birth - Born in state of residence (%) - American Indian and Alaska Native
Place of birth - Born in state of residence (%) - Multirace
Place of birth - Born in state of residence (%) - Other Race
Place of birth - Born in other state (%)
Place of birth - Born in other state (%) - White
Place of birth - Born in other state (%) - Black or African American
Place of birth - Born in other state (%) - Asian
Place of birth - Born in other state (%) - Hispanic or Latino
Place of birth - Born in other state (%) - American Indian and Alaska Native
Place of birth - Born in other state (%) - Multirace
Place of birth - Born in other state (%) - Other Race
Place of birth - Native, outside of US (%)
Place of birth - Native, outside of US (%) - White
Place of birth - Native, outside of US (%) - Black or African American
Place of birth - Native, outside of US (%) - Asian
Place of birth - Native, outside of US (%) - Hispanic or Latino
Place of birth - Native, outside of US (%) - American Indian and Alaska Native
Place of birth - Native, outside of US (%) - Multirace
Place of birth - Native, outside of US (%) - Other Race
Place of birth - Foreign born (%)
Place of birth - Foreign born (%) - White
Place of birth - Foreign born (%) - Black or African American
Place of birth - Foreign born (%) - Asian
Place of birth - Foreign born (%) - Hispanic or Latino
Place of birth - Foreign born (%) - American Indian and Alaska Native
Place of birth - Foreign born (%) - Multirace
Place of birth - Foreign born (%) - Other Race
Residents speaking English at home (%)
Residents speaking English at home - Born in the United States (%)
Residents speaking English at home - Native, born elsewhere (%)
Residents speaking English at home - Foreign born (%)
Residents speaking Spanish at home (%)
Residents speaking Spanish at home - Born in the United States (%)
Residents speaking Spanish at home - Native, born elsewhere (%)
Residents speaking Spanish at home - Foreign born (%)
Residents speaking other language at home (%)
Residents speaking other language at home - Born in the United States (%)
Residents speaking other language at home - Native, born elsewhere (%)
Residents speaking other language at home - Foreign born (%)
Marital status - Never married (%)
Marital status - Now married (%)
Marital status - Separated (%)
Marital status - Widowed (%)
Marital status - Divorced (%)
Ancestries Reported - Arab (%)
Ancestries Reported - Czech (%)
Ancestries Reported - Danish (%)
Ancestries Reported - Dutch (%)
Ancestries Reported - English (%)
Ancestries Reported - French (%)
Ancestries Reported - French Canadian (%)
Ancestries Reported - German (%)
Ancestries Reported - Greek (%)
Ancestries Reported - Hungarian (%)
Ancestries Reported - Irish (%)
Ancestries Reported - Italian (%)
Ancestries Reported - Lithuanian (%)
Ancestries Reported - Norwegian (%)
Ancestries Reported - Polish (%)
Ancestries Reported - Portuguese (%)
Ancestries Reported - Russian (%)
Ancestries Reported - Scotch-Irish (%)
Ancestries Reported - Scottish (%)
Ancestries Reported - Slovak (%)
Ancestries Reported - Subsaharan African (%)
Ancestries Reported - Swedish (%)
Ancestries Reported - Swiss (%)
Ancestries Reported - Ukrainian (%)
Ancestries Reported - United States (%)
Ancestries Reported - Welsh (%)
Ancestries Reported - West Indian (%)
Ancestries Reported - Other (%)
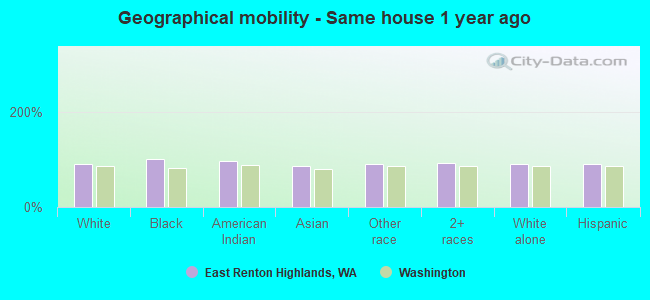
Geographical mobility - Same house 1 year ago (%)
Geographical mobility - Same house 1 year ago (%) - White
Geographical mobility - Same house 1 year ago (%) - Black or African American
Geographical mobility - Same house 1 year ago (%) - Asian
Geographical mobility - Same house 1 year ago (%) - Hispanic or Latino
Geographical mobility - Same house 1 year ago (%) - American Indian and Alaska Native
Geographical mobility - Same house 1 year ago (%) - Multirace
Geographical mobility - Same house 1 year ago (%) - Other Race
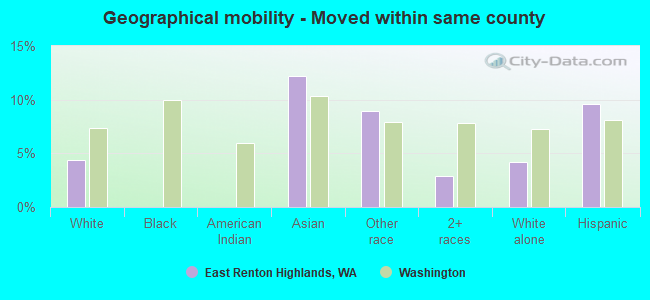
Geographical mobility - Moved within same county (%)
Geographical mobility - Moved within same county (%) - White
Geographical mobility - Moved within same county (%) - Black or African American
Geographical mobility - Moved within same county (%) - Asian
Geographical mobility - Moved within same county (%) - Hispanic or Latino
Geographical mobility - Moved within same county (%) - American Indian and Alaska Native
Geographical mobility - Moved within same county (%) - Multirace
Geographical mobility - Moved within same county (%) - Other Race
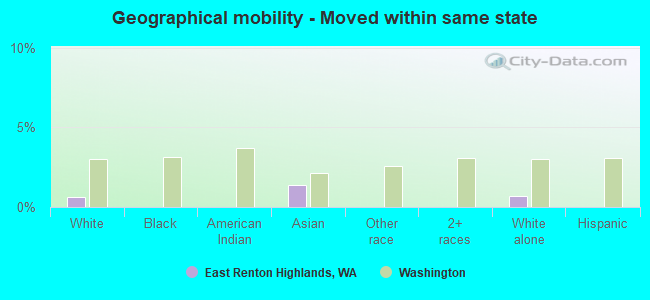
Geographical mobility - Moved from different county within same state (%)
Geographical mobility - Moved from different county within same state (%) - White
Geographical mobility - Moved from different county within same state (%) - Black or African American
Geographical mobility - Moved from different county within same state (%) - Asian
Geographical mobility - Moved from different county within same state (%) - Hispanic or Latino
Geographical mobility - Moved from different county within same state (%) - American Indian and Alaska Native
Geographical mobility - Moved from different county within same state (%) - Multirace
Geographical mobility - Moved from different county within same state (%) - Other Race
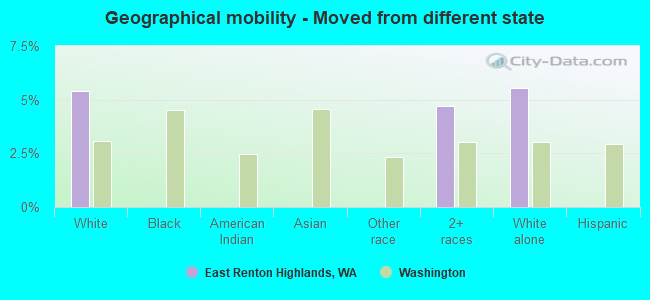
Geographical mobility - Moved from different state (%)
Geographical mobility - Moved from different state (%) - White
Geographical mobility - Moved from different state (%) - Black or African American
Geographical mobility - Moved from different state (%) - Asian
Geographical mobility - Moved from different state (%) - Hispanic or Latino
Geographical mobility - Moved from different state (%) - American Indian and Alaska Native
Geographical mobility - Moved from different state (%) - Multirace
Geographical mobility - Moved from different state (%) - Other Race
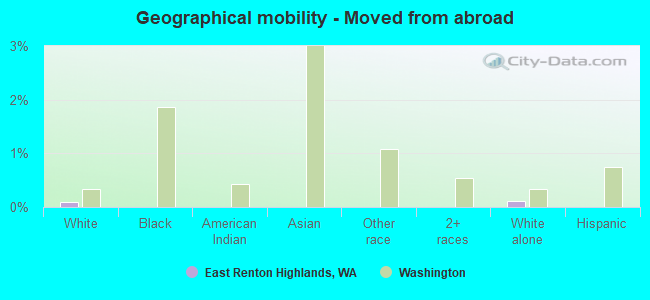
Geographical mobility - Moved from abroad (%)
Geographical mobility - Moved from abroad (%) - White
Geographical mobility - Moved from abroad (%) - Black or African American
Geographical mobility - Moved from abroad (%) - Asian
Geographical mobility - Moved from abroad (%) - Hispanic or Latino
Geographical mobility - Moved from abroad (%) - American Indian and Alaska Native
Geographical mobility - Moved from abroad (%) - Multirace
Geographical mobility - Moved from abroad (%) - Other Race
Place of birth for the foreign-born population - Ireland (%)
Place of birth for the foreign-born population - Denmark (%)
Place of birth for the foreign-born population - Norway (%)
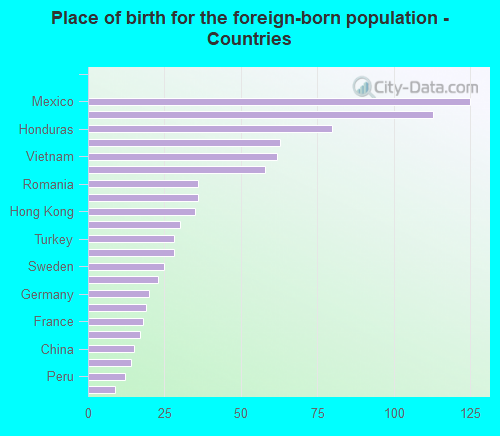
Place of birth for the foreign-born population - Sweden (%)
Place of birth for the foreign-born population - United Kingdom (%)
Place of birth for the foreign-born population - England (%)
Place of birth for the foreign-born population - Scotland (%)
Place of birth for the foreign-born population - Other Northern Europe (%)
Place of birth for the foreign-born population - Austria (%)
Place of birth for the foreign-born population - Belgium (%)
Place of birth for the foreign-born population - France (%)
Place of birth for the foreign-born population - Germany (%)
Place of birth for the foreign-born population - Netherlands (%)
Place of birth for the foreign-born population - Switzerland (%)
Place of birth for the foreign-born population - Other Western Europe (%)
Place of birth for the foreign-born population - Greece (%)
Place of birth for the foreign-born population - Italy (%)
Place of birth for the foreign-born population - Portugal (%)
Place of birth for the foreign-born population - Spain (%)
Place of birth for the foreign-born population - Other Southern Europe (%)
Place of birth for the foreign-born population - Albania (%)
Place of birth for the foreign-born population - Belarus (%)
Place of birth for the foreign-born population - Bosnia and Herzegovina (%)
Place of birth for the foreign-born population - Bulgaria (%)
Place of birth for the foreign-born population - Croatia (%)
Place of birth for the foreign-born population - Czechoslovakia (%)
Place of birth for the foreign-born population - Hungary (%)
Place of birth for the foreign-born population - Latvia (%)
Place of birth for the foreign-born population - Lithuania (%)
Place of birth for the foreign-born population - North Macedonia (Macedonia) (%)
Place of birth for the foreign-born population - Moldova (%)
Place of birth for the foreign-born population - Poland (%)
Place of birth for the foreign-born population - Romania (%)
Place of birth for the foreign-born population - Russia (%)
Place of birth for the foreign-born population - Serbia (%)
Place of birth for the foreign-born population - Ukraine (%)
Place of birth for the foreign-born population - Other Eastern Europe (%)
Place of birth for the foreign-born population - China (%)
Place of birth for the foreign-born population - Hong Kong (%)
Place of birth for the foreign-born population - Taiwan (%)
Place of birth for the foreign-born population - Japan (%)
Place of birth for the foreign-born population - Korea (%)
Place of birth for the foreign-born population - Other Eastern Asia (%)
Place of birth for the foreign-born population - Afghanistan (%)
Place of birth for the foreign-born population - Bangladesh (%)
Place of birth for the foreign-born population - India (%)
Place of birth for the foreign-born population - Iran (%)
Place of birth for the foreign-born population - Kazakhstan (%)
Place of birth for the foreign-born population - Nepal (%)
Place of birth for the foreign-born population - Pakistan (%)
Place of birth for the foreign-born population - Sri Lanka (%)
Place of birth for the foreign-born population - Uzbekistan (%)
Place of birth for the foreign-born population - Other South Central Asia (%)
Place of birth for the foreign-born population - Burma (%)
Place of birth for the foreign-born population - Cambodia (%)
Place of birth for the foreign-born population - Indonesia (%)
Place of birth for the foreign-born population - Laos (%)
Place of birth for the foreign-born population - Malaysia (%)
Place of birth for the foreign-born population - Philippines (%)
Place of birth for the foreign-born population - Singapore (%)
Place of birth for the foreign-born population - Thailand (%)
Place of birth for the foreign-born population - Vietnam (%)
Place of birth for the foreign-born population - Other South Eastern Asia (%)
Place of birth for the foreign-born population - Armenia (%)
Place of birth for the foreign-born population - Iraq (%)
Place of birth for the foreign-born population - Israel (%)
Place of birth for the foreign-born population - Jordan (%)
Place of birth for the foreign-born population - Kuwait (%)
Place of birth for the foreign-born population - Lebanon (%)
Place of birth for the foreign-born population - Saudi Arabia (%)
Place of birth for the foreign-born population - Syria (%)
Place of birth for the foreign-born population - Turkey (%)
Place of birth for the foreign-born population - Yemen (%)
Place of birth for the foreign-born population - Other Western Asia (%)
Place of birth for the foreign-born population - Eritrea (%)
Place of birth for the foreign-born population - Ethiopia (%)
Place of birth for the foreign-born population - Kenya (%)
Place of birth for the foreign-born population - Somalia (%)
Place of birth for the foreign-born population - Uganda (%)
Place of birth for the foreign-born population - Zimbabwe (%)
Place of birth for the foreign-born population - Other Eastern Africa (%)
Place of birth for the foreign-born population - Cameroon (%)
Place of birth for the foreign-born population - Congo (%)
Place of birth for the foreign-born population - Democratic Republic of Congo (Zaire) (%)
Place of birth for the foreign-born population - Other Middle Africa (%)
Place of birth for the foreign-born population - Egypt (%)
Place of birth for the foreign-born population - Morocco (%)
Place of birth for the foreign-born population - Sudan (%)
Place of birth for the foreign-born population - Other Northern Africa (%)
Place of birth for the foreign-born population - South Africa (%)
Place of birth for the foreign-born population - Other Southern Africa (%)
Place of birth for the foreign-born population - Cabo Verde (%)
Place of birth for the foreign-born population - Ghana (%)
Place of birth for the foreign-born population - Liberia (%)
Place of birth for the foreign-born population - Nigeria (%)
Place of birth for the foreign-born population - Senegal (%)
Place of birth for the foreign-born population - Sierra Leone (%)
Place of birth for the foreign-born population - Other Western Africa (%)
Place of birth for the foreign-born population - Australia (%)
Place of birth for the foreign-born population - New Zealand (%)
Place of birth for the foreign-born population - Fiji (%)
Place of birth for the foreign-born population - Micronesia (%)
Place of birth for the foreign-born population - Bahamas (%)
Place of birth for the foreign-born population - Barbados (%)
Place of birth for the foreign-born population - Cuba (%)
Place of birth for the foreign-born population - Dominica (%)
Place of birth for the foreign-born population - Dominican Republic (%)
Place of birth for the foreign-born population - Grenada (%)
Place of birth for the foreign-born population - Haiti (%)
Place of birth for the foreign-born population - Jamaica (%)
Place of birth for the foreign-born population - St. Vincent and the Grenadines (%)
Place of birth for the foreign-born population - Trinidad and Tobago (%)
Place of birth for the foreign-born population - West Indies (%)
Place of birth for the foreign-born population - Other Caribbean (%)
Place of birth for the foreign-born population - Belize (%)
Place of birth for the foreign-born population - Costa Rica (%)
Place of birth for the foreign-born population - El Salvador (%)
Place of birth for the foreign-born population - Guatemala (%)
Place of birth for the foreign-born population - Honduras (%)
Place of birth for the foreign-born population - Mexico (%)
Place of birth for the foreign-born population - Nicaragua (%)
Place of birth for the foreign-born population - Panama (%)
Place of birth for the foreign-born population - Other Central America (%)
Place of birth for the foreign-born population - Argentina (%)
Place of birth for the foreign-born population - Bolivia (%)
Place of birth for the foreign-born population - Brazil (%)
Place of birth for the foreign-born population - Chile (%)
Place of birth for the foreign-born population - Colombia (%)
Place of birth for the foreign-born population - Ecuador (%)
Place of birth for the foreign-born population - Guyana (%)
Place of birth for the foreign-born population - Peru (%)
Place of birth for the foreign-born population - Uruguay (%)
Place of birth for the foreign-born population - Venezuela (%)
Place of birth for the foreign-born population - Other South America (%)
Place of birth for the foreign-born population - Canada (%)
Place of birth for the foreign-born population - Other Northern America (%)
Place of birth for the foreign-born population - Other (%)
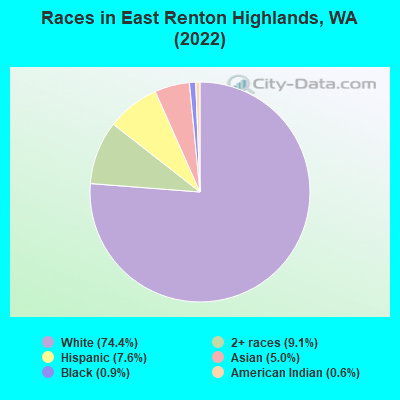
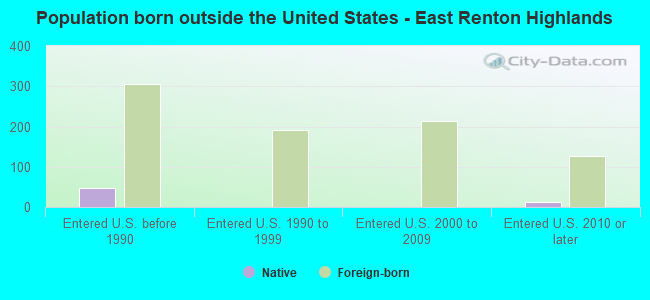
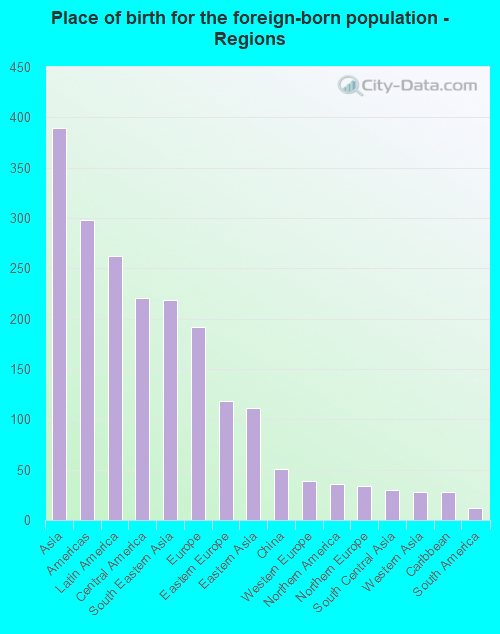
According to 2022 data, the most numerous races in East Renton Highlands, WA are White alone (9,030 residents), Hispanic (923 residents), and Asian alone (613 residents). 86.5% of East Renton Highlands residents speak English at home. 7.2% of East Renton Highlands, WA residents are foreign-born (3.1% born in Asia, 2.1% born in Latin America, 1.5% born in Europe), which is 107.0% less than the foreign-born rate of 15.0% across the entire state of Washington.
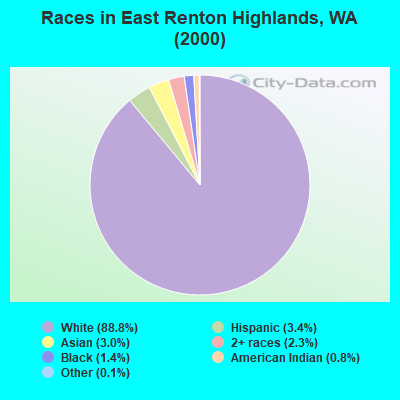
Race distribution in East Renton Highlands
2000 2022
4,652,490 78.9% White alone 441,509 7.5% Hispanic 319,401 5.4% Asian alone 184,631 3.1% Black alone 175,926 3.0% Two or more races 85,396 1.4% American Indian alone 22,779 0.4% Native Hawaiian and Other 11,989 0.2% Other race alone
4,941,456 63.5% White alone 1,093,313 14.0% Hispanic 755,832 9.7% Asian alone 523,448 6.7% Two or more races 299,537 3.8% Black alone 69,024 0.9% American Indian alone 52,231 0.7% Native Hawaiian and Other 50,945 0.7% Other race alone
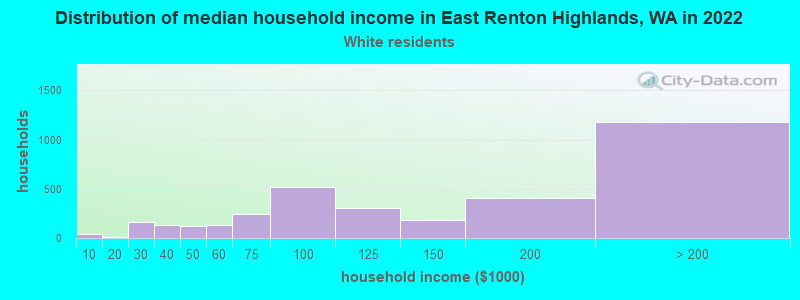
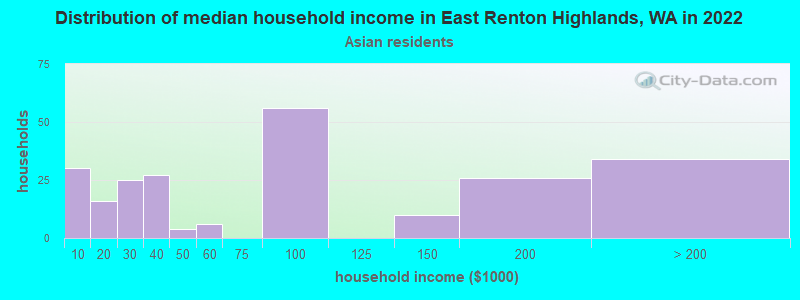
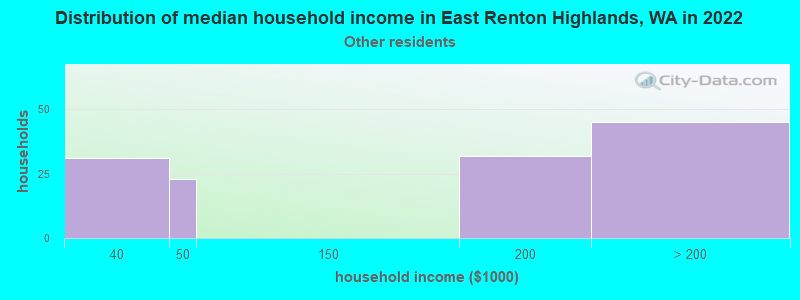
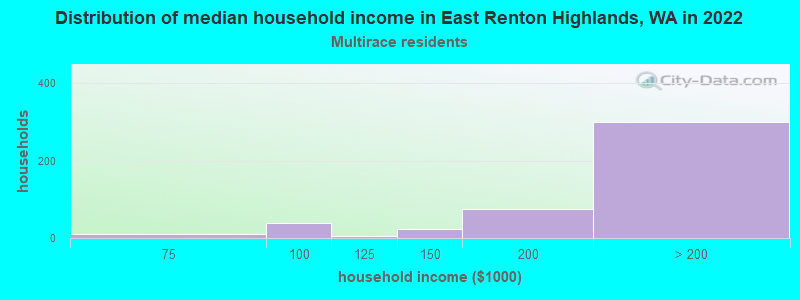
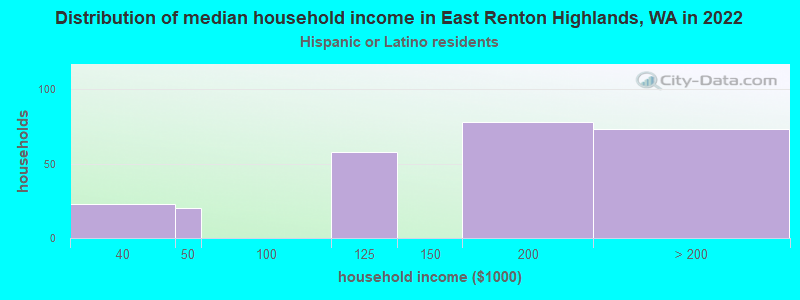
Income and house value in East Renton Highlands Median household income in 2022 $129,437 White non-Hispanic householders$85,737 Asian householdersover $200,000 Two or more races householders$159,618 Hispanic or Latino race householdersMedian 2022 house value $799,763 White Non-Hispanic householders$875,243 Black or African American householders$883,272 American Indian or Alaska Native householders over $1,000,000 Asian householders$768,045 Some other race householders$492,223 Two or more races householders$743,153 Hispanic or Latino householders
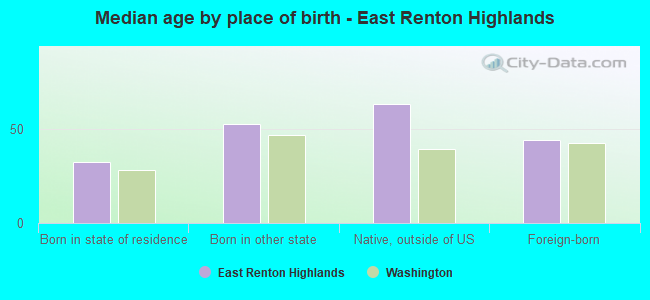
Median age by race in East Renton Highlands
44.9 Median age for White residents45.5 44.6 9.4 Median age for Black or African American residents5.2 31.7 18.9 Median age for American Indian / Alaska Native residents-658,092,175.1 18.7 39.8 Median age for Asian residents38.6 40.1 -653,927,812.5 Median age for Native Hawaiian / Pacific Islander residents-664,509,168.7 -651,945,320.1 26.7 Median age for Other race residents30.2 17.6 31.0 Median age for Two or more races residents30.4 36.4 44.7 Median age for White alone residents47.1 44.3 23.0 Median age for Hispanic or Latino residents28.6 17.3
Owner/renter occupied households by race in East Renton Highlands
House owners and renters - White residents 3,087 89.6% Owner occupied360 10.4% Renter occupiedHouse owners and renters - Black or African American residents 40 100.0% Owner occupiedHouse owners and renters - American Indian / Alaska Native residents 11 100.0% Renter occupiedHouse owners and renters - Asian residents 213 90.9% Owner occupied21 9.1% Renter occupiedHouse owners and renters - Other race residents 36 26.8% Owner occupied97 73.2% Renter occupiedHouse owners and renters - Two or more races residents 429 93.1% Owner occupied32 6.9% Renter occupiedHouse owners and renters - White alone residents 3,022 89.2% Owner occupied367 10.8% Renter occupiedHouse owners and renters - Hispanic or Latino residents 169 65.4% Owner occupied90 34.6% Renter occupied
Language usage in East Renton Highlands
English speakers - Total 86.5% of residents of East Renton Highlands speak English at home.
4.3% of residents speak Spanish at home 316 64.0% Speak English very well178 36.0% Speak English less than very well7.5% of residents speak other language at home 584 67.0% Speak English very well288 33.0% Speak English less than very well
English speakers - Born in the United States 95.3% of residents of East Renton Highlands speak English at home.
1.8% of residents speak Spanish at home 53 67.9% Speak English very well25 32.1% Speak English less than very well2.5% of residents speak other language at home 97 86.6% Speak English very well15 13.4% Speak English less than very well
English speakers - Native, born elsewhere 71.7% of residents of East Renton Highlands speak English at home.
23.3% of residents speak other language at home 14 100.0% Speak English very well
English speakers - Foreign-born 19.5% of residents of East Renton Highlands speak English at home.
22.2% of residents speak Spanish at home 52 26.7% Speak English very well143 73.3% Speak English less than very well57.0% of residents speak other language at home 260 51.8% Speak English very well242 48.2% Speak English less than very well
White (Caucasian) - Speak only English Native:
97.3% (8,306)Foreign-born:
33.4% (69)
White (Caucasian) - Speak another language Native:
2.7% (230)Foreign-born:
66.5% (137)
Asian - Speak only English Native:
52.8% (139)Foreign-born:
11.7% (39)
Asian - Speak another language Native:
47.7% (125)Foreign-born:
88.3% (293)
Other race - Speak only English Native:
12.5% (29)Foreign-born:
13.0% (29)
Other race - Speak another language Native:
86.0% (199)Foreign-born:
84.9% (187)
Two or more races - Speak only English Native:
89.6% (1,066)Foreign-born:
23.3% (35)
Two or more races - Speak another language Native:
9.3% (111)Foreign-born:
76.4% (113)
White alone - Speak only English Native:
97.2% (8,192)Foreign-born:
30.9% (70)
White alone - Speak another language Native:
2.7% (225)Foreign-born:
69.4% (157)
Hispanic or Latino - Speak only English Native:
56.5% (329)Foreign-born:
12.4% (28)
Hispanic or Latino - Speak another language Native:
43.3% (252)Foreign-born:
86.7% (196)
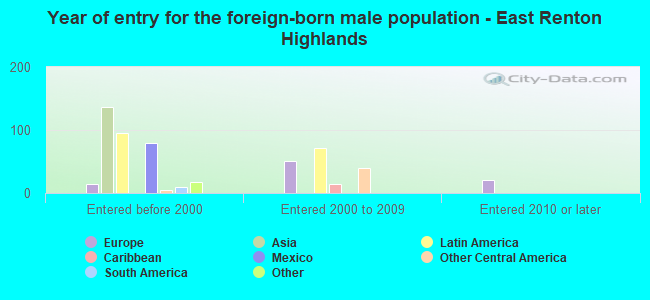
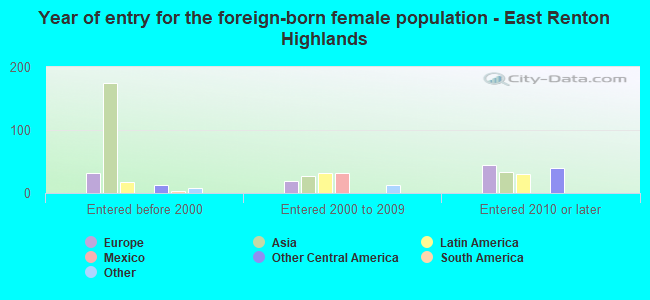
Foreign-born residents in East Renton Highlands 880 residents are foreign born (3.1% Asia , 2.1% Latin America , 1.5% Europe ).
This city:
7.2%Washington:
14.9%
Marital status for residents in East Renton Highlands Marital status - White (Caucasian) population 15 years and over
Males 21.1% Never married67.6% Now married0.2% Separated1.3% Widowed9.8% DivorcedFemales 24.8% Never married61.0% Now married0.5% Separated5.8% Widowed7.9% DivorcedWomen who gave birth in the past 12 months Now married:
94.2% (90)Unmarried:
5.8% (6)
Women who did not give birth in the past 12 months Now married:
49.0% (916)Unmarried:
51.0% (953)
Marital status - Black or African American population 15 years and over
Males 0.0% Never married100.0% Now married0.0% Separated0.0% Widowed0.0% DivorcedFemales 14.8% Never married0.0% Now married0.0% Separated0.0% Widowed85.2% DivorcedWomen who did not give birth in the past 12 months Now married:
0.0% (0)Unmarried:
100.0% (4)
Marital status - American Indian / Alaska Native population 15 years and over
Males 0.0% Never married100.0% Now married0.0% Separated0.0% Widowed0.0% DivorcedFemales 67.9% Never married32.1% Now married0.0% Separated0.0% Widowed0.0% DivorcedWomen who did not give birth in the past 12 months Now married:
0.0% (0)Unmarried:
100.0% (43)
Marital status - Asian population 15 years and over
Males 6.0% Never married80.5% Now married0.0% Separated13.5% Widowed0.0% DivorcedFemales 5.2% Never married68.0% Now married0.0% Separated18.6% Widowed8.2% DivorcedWomen who gave birth in the past 12 months Now married:
100.0% (7)Unmarried:
0.0% (0)
Women who did not give birth in the past 12 months Now married:
91.0% (134)Unmarried:
9.0% (13)
Marital status - Other race population 15 years and over
Males 71.2% Never married15.0% Now married0.0% Separated0.0% Widowed13.7% DivorcedFemales 68.9% Never married31.1% Now married0.0% Separated0.0% Widowed0.0% DivorcedWomen who did not give birth in the past 12 months Now married:
22.3% (26)Unmarried:
77.7% (90)
Marital status - Two or more races population 15 years and over
Males 29.5% Never married70.5% Now married0.0% Separated0.0% Widowed0.0% DivorcedFemales 25.1% Never married61.4% Now married0.0% Separated1.2% Widowed12.3% DivorcedWomen who did not give birth in the past 12 months Now married:
68.4% (221)Unmarried:
31.6% (102)
Marital status - White alone, not Hispanic / Latino population 15 years and over
Males 19.6% Never married68.7% Now married0.2% Separated1.4% Widowed10.2% DivorcedFemales 24.5% Never married61.2% Now married0.5% Separated5.9% Widowed7.8% DivorcedWomen who gave birth in the past 12 months Now married:
94.2% (92)Unmarried:
5.8% (6)
Women who did not give birth in the past 12 months Now married:
49.5% (929)Unmarried:
50.5% (947)
Marital status - Hispanic or Latino population 15 years and over
Males 62.6% Never married31.6% Now married0.0% Separated0.0% Widowed5.8% DivorcedFemales 50.7% Never married37.6% Now married0.0% Separated0.0% Widowed11.7% DivorcedWomen who did not give birth in the past 12 months Now married:
21.3% (37)Unmarried:
78.7% (138)
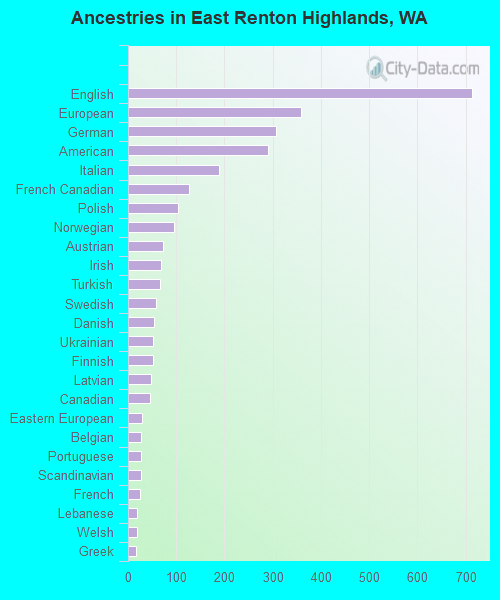
Ancestries in East Renton Highlands
713 15.2% English358 7.6% European306 6.5% German290 6.2% American188 4.0% Italian126 2.7% French Canadian104 2.2% Polish95 2.0% Norwegian73 1.6% Austrian69 1.5% Irish67 1.4% Turkish58 1.2% Swedish54 1.2% Danish52 1.1% Ukrainian51 1.1% Finnish47 1.0% Latvian46 1.0% Canadian28 0.6% Eastern European27 0.6% Belgian27 0.6% Portuguese26 0.6% Scandinavian24 0.5% French19 0.4% Lebanese19 0.4% Welsh16 0.3% Greek15 0.3% Scottish10 0.2% Scotch-Irish8 0.2% Northern European8 0.2% Slovak7 0.1% Dutch4 0.09% Hungarian3 0.06% Romanian
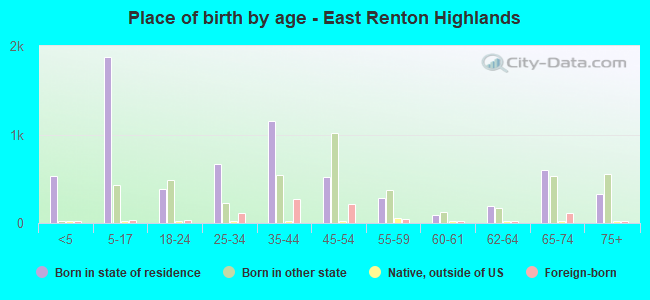
Children Nativity (place of birth) in East Renton Highlands
Children under 6 years - Living with two parents Both parents native 415 100.0% NativeOne native, one foreign-born parent 155 100.0% NativeChildren under 6 years - Living with one parent Native parent 64 100.0% NativeForeign-born parent 63 100.0% NativeChildren 6 to 17 years - Living with two parents Both parents native 1,517 100.0% Native0 0.0% Foreign-bornBoth parents foreign-born 134 93.3% Native10 6.7% Foreign-bornOne native, one foreign-born parent 114 94.0% Native7 6.0% Foreign-bornChildren 6 to 17 years - Living with one parent Native parent 93 100.0% NativeForeign-born parent 163 54.4% Native136 45.6% Foreign-born