Races in East Point, Georgia (GA) Detailed Stats
Data:
Races - White alone (%)
Races - White alone (% change since 2000)
Races - Black alone (%)
Races - Black alone (% change since 2000)
Races - American Indian alone (%)
Races - American Indian alone (% change since 2000)
Races - Asian alone (%)
Races - Asian alone (% change since 2000)
Races - Hispanic (%)
Races - Hispanic (% change since 2000)
Races - Native Hawaiian and Other Pacific Islander alone (%)
Races - Native Hawaiian and Other Pacific Islander alone (% change since 2000)
Races - Two or more races(%)
Races - Two or more races(% change since 2000)
Races - Other race alone (%)
Races - Other race alone (% change since 2000)
Racial diversity
Place of birth - Born in state of residence (%)
Place of birth - Born in state of residence (%) - White
Place of birth - Born in state of residence (%) - Black or African American
Place of birth - Born in state of residence (%) - Asian
Place of birth - Born in state of residence (%) - Hispanic or Latino
Place of birth - Born in state of residence (%) - American Indian and Alaska Native
Place of birth - Born in state of residence (%) - Multirace
Place of birth - Born in state of residence (%) - Other Race
Place of birth - Born in other state (%)
Place of birth - Born in other state (%) - White
Place of birth - Born in other state (%) - Black or African American
Place of birth - Born in other state (%) - Asian
Place of birth - Born in other state (%) - Hispanic or Latino
Place of birth - Born in other state (%) - American Indian and Alaska Native
Place of birth - Born in other state (%) - Multirace
Place of birth - Born in other state (%) - Other Race
Place of birth - Native, outside of US (%)
Place of birth - Native, outside of US (%) - White
Place of birth - Native, outside of US (%) - Black or African American
Place of birth - Native, outside of US (%) - Asian
Place of birth - Native, outside of US (%) - Hispanic or Latino
Place of birth - Native, outside of US (%) - American Indian and Alaska Native
Place of birth - Native, outside of US (%) - Multirace
Place of birth - Native, outside of US (%) - Other Race
Place of birth - Foreign born (%)
Place of birth - Foreign born (%) - White
Place of birth - Foreign born (%) - Black or African American
Place of birth - Foreign born (%) - Asian
Place of birth - Foreign born (%) - Hispanic or Latino
Place of birth - Foreign born (%) - American Indian and Alaska Native
Place of birth - Foreign born (%) - Multirace
Place of birth - Foreign born (%) - Other Race
Residents speaking English at home (%)
Residents speaking English at home - Born in the United States (%)
Residents speaking English at home - Native, born elsewhere (%)
Residents speaking English at home - Foreign born (%)
Residents speaking Spanish at home (%)
Residents speaking Spanish at home - Born in the United States (%)
Residents speaking Spanish at home - Native, born elsewhere (%)
Residents speaking Spanish at home - Foreign born (%)
Residents speaking other language at home (%)
Residents speaking other language at home - Born in the United States (%)
Residents speaking other language at home - Native, born elsewhere (%)
Residents speaking other language at home - Foreign born (%)
Marital status - Never married (%)
Marital status - Now married (%)
Marital status - Separated (%)
Marital status - Widowed (%)
Marital status - Divorced (%)
Ancestries Reported - Arab (%)
Ancestries Reported - Czech (%)
Ancestries Reported - Danish (%)
Ancestries Reported - Dutch (%)
Ancestries Reported - English (%)
Ancestries Reported - French (%)
Ancestries Reported - French Canadian (%)
Ancestries Reported - German (%)
Ancestries Reported - Greek (%)
Ancestries Reported - Hungarian (%)
Ancestries Reported - Irish (%)
Ancestries Reported - Italian (%)
Ancestries Reported - Lithuanian (%)
Ancestries Reported - Norwegian (%)
Ancestries Reported - Polish (%)
Ancestries Reported - Portuguese (%)
Ancestries Reported - Russian (%)
Ancestries Reported - Scotch-Irish (%)
Ancestries Reported - Scottish (%)
Ancestries Reported - Slovak (%)
Ancestries Reported - Subsaharan African (%)
Ancestries Reported - Swedish (%)
Ancestries Reported - Swiss (%)
Ancestries Reported - Ukrainian (%)
Ancestries Reported - United States (%)
Ancestries Reported - Welsh (%)
Ancestries Reported - West Indian (%)
Ancestries Reported - Other (%)
Geographical mobility - Same house 1 year ago (%)
Geographical mobility - Same house 1 year ago (%) - White
Geographical mobility - Same house 1 year ago (%) - Black or African American
Geographical mobility - Same house 1 year ago (%) - Asian
Geographical mobility - Same house 1 year ago (%) - Hispanic or Latino
Geographical mobility - Same house 1 year ago (%) - American Indian and Alaska Native
Geographical mobility - Same house 1 year ago (%) - Multirace
Geographical mobility - Same house 1 year ago (%) - Other Race
Geographical mobility - Moved within same county (%)
Geographical mobility - Moved within same county (%) - White
Geographical mobility - Moved within same county (%) - Black or African American
Geographical mobility - Moved within same county (%) - Asian
Geographical mobility - Moved within same county (%) - Hispanic or Latino
Geographical mobility - Moved within same county (%) - American Indian and Alaska Native
Geographical mobility - Moved within same county (%) - Multirace
Geographical mobility - Moved within same county (%) - Other Race
Geographical mobility - Moved from different county within same state (%)
Geographical mobility - Moved from different county within same state (%) - White
Geographical mobility - Moved from different county within same state (%) - Black or African American
Geographical mobility - Moved from different county within same state (%) - Asian
Geographical mobility - Moved from different county within same state (%) - Hispanic or Latino
Geographical mobility - Moved from different county within same state (%) - American Indian and Alaska Native
Geographical mobility - Moved from different county within same state (%) - Multirace
Geographical mobility - Moved from different county within same state (%) - Other Race
Geographical mobility - Moved from different state (%)
Geographical mobility - Moved from different state (%) - White
Geographical mobility - Moved from different state (%) - Black or African American
Geographical mobility - Moved from different state (%) - Asian
Geographical mobility - Moved from different state (%) - Hispanic or Latino
Geographical mobility - Moved from different state (%) - American Indian and Alaska Native
Geographical mobility - Moved from different state (%) - Multirace
Geographical mobility - Moved from different state (%) - Other Race
Geographical mobility - Moved from abroad (%)
Geographical mobility - Moved from abroad (%) - White
Geographical mobility - Moved from abroad (%) - Black or African American
Geographical mobility - Moved from abroad (%) - Asian
Geographical mobility - Moved from abroad (%) - Hispanic or Latino
Geographical mobility - Moved from abroad (%) - American Indian and Alaska Native
Geographical mobility - Moved from abroad (%) - Multirace
Geographical mobility - Moved from abroad (%) - Other Race
Place of birth for the foreign-born population - Ireland (%)
Place of birth for the foreign-born population - Denmark (%)
Place of birth for the foreign-born population - Norway (%)
Place of birth for the foreign-born population - Sweden (%)
Place of birth for the foreign-born population - United Kingdom (%)
Place of birth for the foreign-born population - England (%)
Place of birth for the foreign-born population - Scotland (%)
Place of birth for the foreign-born population - Other Northern Europe (%)
Place of birth for the foreign-born population - Austria (%)
Place of birth for the foreign-born population - Belgium (%)
Place of birth for the foreign-born population - France (%)
Place of birth for the foreign-born population - Germany (%)
Place of birth for the foreign-born population - Netherlands (%)
Place of birth for the foreign-born population - Switzerland (%)
Place of birth for the foreign-born population - Other Western Europe (%)
Place of birth for the foreign-born population - Greece (%)
Place of birth for the foreign-born population - Italy (%)
Place of birth for the foreign-born population - Portugal (%)
Place of birth for the foreign-born population - Spain (%)
Place of birth for the foreign-born population - Other Southern Europe (%)
Place of birth for the foreign-born population - Albania (%)
Place of birth for the foreign-born population - Belarus (%)
Place of birth for the foreign-born population - Bosnia and Herzegovina (%)
Place of birth for the foreign-born population - Bulgaria (%)
Place of birth for the foreign-born population - Croatia (%)
Place of birth for the foreign-born population - Czechoslovakia (%)
Place of birth for the foreign-born population - Hungary (%)
Place of birth for the foreign-born population - Latvia (%)
Place of birth for the foreign-born population - Lithuania (%)
Place of birth for the foreign-born population - North Macedonia (Macedonia) (%)
Place of birth for the foreign-born population - Moldova (%)
Place of birth for the foreign-born population - Poland (%)
Place of birth for the foreign-born population - Romania (%)
Place of birth for the foreign-born population - Russia (%)
Place of birth for the foreign-born population - Serbia (%)
Place of birth for the foreign-born population - Ukraine (%)
Place of birth for the foreign-born population - Other Eastern Europe (%)
Place of birth for the foreign-born population - China (%)
Place of birth for the foreign-born population - Hong Kong (%)
Place of birth for the foreign-born population - Taiwan (%)
Place of birth for the foreign-born population - Japan (%)
Place of birth for the foreign-born population - Korea (%)
Place of birth for the foreign-born population - Other Eastern Asia (%)
Place of birth for the foreign-born population - Afghanistan (%)
Place of birth for the foreign-born population - Bangladesh (%)
Place of birth for the foreign-born population - India (%)
Place of birth for the foreign-born population - Iran (%)
Place of birth for the foreign-born population - Kazakhstan (%)
Place of birth for the foreign-born population - Nepal (%)
Place of birth for the foreign-born population - Pakistan (%)
Place of birth for the foreign-born population - Sri Lanka (%)
Place of birth for the foreign-born population - Uzbekistan (%)
Place of birth for the foreign-born population - Other South Central Asia (%)
Place of birth for the foreign-born population - Burma (%)
Place of birth for the foreign-born population - Cambodia (%)
Place of birth for the foreign-born population - Indonesia (%)
Place of birth for the foreign-born population - Laos (%)
Place of birth for the foreign-born population - Malaysia (%)
Place of birth for the foreign-born population - Philippines (%)
Place of birth for the foreign-born population - Singapore (%)
Place of birth for the foreign-born population - Thailand (%)
Place of birth for the foreign-born population - Vietnam (%)
Place of birth for the foreign-born population - Other South Eastern Asia (%)
Place of birth for the foreign-born population - Armenia (%)
Place of birth for the foreign-born population - Iraq (%)
Place of birth for the foreign-born population - Israel (%)
Place of birth for the foreign-born population - Jordan (%)
Place of birth for the foreign-born population - Kuwait (%)
Place of birth for the foreign-born population - Lebanon (%)
Place of birth for the foreign-born population - Saudi Arabia (%)
Place of birth for the foreign-born population - Syria (%)
Place of birth for the foreign-born population - Turkey (%)
Place of birth for the foreign-born population - Yemen (%)
Place of birth for the foreign-born population - Other Western Asia (%)
Place of birth for the foreign-born population - Eritrea (%)
Place of birth for the foreign-born population - Ethiopia (%)
Place of birth for the foreign-born population - Kenya (%)
Place of birth for the foreign-born population - Somalia (%)
Place of birth for the foreign-born population - Uganda (%)
Place of birth for the foreign-born population - Zimbabwe (%)
Place of birth for the foreign-born population - Other Eastern Africa (%)
Place of birth for the foreign-born population - Cameroon (%)
Place of birth for the foreign-born population - Congo (%)
Place of birth for the foreign-born population - Democratic Republic of Congo (Zaire) (%)
Place of birth for the foreign-born population - Other Middle Africa (%)
Place of birth for the foreign-born population - Egypt (%)
Place of birth for the foreign-born population - Morocco (%)
Place of birth for the foreign-born population - Sudan (%)
Place of birth for the foreign-born population - Other Northern Africa (%)
Place of birth for the foreign-born population - South Africa (%)
Place of birth for the foreign-born population - Other Southern Africa (%)
Place of birth for the foreign-born population - Cabo Verde (%)
Place of birth for the foreign-born population - Ghana (%)
Place of birth for the foreign-born population - Liberia (%)
Place of birth for the foreign-born population - Nigeria (%)
Place of birth for the foreign-born population - Senegal (%)
Place of birth for the foreign-born population - Sierra Leone (%)
Place of birth for the foreign-born population - Other Western Africa (%)
Place of birth for the foreign-born population - Australia (%)
Place of birth for the foreign-born population - New Zealand (%)
Place of birth for the foreign-born population - Fiji (%)
Place of birth for the foreign-born population - Micronesia (%)
Place of birth for the foreign-born population - Bahamas (%)
Place of birth for the foreign-born population - Barbados (%)
Place of birth for the foreign-born population - Cuba (%)
Place of birth for the foreign-born population - Dominica (%)
Place of birth for the foreign-born population - Dominican Republic (%)
Place of birth for the foreign-born population - Grenada (%)
Place of birth for the foreign-born population - Haiti (%)
Place of birth for the foreign-born population - Jamaica (%)
Place of birth for the foreign-born population - St. Vincent and the Grenadines (%)
Place of birth for the foreign-born population - Trinidad and Tobago (%)
Place of birth for the foreign-born population - West Indies (%)
Place of birth for the foreign-born population - Other Caribbean (%)
Place of birth for the foreign-born population - Belize (%)
Place of birth for the foreign-born population - Costa Rica (%)
Place of birth for the foreign-born population - El Salvador (%)
Place of birth for the foreign-born population - Guatemala (%)
Place of birth for the foreign-born population - Honduras (%)
Place of birth for the foreign-born population - Mexico (%)
Place of birth for the foreign-born population - Nicaragua (%)
Place of birth for the foreign-born population - Panama (%)
Place of birth for the foreign-born population - Other Central America (%)
Place of birth for the foreign-born population - Argentina (%)
Place of birth for the foreign-born population - Bolivia (%)
Place of birth for the foreign-born population - Brazil (%)
Place of birth for the foreign-born population - Chile (%)
Place of birth for the foreign-born population - Colombia (%)
Place of birth for the foreign-born population - Ecuador (%)
Place of birth for the foreign-born population - Guyana (%)
Place of birth for the foreign-born population - Peru (%)
Place of birth for the foreign-born population - Uruguay (%)
Place of birth for the foreign-born population - Venezuela (%)
Place of birth for the foreign-born population - Other South America (%)
Place of birth for the foreign-born population - Canada (%)
Place of birth for the foreign-born population - Other Northern America (%)
Place of birth for the foreign-born population - Other (%)
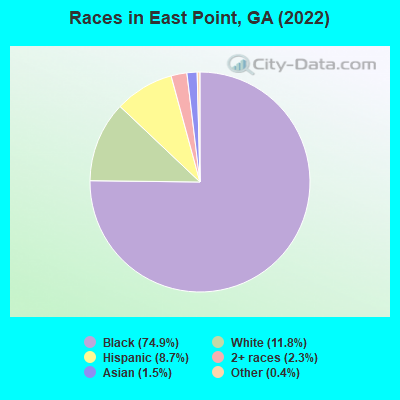
According to 2022 data, the most numerous races in East Point, GA are White alone (4,542 residents), Black alone (28,896 residents), and Hispanic (3,371 residents). 88.3% of East Point residents speak English at home. 6.5% of East Point, GA residents are foreign-born (3.0% born in Latin America, 1.7% born in Africa, 1.1% born in Asia), which is 53.2% less than the foreign-born rate of 10.0% across the entire state of Georgia.
Race distribution in East Point
2000 2022
5,128,661 62.6% White alone 2,331,465 28.5% Black alone 435,227 5.3% Hispanic 171,513 2.1% Asian alone 87,364 1.1% Two or more races 17,670 0.2% American Indian alone 11,275 0.1% Other race alone 3,278 0.04% Native Hawaiian and Other
5,415,657 49.6% White alone 3,349,240 30.7% Black alone 1,132,604 10.4% Hispanic 479,156 4.4% Asian alone 462,923 4.2% Two or more races 54,416 0.5% Other race alone 11,923 0.1% American Indian alone 6,957 0.06% Native Hawaiian and Other
Income and house value in East Point Median household income in 2022 $77,815 White non-Hispanic householders$62,804 Black householders$129,301 American Indian and Alaska Native householders$96,725 Asian householders$43,973 Some other race householders$60,291 Two or more races householders$52,610 Hispanic or Latino race householdersMedian 2022 house value $225,333 White Non-Hispanic householders$249,838 Black or African American householders$269,555 American Indian or Alaska Native householders $774,584 Asian householders$210,968 Some other race householders$302,792 Two or more races householders$219,137 Hispanic or Latino householders
Median age by race in East Point
41.9 Median age for White residents44.2 38.5 34.6 Median age for Black or African American residents31.1 36.7 36.4 Median age for American Indian / Alaska Native residents17.3 61.4 35.2 Median age for Asian residents33.6 42.1 -866,062,436.2 Median age for Native Hawaiian / Pacific Islander residents-658,602,149.9 -776,776,776.0 28.7 Median age for Other race residents25.4 33.9 26.6 Median age for Two or more races residents27.3 26.7 42.7 Median age for White alone residents44.8 41.4 23.3 Median age for Hispanic or Latino residents22.7 26.6
Owner/renter occupied households by race in East Point
House owners and renters - White residents 1,980 77.5% Owner occupied575 22.5% Renter occupiedHouse owners and renters - Black or African American residents 4,698 37.9% Owner occupied7,693 62.1% Renter occupiedHouse owners and renters - American Indian / Alaska Native residents 8 45.3% Owner occupied10 54.7% Renter occupiedHouse owners and renters - Asian residents 144 73.3% Owner occupied52 26.7% Renter occupiedHouse owners and renters - Other race residents 199 29.4% Owner occupied479 70.6% Renter occupiedHouse owners and renters - Two or more races residents 279 43.2% Owner occupied367 56.8% Renter occupiedHouse owners and renters - White alone residents 1,777 77.1% Owner occupied529 22.9% Renter occupiedHouse owners and renters - Hispanic or Latino residents 436 48.4% Owner occupied464 51.6% Renter occupied
Language usage in East Point
English speakers - Total 88.3% of residents of East Point speak English at home.
8.1% of residents speak Spanish at home 1,918 65.8% Speak English very well999 34.2% Speak English less than very well3.7% of residents speak other language at home 1,162 86.7% Speak English very well178 13.3% Speak English less than very well
English speakers - Born in the United States 94.7% of residents of East Point speak English at home.
3.3% of residents speak Spanish at home 395 83.5% Speak English very well78 16.5% Speak English less than very well1.7% of residents speak other language at home 245 100.0% Speak English very well
English speakers - Native, born elsewhere 84.2% of residents of East Point speak English at home.
13.4% of residents speak Spanish at home 69 100.0% Speak English very well
English speakers - Foreign-born 19.3% of residents of East Point speak English at home.
46.5% of residents speak Spanish at home 370 32.8% Speak English very well758 67.2% Speak English less than very well35.7% of residents speak other language at home 722 83.5% Speak English very well143 16.5% Speak English less than very well
White (Caucasian) - Speak only English Native:
88.3% (4,156)Foreign-born:
22.5% (75)
White (Caucasian) - Speak another language Native:
9.5% (446)Foreign-born:
74.6% (248)
Black or African American - Speak only English Native:
97.5% (25,544)Foreign-born:
41.1% (367)
Black or African American - Speak another language Native:
2.5% (668)Foreign-born:
58.6% (522)
American Indian / Alaska Native - Speak another language Native:
49.0% (15)Foreign-born:
100.0% (19)
Asian - Speak only English Native:
48.3% (85)Foreign-born:
14.9% (61)
Asian - Speak another language Native:
51.5% (90)Foreign-born:
85.0% (348)
Other race - Speak another language Native:
62.6% (779)Foreign-born:
100.0% (718)
Two or more races - Speak only English Native:
76.2% (944)Foreign-born:
1.8% (5)
Two or more races - Speak another language Native:
23.8% (295)Foreign-born:
99.3% (309)
White alone - Speak only English Native:
98.5% (4,090)Foreign-born:
49.2% (79)
White alone - Speak another language Native:
1.4% (57)Foreign-born:
51.4% (83)
Hispanic or Latino - Speak another language Native:
67.1% (1,326)Foreign-born:
100.0% (1,108)
Foreign-born residents in East Point 2,518 residents are foreign born (3.0% Latin America , 1.7% Africa , 1.1% Asia ).
This city:
6.5%Georgia:
10.4%
Marital status for residents in East Point Marital status - White (Caucasian) population 15 years and over
Males 49.4% Never married34.9% Now married1.6% Separated2.5% Widowed11.7% DivorcedFemales 42.7% Never married42.3% Now married0.6% Separated4.5% Widowed10.0% DivorcedWomen who gave birth in the past 12 months Now married:
50.5% (46)Unmarried:
49.5% (45)
Women who did not give birth in the past 12 months Now married:
38.5% (556)Unmarried:
61.5% (888)
Marital status - Black or African American population 15 years and over
Males 53.5% Never married23.6% Now married1.5% Separated4.1% Widowed17.2% DivorcedFemales 54.9% Never married18.9% Now married2.9% Separated8.8% Widowed14.4% DivorcedWomen who gave birth in the past 12 months Now married:
31.4% (148)Unmarried:
68.6% (323)
Women who did not give birth in the past 12 months Now married:
17.4% (1,340)Unmarried:
82.6% (6,352)
Marital status - American Indian / Alaska Native population 15 years and over
Males 41.9% Never married22.6% Now married0.0% Separated9.7% Widowed25.8% DivorcedFemales 31.2% Never married68.8% Now married0.0% Separated0.0% Widowed0.0% DivorcedWomen who did not give birth in the past 12 months Now married:
68.8% (17)Unmarried:
31.2% (8)
Marital status - Asian population 15 years and over
Males 56.2% Never married43.8% Now married0.0% Separated0.0% Widowed0.0% DivorcedFemales 44.1% Never married53.4% Now married0.0% Separated0.0% Widowed2.5% DivorcedWomen who did not give birth in the past 12 months Now married:
39.9% (73)Unmarried:
60.1% (110)
Marital status - Other race population 15 years and over
Males 56.9% Never married41.4% Now married0.0% Separated1.7% Widowed0.0% DivorcedFemales 33.6% Never married56.5% Now married3.0% Separated6.8% Widowed0.0% DivorcedWomen who gave birth in the past 12 months Now married:
100.0% (13)Unmarried:
0.0% (0)
Women who did not give birth in the past 12 months Now married:
51.2% (220)Unmarried:
48.8% (209)
Marital status - Two or more races population 15 years and over
Males 67.6% Never married27.5% Now married0.0% Separated0.0% Widowed4.9% DivorcedFemales 71.9% Never married21.3% Now married0.0% Separated0.0% Widowed6.8% DivorcedWomen who gave birth in the past 12 months Now married:
27.9% (18)Unmarried:
72.1% (46)
Women who did not give birth in the past 12 months Now married:
16.9% (123)Unmarried:
83.1% (603)
Marital status - White alone, not Hispanic / Latino population 15 years and over
Males 52.1% Never married30.8% Now married1.8% Separated2.8% Widowed12.5% DivorcedFemales 41.9% Never married41.1% Now married0.7% Separated5.4% Widowed10.9% DivorcedWomen who gave birth in the past 12 months Now married:
100.0% (48)Unmarried:
0.0% (0)
Women who did not give birth in the past 12 months Now married:
34.1% (414)Unmarried:
65.9% (798)
Marital status - Hispanic or Latino population 15 years and over
Males 49.2% Never married49.0% Now married0.0% Separated0.0% Widowed1.7% DivorcedFemales 51.7% Never married43.5% Now married1.2% Separated0.0% Widowed3.6% DivorcedWomen who gave birth in the past 12 months Now married:
30.0% (22)Unmarried:
70.0% (52)
Women who did not give birth in the past 12 months Now married:
38.9% (364)Unmarried:
61.1% (571)
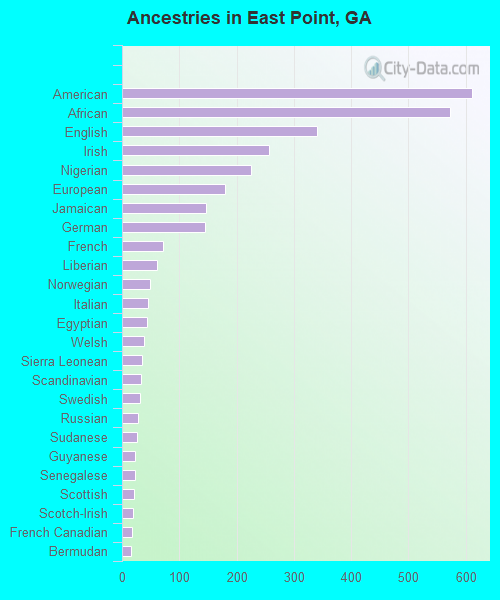
Ancestries in East Point
610 2.2% American572 2.1% African341 1.2% English257 0.9% Irish225 0.8% Nigerian179 0.7% European146 0.5% Jamaican145 0.5% German71 0.3% French61 0.2% Liberian49 0.2% Norwegian45 0.2% Italian43 0.2% Egyptian39 0.1% Welsh35 0.1% Sierra Leonean33 0.1% Scandinavian32 0.1% Swedish28 0.1% Russian27 0.10% Sudanese23 0.08% Guyanese22 0.08% Senegalese21 0.08% Scottish19 0.07% Scotch-Irish18 0.07% French Canadian16 0.06% Bermudan15 0.05% Bahamian12 0.04% Croatian12 0.04% Dutch11 0.04% Australian11 0.04% Belizean8 0.03% British2 0.01% Canadian
Geographical mobility in East Point Same house 1 year ago 4,656 88.4% White (Caucasian)23,343 81.0% Black or African American35 73.2% American Indian / Alaska Native479 83.1% Asian1,895 89.3% Other race1,562 91.2% Two or more races3,861 85.9% White alone, not Hispanic / Latino3,032 91.4% Hispanic or LatinoMoved within same county 221 4.2% White / Caucasian2,430 8.4% Black or African American102 6.0% Two or more races233 5.2% White alone, not Hispanic / Latino179 5.4% Hispanic or LatinoMoved within same state 169 3.2% White / Caucasian1,249 4.3% Black or African American3 0.6% Asian130 6.1% Other race43 2.5% Two or more races171 3.8% White alone, not Hispanic / Latino97 2.9% Hispanic or LatinoMoved from different state 188 3.6% White / Caucasian1,320 4.6% Black or African American12 24.3% American Indian / Alaska Native51 8.8% Asian79 3.7% Other race186 4.1% White alone, not Hispanic / Latino8 0.2% Hispanic or LatinoMoved from abroad 28 0.5% White214 0.7% Black or African American67 11.7% Asian36 0.8% White alone, not Hispanic / Latino
Children Nativity (place of birth) in East Point
Children under 6 years - Living with two parents Both parents native 744 100.0% NativeBoth parents foreign-born 97 100.0% NativeOne native, one foreign-born parent 295 100.0% NativeChildren under 6 years - Living with one parent Native parent 1,728 100.0% NativeForeign-born parent 73 100.0% NativeChildren 6 to 17 years - Living with two parents Both parents native 798 98.4% Native13 1.6% Foreign-bornBoth parents foreign-born 230 100.0% NativeOne native, one foreign-born parent 241 85.9% Native40 14.1% Foreign-bornChildren 6 to 17 years - Living with one parent Native parent 4,026 100.0% NativeForeign-born parent 320 57.8% Native234 42.2% Foreign-born
Grandparents responsible for own grandchildren in East Point
Grandparents (30 to 59 years) White / Caucasian 8 19.9% Responsible for grandchildren34 80.1% Not responsible for grandchildrenBlack or African American 73 30.0% Responsible for grandchildren171 70.0% Not responsible for grandchildrenOther race 9 14.6% Responsible for grandchildren53 85.4% Not responsible for grandchildrenTwo or more races 47 100.0% Not responsible for grandchildrenWhite alone, not Hispanic / Latino 9 32.1% Responsible for grandchildren18 67.9% Not responsible for grandchildrenHispanic or Latino 9 11.1% Responsible for grandchildren70 88.9% Not responsible for grandchildrenGrandparents (60 years and over) White / Caucasian 12 100.0% Not responsible for grandchildrenBlack or African American 171 37.5% Responsible for grandchildren285 62.5% Not responsible for grandchildrenTwo or more races 28 87.0% Responsible for grandchildren4 13.0% Not responsible for grandchildrenWhite alone, not Hispanic / Latino 13 100.0% Not responsible for grandchildren