Races in East Patchogue, New York (NY) Detailed Stats
Data:
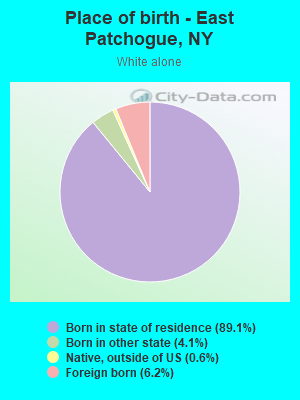
Races - White alone (%)
Races - White alone (% change since 2000)
Races - Black alone (%)
Races - Black alone (% change since 2000)
Races - American Indian alone (%)
Races - American Indian alone (% change since 2000)
Races - Asian alone (%)
Races - Asian alone (% change since 2000)
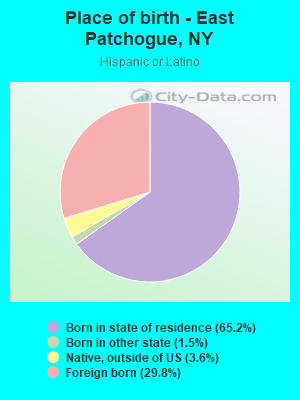
Races - Hispanic (%)
Races - Hispanic (% change since 2000)
Races - Native Hawaiian and Other Pacific Islander alone (%)
Races - Native Hawaiian and Other Pacific Islander alone (% change since 2000)
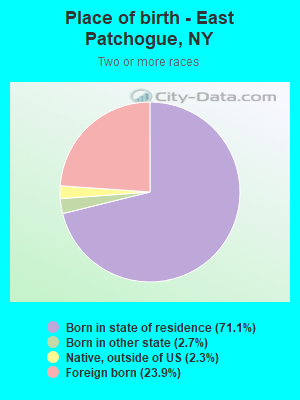
Races - Two or more races(%)
Races - Two or more races(% change since 2000)
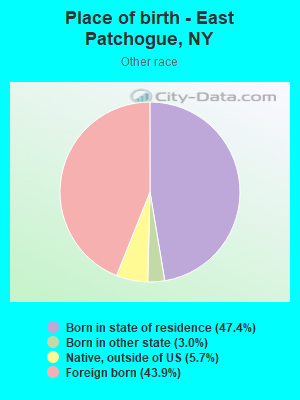
Races - Other race alone (%)
Races - Other race alone (% change since 2000)
Racial diversity
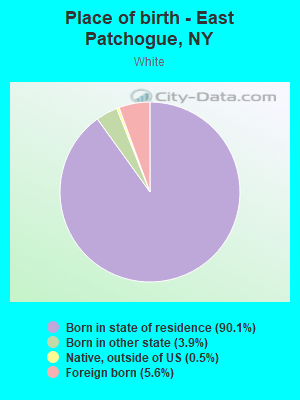
Place of birth - Born in state of residence (%)
Place of birth - Born in state of residence (%) - White
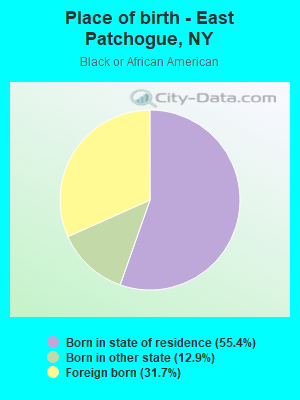
Place of birth - Born in state of residence (%) - Black or African American
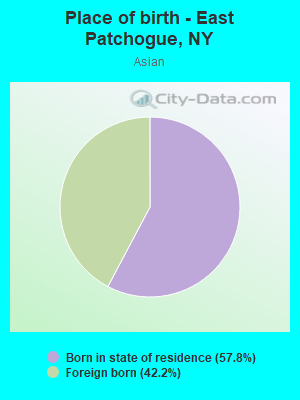
Place of birth - Born in state of residence (%) - Asian
Place of birth - Born in state of residence (%) - Hispanic or Latino
Place of birth - Born in state of residence (%) - American Indian and Alaska Native
Place of birth - Born in state of residence (%) - Multirace
Place of birth - Born in state of residence (%) - Other Race
Place of birth - Born in other state (%)
Place of birth - Born in other state (%) - White
Place of birth - Born in other state (%) - Black or African American
Place of birth - Born in other state (%) - Asian
Place of birth - Born in other state (%) - Hispanic or Latino
Place of birth - Born in other state (%) - American Indian and Alaska Native
Place of birth - Born in other state (%) - Multirace
Place of birth - Born in other state (%) - Other Race
Place of birth - Native, outside of US (%)
Place of birth - Native, outside of US (%) - White
Place of birth - Native, outside of US (%) - Black or African American
Place of birth - Native, outside of US (%) - Asian
Place of birth - Native, outside of US (%) - Hispanic or Latino
Place of birth - Native, outside of US (%) - American Indian and Alaska Native
Place of birth - Native, outside of US (%) - Multirace
Place of birth - Native, outside of US (%) - Other Race
Place of birth - Foreign born (%)
Place of birth - Foreign born (%) - White
Place of birth - Foreign born (%) - Black or African American
Place of birth - Foreign born (%) - Asian
Place of birth - Foreign born (%) - Hispanic or Latino
Place of birth - Foreign born (%) - American Indian and Alaska Native
Place of birth - Foreign born (%) - Multirace
Place of birth - Foreign born (%) - Other Race
Residents speaking English at home (%)
Residents speaking English at home - Born in the United States (%)
Residents speaking English at home - Native, born elsewhere (%)
Residents speaking English at home - Foreign born (%)
Residents speaking Spanish at home (%)
Residents speaking Spanish at home - Born in the United States (%)
Residents speaking Spanish at home - Native, born elsewhere (%)
Residents speaking Spanish at home - Foreign born (%)
Residents speaking other language at home (%)
Residents speaking other language at home - Born in the United States (%)
Residents speaking other language at home - Native, born elsewhere (%)
Residents speaking other language at home - Foreign born (%)
Marital status - Never married (%)
Marital status - Now married (%)
Marital status - Separated (%)
Marital status - Widowed (%)
Marital status - Divorced (%)
Ancestries Reported - Arab (%)
Ancestries Reported - Czech (%)
Ancestries Reported - Danish (%)
Ancestries Reported - Dutch (%)
Ancestries Reported - English (%)
Ancestries Reported - French (%)
Ancestries Reported - French Canadian (%)
Ancestries Reported - German (%)
Ancestries Reported - Greek (%)
Ancestries Reported - Hungarian (%)
Ancestries Reported - Irish (%)
Ancestries Reported - Italian (%)
Ancestries Reported - Lithuanian (%)
Ancestries Reported - Norwegian (%)
Ancestries Reported - Polish (%)
Ancestries Reported - Portuguese (%)
Ancestries Reported - Russian (%)
Ancestries Reported - Scotch-Irish (%)
Ancestries Reported - Scottish (%)
Ancestries Reported - Slovak (%)
Ancestries Reported - Subsaharan African (%)
Ancestries Reported - Swedish (%)
Ancestries Reported - Swiss (%)
Ancestries Reported - Ukrainian (%)
Ancestries Reported - United States (%)
Ancestries Reported - Welsh (%)
Ancestries Reported - West Indian (%)
Ancestries Reported - Other (%)
Geographical mobility - Same house 1 year ago (%)
Geographical mobility - Same house 1 year ago (%) - White
Geographical mobility - Same house 1 year ago (%) - Black or African American
Geographical mobility - Same house 1 year ago (%) - Asian
Geographical mobility - Same house 1 year ago (%) - Hispanic or Latino
Geographical mobility - Same house 1 year ago (%) - American Indian and Alaska Native
Geographical mobility - Same house 1 year ago (%) - Multirace
Geographical mobility - Same house 1 year ago (%) - Other Race
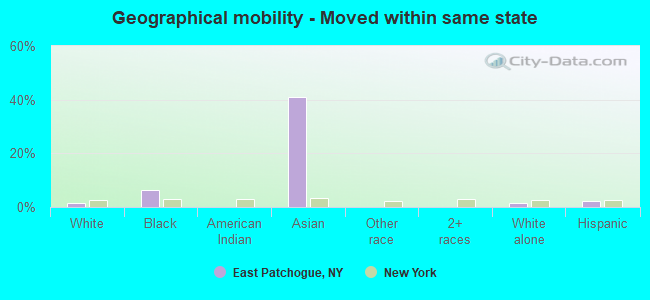
Geographical mobility - Moved within same county (%)
Geographical mobility - Moved within same county (%) - White
Geographical mobility - Moved within same county (%) - Black or African American
Geographical mobility - Moved within same county (%) - Asian
Geographical mobility - Moved within same county (%) - Hispanic or Latino
Geographical mobility - Moved within same county (%) - American Indian and Alaska Native
Geographical mobility - Moved within same county (%) - Multirace
Geographical mobility - Moved within same county (%) - Other Race
Geographical mobility - Moved from different county within same state (%)
Geographical mobility - Moved from different county within same state (%) - White
Geographical mobility - Moved from different county within same state (%) - Black or African American
Geographical mobility - Moved from different county within same state (%) - Asian
Geographical mobility - Moved from different county within same state (%) - Hispanic or Latino
Geographical mobility - Moved from different county within same state (%) - American Indian and Alaska Native
Geographical mobility - Moved from different county within same state (%) - Multirace
Geographical mobility - Moved from different county within same state (%) - Other Race
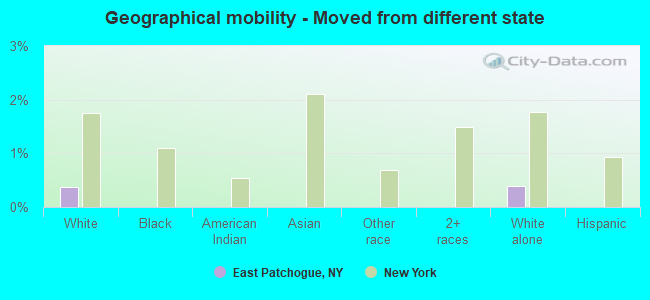
Geographical mobility - Moved from different state (%)
Geographical mobility - Moved from different state (%) - White
Geographical mobility - Moved from different state (%) - Black or African American
Geographical mobility - Moved from different state (%) - Asian
Geographical mobility - Moved from different state (%) - Hispanic or Latino
Geographical mobility - Moved from different state (%) - American Indian and Alaska Native
Geographical mobility - Moved from different state (%) - Multirace
Geographical mobility - Moved from different state (%) - Other Race
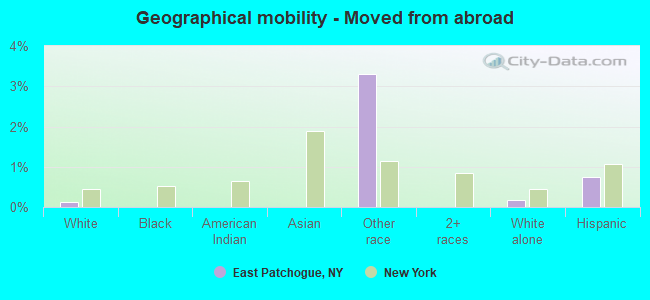
Geographical mobility - Moved from abroad (%)
Geographical mobility - Moved from abroad (%) - White
Geographical mobility - Moved from abroad (%) - Black or African American
Geographical mobility - Moved from abroad (%) - Asian
Geographical mobility - Moved from abroad (%) - Hispanic or Latino
Geographical mobility - Moved from abroad (%) - American Indian and Alaska Native
Geographical mobility - Moved from abroad (%) - Multirace
Geographical mobility - Moved from abroad (%) - Other Race
Place of birth for the foreign-born population - Ireland (%)
Place of birth for the foreign-born population - Denmark (%)
Place of birth for the foreign-born population - Norway (%)
Place of birth for the foreign-born population - Sweden (%)
Place of birth for the foreign-born population - United Kingdom (%)
Place of birth for the foreign-born population - England (%)
Place of birth for the foreign-born population - Scotland (%)
Place of birth for the foreign-born population - Other Northern Europe (%)
Place of birth for the foreign-born population - Austria (%)
Place of birth for the foreign-born population - Belgium (%)
Place of birth for the foreign-born population - France (%)
Place of birth for the foreign-born population - Germany (%)
Place of birth for the foreign-born population - Netherlands (%)
Place of birth for the foreign-born population - Switzerland (%)
Place of birth for the foreign-born population - Other Western Europe (%)
Place of birth for the foreign-born population - Greece (%)
Place of birth for the foreign-born population - Italy (%)
Place of birth for the foreign-born population - Portugal (%)
Place of birth for the foreign-born population - Spain (%)
Place of birth for the foreign-born population - Other Southern Europe (%)
Place of birth for the foreign-born population - Albania (%)
Place of birth for the foreign-born population - Belarus (%)
Place of birth for the foreign-born population - Bosnia and Herzegovina (%)
Place of birth for the foreign-born population - Bulgaria (%)
Place of birth for the foreign-born population - Croatia (%)
Place of birth for the foreign-born population - Czechoslovakia (%)
Place of birth for the foreign-born population - Hungary (%)
Place of birth for the foreign-born population - Latvia (%)
Place of birth for the foreign-born population - Lithuania (%)
Place of birth for the foreign-born population - North Macedonia (Macedonia) (%)
Place of birth for the foreign-born population - Moldova (%)
Place of birth for the foreign-born population - Poland (%)
Place of birth for the foreign-born population - Romania (%)
Place of birth for the foreign-born population - Russia (%)
Place of birth for the foreign-born population - Serbia (%)
Place of birth for the foreign-born population - Ukraine (%)
Place of birth for the foreign-born population - Other Eastern Europe (%)
Place of birth for the foreign-born population - China (%)
Place of birth for the foreign-born population - Hong Kong (%)
Place of birth for the foreign-born population - Taiwan (%)
Place of birth for the foreign-born population - Japan (%)
Place of birth for the foreign-born population - Korea (%)
Place of birth for the foreign-born population - Other Eastern Asia (%)
Place of birth for the foreign-born population - Afghanistan (%)
Place of birth for the foreign-born population - Bangladesh (%)
Place of birth for the foreign-born population - India (%)
Place of birth for the foreign-born population - Iran (%)
Place of birth for the foreign-born population - Kazakhstan (%)
Place of birth for the foreign-born population - Nepal (%)
Place of birth for the foreign-born population - Pakistan (%)
Place of birth for the foreign-born population - Sri Lanka (%)
Place of birth for the foreign-born population - Uzbekistan (%)
Place of birth for the foreign-born population - Other South Central Asia (%)
Place of birth for the foreign-born population - Burma (%)
Place of birth for the foreign-born population - Cambodia (%)
Place of birth for the foreign-born population - Indonesia (%)
Place of birth for the foreign-born population - Laos (%)
Place of birth for the foreign-born population - Malaysia (%)
Place of birth for the foreign-born population - Philippines (%)
Place of birth for the foreign-born population - Singapore (%)
Place of birth for the foreign-born population - Thailand (%)
Place of birth for the foreign-born population - Vietnam (%)
Place of birth for the foreign-born population - Other South Eastern Asia (%)
Place of birth for the foreign-born population - Armenia (%)
Place of birth for the foreign-born population - Iraq (%)
Place of birth for the foreign-born population - Israel (%)
Place of birth for the foreign-born population - Jordan (%)
Place of birth for the foreign-born population - Kuwait (%)
Place of birth for the foreign-born population - Lebanon (%)
Place of birth for the foreign-born population - Saudi Arabia (%)
Place of birth for the foreign-born population - Syria (%)
Place of birth for the foreign-born population - Turkey (%)
Place of birth for the foreign-born population - Yemen (%)
Place of birth for the foreign-born population - Other Western Asia (%)
Place of birth for the foreign-born population - Eritrea (%)
Place of birth for the foreign-born population - Ethiopia (%)
Place of birth for the foreign-born population - Kenya (%)
Place of birth for the foreign-born population - Somalia (%)
Place of birth for the foreign-born population - Uganda (%)
Place of birth for the foreign-born population - Zimbabwe (%)
Place of birth for the foreign-born population - Other Eastern Africa (%)
Place of birth for the foreign-born population - Cameroon (%)
Place of birth for the foreign-born population - Congo (%)
Place of birth for the foreign-born population - Democratic Republic of Congo (Zaire) (%)
Place of birth for the foreign-born population - Other Middle Africa (%)
Place of birth for the foreign-born population - Egypt (%)
Place of birth for the foreign-born population - Morocco (%)
Place of birth for the foreign-born population - Sudan (%)
Place of birth for the foreign-born population - Other Northern Africa (%)
Place of birth for the foreign-born population - South Africa (%)
Place of birth for the foreign-born population - Other Southern Africa (%)
Place of birth for the foreign-born population - Cabo Verde (%)
Place of birth for the foreign-born population - Ghana (%)
Place of birth for the foreign-born population - Liberia (%)
Place of birth for the foreign-born population - Nigeria (%)
Place of birth for the foreign-born population - Senegal (%)
Place of birth for the foreign-born population - Sierra Leone (%)
Place of birth for the foreign-born population - Other Western Africa (%)
Place of birth for the foreign-born population - Australia (%)
Place of birth for the foreign-born population - New Zealand (%)
Place of birth for the foreign-born population - Fiji (%)
Place of birth for the foreign-born population - Micronesia (%)
Place of birth for the foreign-born population - Bahamas (%)
Place of birth for the foreign-born population - Barbados (%)
Place of birth for the foreign-born population - Cuba (%)
Place of birth for the foreign-born population - Dominica (%)
Place of birth for the foreign-born population - Dominican Republic (%)
Place of birth for the foreign-born population - Grenada (%)
Place of birth for the foreign-born population - Haiti (%)
Place of birth for the foreign-born population - Jamaica (%)
Place of birth for the foreign-born population - St. Vincent and the Grenadines (%)
Place of birth for the foreign-born population - Trinidad and Tobago (%)
Place of birth for the foreign-born population - West Indies (%)
Place of birth for the foreign-born population - Other Caribbean (%)
Place of birth for the foreign-born population - Belize (%)
Place of birth for the foreign-born population - Costa Rica (%)
Place of birth for the foreign-born population - El Salvador (%)
Place of birth for the foreign-born population - Guatemala (%)
Place of birth for the foreign-born population - Honduras (%)
Place of birth for the foreign-born population - Mexico (%)
Place of birth for the foreign-born population - Nicaragua (%)
Place of birth for the foreign-born population - Panama (%)
Place of birth for the foreign-born population - Other Central America (%)
Place of birth for the foreign-born population - Argentina (%)
Place of birth for the foreign-born population - Bolivia (%)
Place of birth for the foreign-born population - Brazil (%)
Place of birth for the foreign-born population - Chile (%)
Place of birth for the foreign-born population - Colombia (%)
Place of birth for the foreign-born population - Ecuador (%)
Place of birth for the foreign-born population - Guyana (%)
Place of birth for the foreign-born population - Peru (%)
Place of birth for the foreign-born population - Uruguay (%)
Place of birth for the foreign-born population - Venezuela (%)
Place of birth for the foreign-born population - Other South America (%)
Place of birth for the foreign-born population - Canada (%)
Place of birth for the foreign-born population - Other Northern America (%)
Place of birth for the foreign-born population - Other (%)
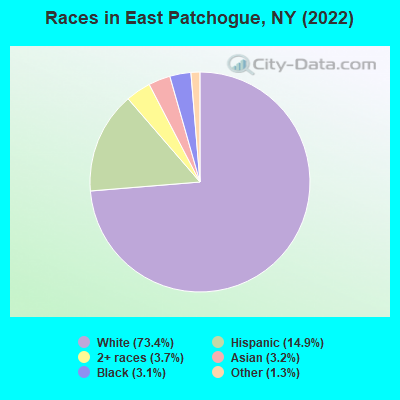
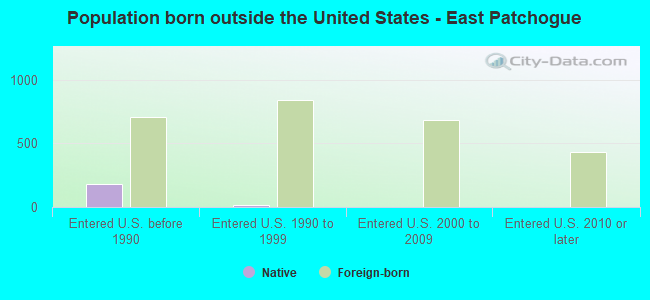
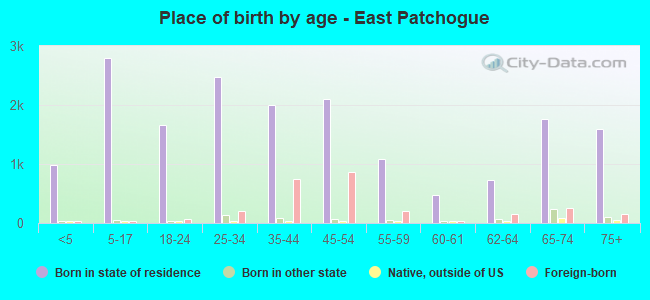
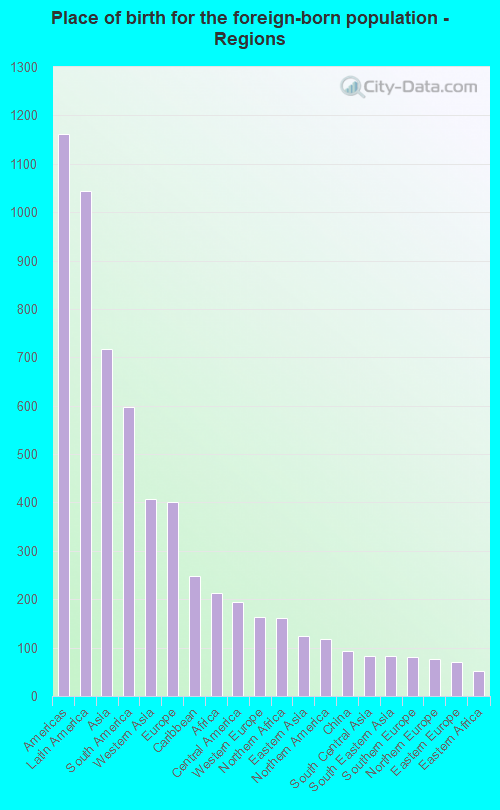
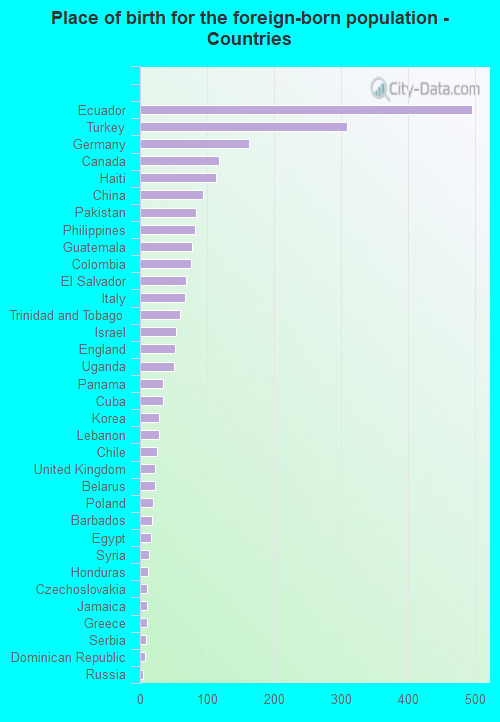
According to 2022 data, the most numerous races in East Patchogue, NY are White alone (15,745 residents), Hispanic (3,197 residents), and Black alone (662 residents). 81.4% of East Patchogue residents speak English at home. 11.6% of East Patchogue, NY residents are foreign-born (4.9% born in Latin America, 3.4% born in Asia, 1.9% born in Europe), which is 89.3% less than the foreign-born rate of 22.0% across the entire state of New York.
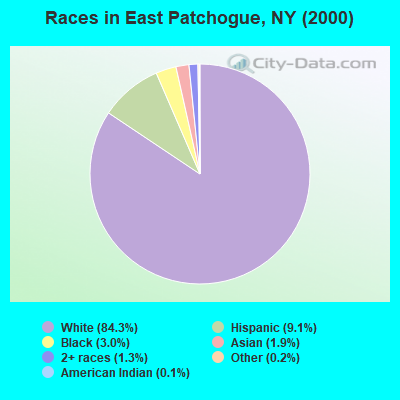
Race distribution in East Patchogue
2000 2022
11,760,981 62.0% White alone 2,867,583 15.1% Hispanic 2,812,623 14.8% Black alone 1,035,926 5.5% Asian alone 366,116 1.9% Two or more races 75,499 0.4% Other race alone 52,499 0.3% American Indian alone 5,230 0.03% Native Hawaiian and Other
10,408,933 52.9% White alone 3,867,299 19.7% Hispanic 2,633,840 13.4% Black alone 1,776,286 9.0% Asian alone 732,670 3.7% Two or more races 216,110 1.1% Other race alone 35,082 0.2% American Indian alone 6,931 0.04% Native Hawaiian and Other
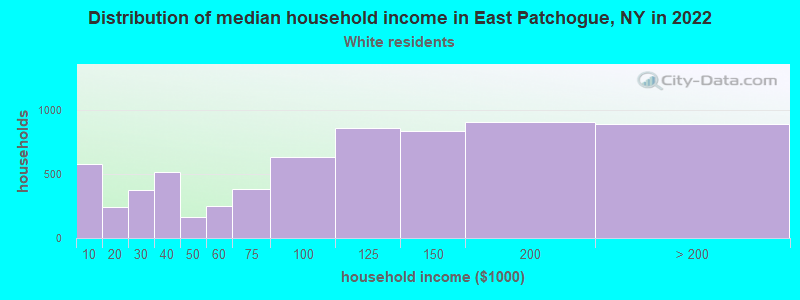
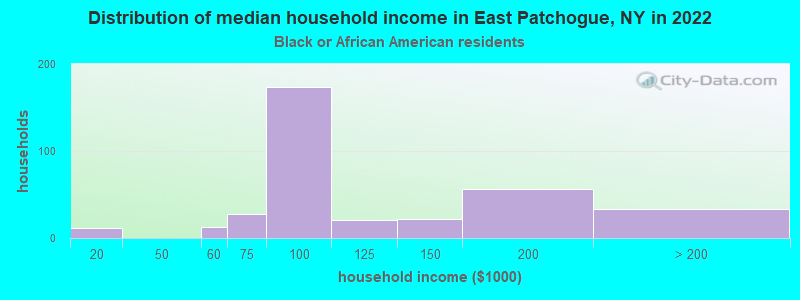
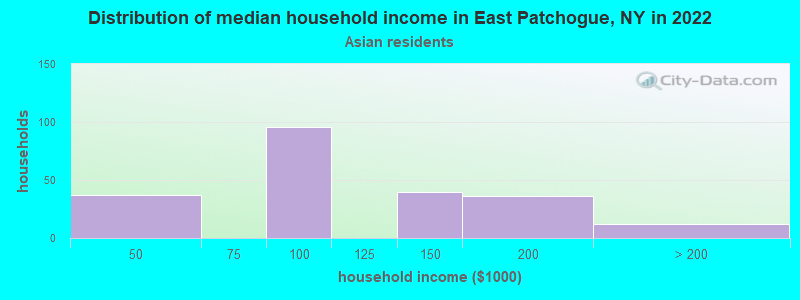
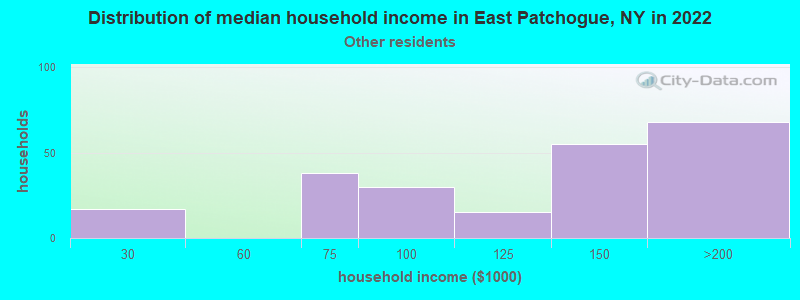
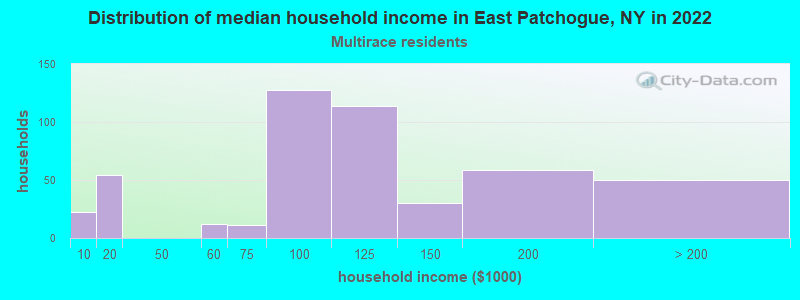
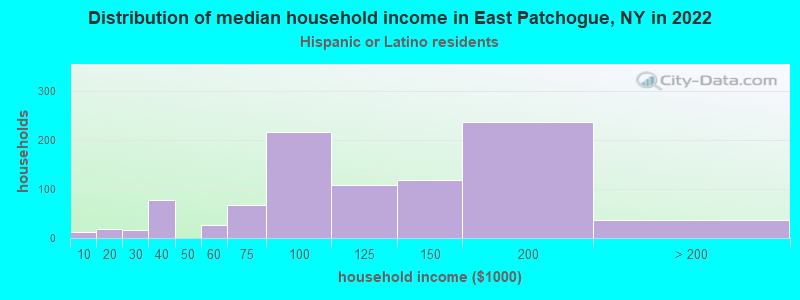
Income and house value in East Patchogue Median household income in 2022 $104,060 White non-Hispanic householders$92,414 Black householders$87,076 Asian householders$130,931 Some other race householders$102,824 Two or more races householders$102,189 Hispanic or Latino race householdersMedian 2022 house value $483,585 White Non-Hispanic householders$444,762 Black or African American householders $482,032 Asian householders$469,919 Some other race householders$480,479 Two or more races householders$418,983 Hispanic or Latino householders
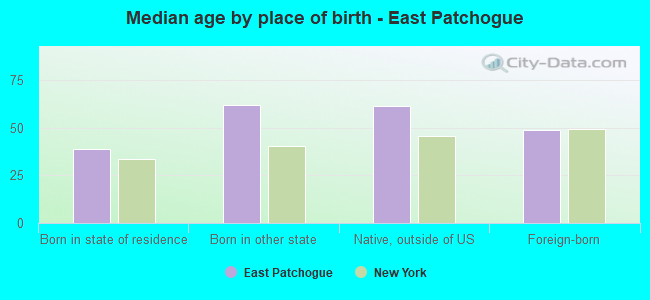
Median age by race in East Patchogue
46.3 Median age for White residents45.5 46.5 38.7 Median age for Black or African American residents33.7 41.8 -748,832,865.7 Median age for American Indian / Alaska Native residents-807,017,543.1 -513,692,161.9 37.6 Median age for Asian residents48.2 30.0 -742,816,091.2 Median age for Native Hawaiian / Pacific Islander residents-831,187,409.8 -771,300,447.7 39.9 Median age for Other race residents26.0 45.5 28.6 Median age for Two or more races residents27.4 33.4 45.5 Median age for White alone residents46.0 45.5 38.7 Median age for Hispanic or Latino residents32.0 40.9
Owner/renter occupied households by race in East Patchogue
House owners and renters - White residents 5,052 76.9% Owner occupied1,518 23.1% Renter occupiedHouse owners and renters - Black or African American residents 117 33.2% Owner occupied236 66.8% Renter occupiedHouse owners and renters - Asian residents 172 75.9% Owner occupied55 24.1% Renter occupiedHouse owners and renters - Other race residents 155 67.0% Owner occupied76 33.0% Renter occupiedHouse owners and renters - Two or more races residents 322 78.8% Owner occupied87 21.2% Renter occupiedHouse owners and renters - White alone residents 4,761 75.1% Owner occupied1,578 24.9% Renter occupiedHouse owners and renters - Hispanic or Latino residents 703 79.1% Owner occupied186 20.9% Renter occupied
Language usage in East Patchogue
English speakers - Total 81.4% of residents of East Patchogue speak English at home.
9.0% of residents speak Spanish at home 838 45.4% Speak English very well1,009 54.6% Speak English less than very well9.2% of residents speak other language at home 1,297 68.6% Speak English very well594 31.4% Speak English less than very well
English speakers - Born in the United States 99.3% of residents of East Patchogue speak English at home.
1.7% of residents speak other language at home 6 42.9% Speak English very well8 57.1% Speak English less than very well
English speakers - Native, born elsewhere 50.2% of residents of East Patchogue speak English at home.
40.5% of residents speak Spanish at home 38 45.8% Speak English very well45 54.2% Speak English less than very well9.3% of residents speak other language at home 19 100.0% Speak English very well
English speakers - Foreign-born 20.3% of residents of East Patchogue speak English at home.
36.8% of residents speak Spanish at home 275 28.0% Speak English very well707 72.0% Speak English less than very well42.3% of residents speak other language at home 587 52.0% Speak English very well541 48.0% Speak English less than very well
White (Caucasian) - Speak only English Native:
96.2% (14,254)Foreign-born:
23.3% (210)
White (Caucasian) - Speak another language Native:
4.2% (617)Foreign-born:
74.8% (675)
Black or African American - Speak only English Native:
92.8% (485)Foreign-born:
57.3% (160)
Black or African American - Speak another language Native:
5.7% (30)Foreign-born:
43.2% (121)
Asian - Speak only English Native:
73.8% (227)Foreign-born:
16.7% (48)
Asian - Speak another language Native:
21.0% (65)Foreign-born:
79.8% (232)
Other race - Speak another language Native:
71.5% (502)Foreign-born:
100.0% (539)
Two or more races - Speak only English Native:
77.9% (770)Foreign-born:
32.9% (124)
Two or more races - Speak another language Native:
22.6% (223)Foreign-born:
64.3% (242)
White alone - Speak only English Native:
94.8% (13,603)Foreign-born:
22.2% (216)
White alone - Speak another language Native:
5.3% (756)Foreign-born:
77.8% (758)
Hispanic or Latino - Speak only English Native:
72.1% (1,400)Foreign-born:
8.6% (79)
Hispanic or Latino - Speak another language Native:
29.3% (570)Foreign-born:
91.2% (842)
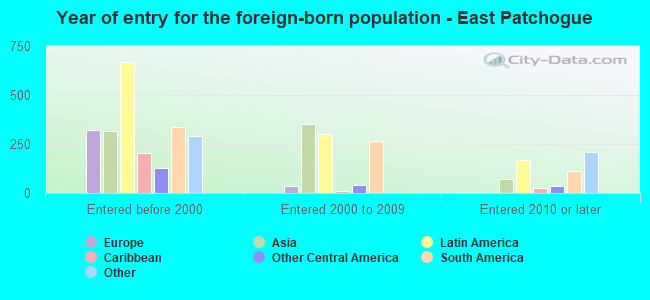
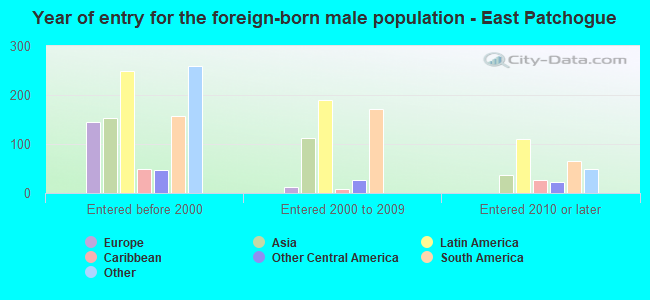
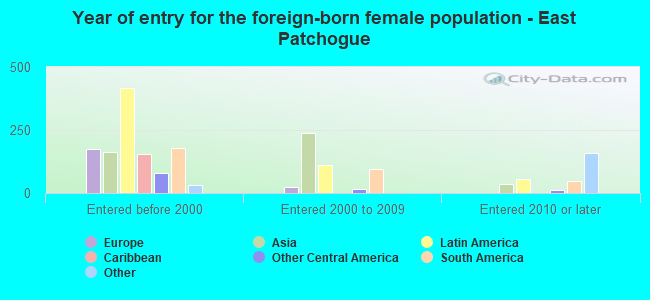
Foreign-born residents in East Patchogue 2,494 residents are foreign born (4.9% Latin America , 3.4% Asia , 1.9% Europe ).
This city:
11.6%New York:
22.6%
Marital status for residents in East Patchogue Marital status - White (Caucasian) population 15 years and over
Males 34.8% Never married49.1% Now married1.2% Separated5.0% Widowed9.9% DivorcedFemales 32.8% Never married38.5% Now married0.9% Separated13.0% Widowed14.8% DivorcedWomen who gave birth in the past 12 months Now married:
100.0% (112)Unmarried:
0.0% (0)
Women who did not give birth in the past 12 months Now married:
34.8% (1,304)Unmarried:
65.2% (2,437)
Marital status - Black or African American population 15 years and over
Males 56.1% Never married38.6% Now married3.0% Separated0.6% Widowed1.8% DivorcedFemales 52.8% Never married33.2% Now married0.0% Separated4.4% Widowed9.6% DivorcedWomen who gave birth in the past 12 months Now married:
100.0% (12)Unmarried:
0.0% (0)
Women who did not give birth in the past 12 months Now married:
27.5% (65)Unmarried:
72.5% (170)
Marital status - Asian population 15 years and over
Males 17.0% Never married74.4% Now married0.0% Separated0.0% Widowed8.5% DivorcedFemales 42.7% Never married53.3% Now married2.0% Separated0.0% Widowed2.0% DivorcedWomen who did not give birth in the past 12 months Now married:
42.7% (89)Unmarried:
57.3% (119)
Marital status - Other race population 15 years and over
Males 53.7% Never married46.3% Now married0.0% Separated0.0% Widowed0.0% DivorcedFemales 10.7% Never married63.9% Now married0.0% Separated3.2% Widowed22.3% DivorcedWomen who did not give birth in the past 12 months Now married:
75.0% (162)Unmarried:
25.0% (54)
Marital status - Two or more races population 15 years and over
Males 66.8% Never married31.6% Now married0.0% Separated0.0% Widowed1.6% DivorcedFemales 43.2% Never married27.8% Now married11.8% Separated15.7% Widowed1.5% DivorcedWomen who gave birth in the past 12 months Now married:
100.0% (38)Unmarried:
0.0% (0)
Women who did not give birth in the past 12 months Now married:
31.1% (95)Unmarried:
68.9% (211)
Marital status - White alone, not Hispanic / Latino population 15 years and over
Males 33.6% Never married48.9% Now married1.4% Separated5.4% Widowed10.8% DivorcedFemales 32.9% Never married38.0% Now married0.9% Separated13.4% Widowed14.8% DivorcedWomen who gave birth in the past 12 months Now married:
100.0% (121)Unmarried:
0.0% (0)
Women who did not give birth in the past 12 months Now married:
34.5% (1,316)Unmarried:
65.5% (2,499)
Marital status - Hispanic or Latino population 15 years and over
Males 50.3% Never married46.9% Now married0.0% Separated0.9% Widowed1.9% DivorcedFemales 28.0% Never married49.0% Now married0.0% Separated5.6% Widowed17.4% DivorcedWomen who gave birth in the past 12 months Now married:
100.0% (27)Unmarried:
0.0% (0)
Women who did not give birth in the past 12 months Now married:
46.4% (278)Unmarried:
53.6% (321)
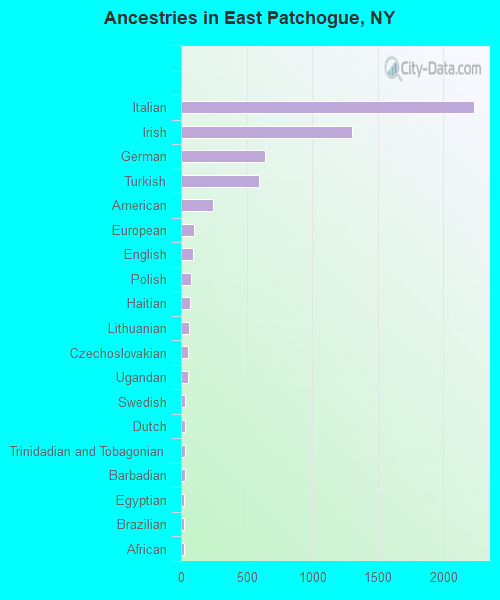
Ancestries in East Patchogue
2,238 24.5% Italian1,303 14.3% Irish639 7.0% German598 6.5% Turkish247 2.7% American101 1.1% European90 1.0% English77 0.8% Polish69 0.8% Haitian59 0.6% Lithuanian52 0.6% Czechoslovakian52 0.6% Ugandan31 0.3% Swedish29 0.3% Dutch29 0.3% Trinidadian and Tobagonian28 0.3% Barbadian26 0.3% Egyptian26 0.3% Brazilian24 0.3% African20 0.2% German Russian17 0.2% Cypriot17 0.2% Jamaican15 0.2% Scotch-Irish14 0.2% Greek13 0.1% French Canadian11 0.1% French11 0.1% Russian8 0.09% Czech8 0.09% Ukrainian6 0.07% West Indian6 0.07% Yugoslavian
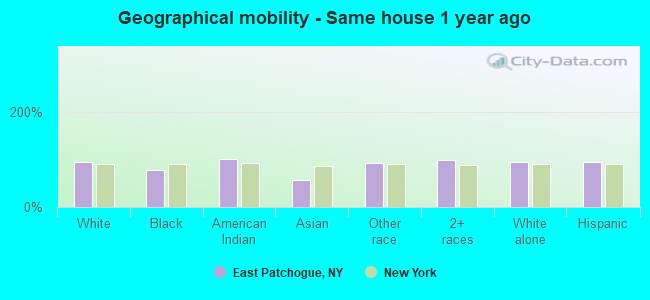
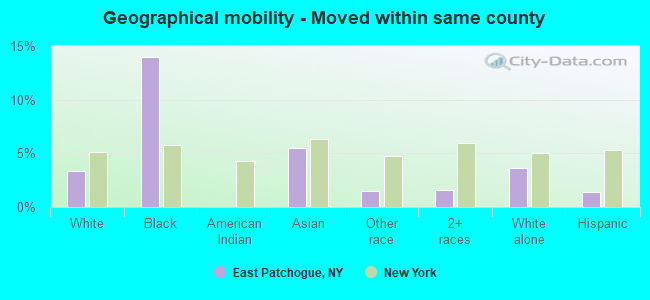
Geographical mobility in East Patchogue Same house 1 year ago 15,262 94.7% White (Caucasian)672 78.1% Black or African American7 100.0% American Indian / Alaska Native385 55.6% Asian1,193 93.5% Other race1,592 99.4% Two or more races14,801 94.3% White alone, not Hispanic / Latino2,985 95.4% Hispanic or LatinoMoved within same county 537 3.3% White / Caucasian120 14.0% Black or African American38 5.5% Asian19 1.5% Other race25 1.6% Two or more races563 3.6% White alone, not Hispanic / Latino45 1.4% Hispanic or LatinoMoved within same state 247 1.5% White / Caucasian56 6.5% Black or African American284 41.0% Asian244 1.6% White alone, not Hispanic / Latino68 2.2% Hispanic or LatinoMoved from different state 59 0.4% White / Caucasian62 0.4% White alone, not Hispanic / LatinoMoved from abroad 21 0.1% White42 3.3% Other race29 0.2% White alone, not Hispanic / Latino23 0.7% Hispanic or Latino
Children Nativity (place of birth) in East Patchogue
Children under 6 years - Living with two parents Both parents native 576 100.0% NativeBoth parents foreign-born 177 100.0% NativeOne native, one foreign-born parent 167 100.0% NativeChildren under 6 years - Living with one parent Native parent 146 98.5% Native2 1.5% Foreign-bornForeign-born parent 90 82.7% Native19 17.3% Foreign-bornChildren 6 to 17 years - Living with two parents Both parents native 1,187 100.0% NativeBoth parents foreign-born 446 100.0% NativeOne native, one foreign-born parent 91 100.0% NativeChildren 6 to 17 years - Living with one parent Native parent 504 100.0% NativeForeign-born parent 270 54.1% Native229 45.9% Foreign-born
Grandparents responsible for own grandchildren in East Patchogue
Grandparents (30 to 59 years) White / Caucasian 45 35.7% Responsible for grandchildren81 64.3% Not responsible for grandchildrenOther race 26 100.0% Not responsible for grandchildrenWhite alone, not Hispanic / Latino 92 100.0% Not responsible for grandchildrenHispanic or Latino 52 65.7% Responsible for grandchildren27 34.3% Not responsible for grandchildrenGrandparents (60 years and over) White / Caucasian 143 50.8% Responsible for grandchildren138 49.2% Not responsible for grandchildrenWhite alone, not Hispanic / Latino 124 45.1% Responsible for grandchildren151 54.9% Not responsible for grandchildrenHispanic or Latino 30 100.0% Responsible for grandchildren