Races in East Lansing, Michigan (MI) Detailed Stats
Data:
Races - White alone (%)
Races - White alone (% change since 2000)
Races - Black alone (%)
Races - Black alone (% change since 2000)
Races - American Indian alone (%)
Races - American Indian alone (% change since 2000)
Races - Asian alone (%)
Races - Asian alone (% change since 2000)
Races - Hispanic (%)
Races - Hispanic (% change since 2000)
Races - Native Hawaiian and Other Pacific Islander alone (%)
Races - Native Hawaiian and Other Pacific Islander alone (% change since 2000)
Races - Two or more races(%)
Races - Two or more races(% change since 2000)
Races - Other race alone (%)
Races - Other race alone (% change since 2000)
Racial diversity
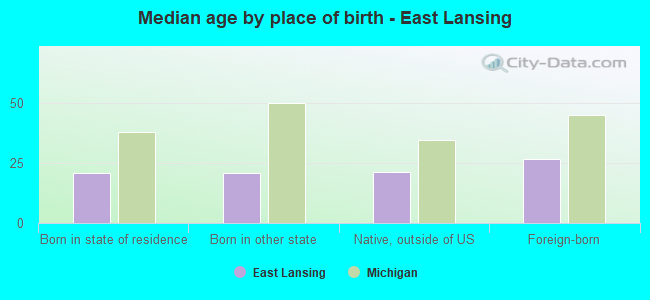
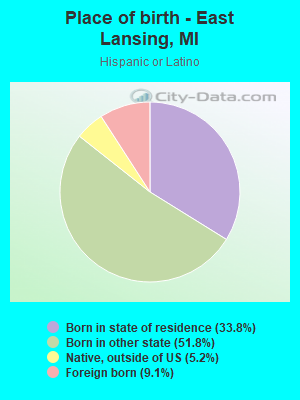
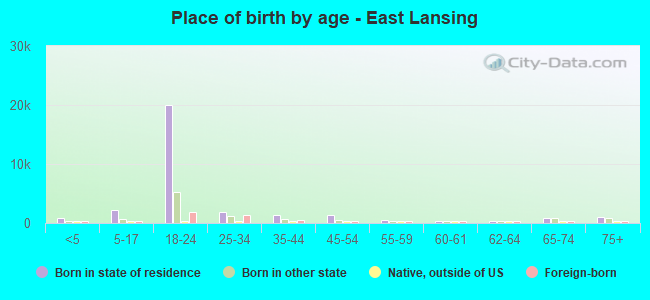
Place of birth - Born in state of residence (%)
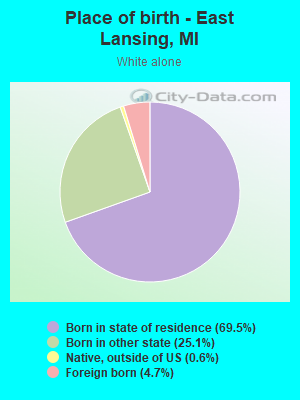
Place of birth - Born in state of residence (%) - White
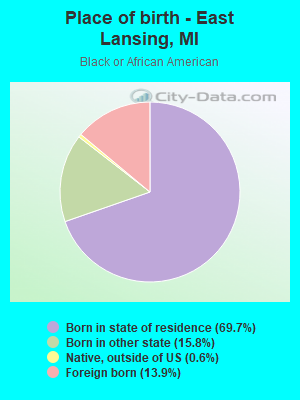
Place of birth - Born in state of residence (%) - Black or African American
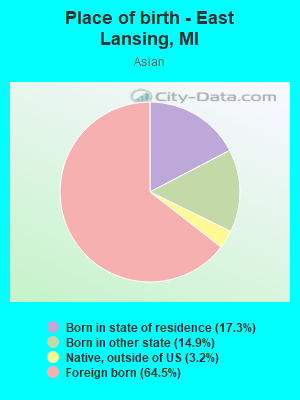
Place of birth - Born in state of residence (%) - Asian
Place of birth - Born in state of residence (%) - Hispanic or Latino
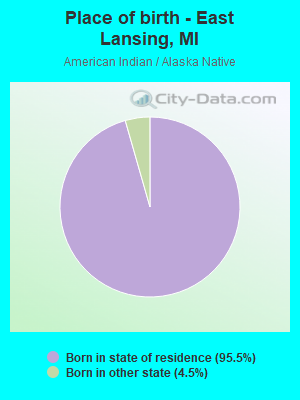
Place of birth - Born in state of residence (%) - American Indian and Alaska Native
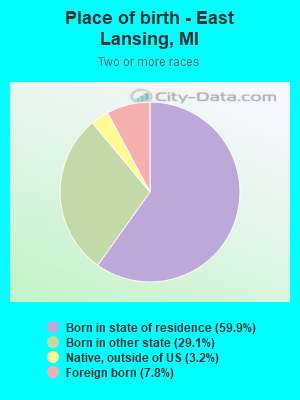
Place of birth - Born in state of residence (%) - Multirace
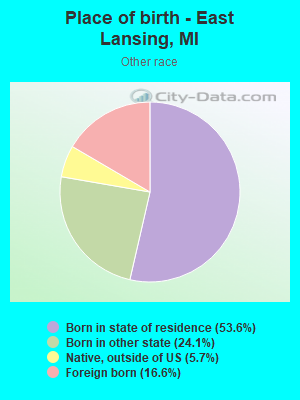
Place of birth - Born in state of residence (%) - Other Race
Place of birth - Born in other state (%)
Place of birth - Born in other state (%) - White
Place of birth - Born in other state (%) - Black or African American
Place of birth - Born in other state (%) - Asian
Place of birth - Born in other state (%) - Hispanic or Latino
Place of birth - Born in other state (%) - American Indian and Alaska Native
Place of birth - Born in other state (%) - Multirace
Place of birth - Born in other state (%) - Other Race
Place of birth - Native, outside of US (%)
Place of birth - Native, outside of US (%) - White
Place of birth - Native, outside of US (%) - Black or African American
Place of birth - Native, outside of US (%) - Asian
Place of birth - Native, outside of US (%) - Hispanic or Latino
Place of birth - Native, outside of US (%) - American Indian and Alaska Native
Place of birth - Native, outside of US (%) - Multirace
Place of birth - Native, outside of US (%) - Other Race
Place of birth - Foreign born (%)
Place of birth - Foreign born (%) - White
Place of birth - Foreign born (%) - Black or African American
Place of birth - Foreign born (%) - Asian
Place of birth - Foreign born (%) - Hispanic or Latino
Place of birth - Foreign born (%) - American Indian and Alaska Native
Place of birth - Foreign born (%) - Multirace
Place of birth - Foreign born (%) - Other Race
Residents speaking English at home (%)
Residents speaking English at home - Born in the United States (%)
Residents speaking English at home - Native, born elsewhere (%)
Residents speaking English at home - Foreign born (%)
Residents speaking Spanish at home (%)
Residents speaking Spanish at home - Born in the United States (%)
Residents speaking Spanish at home - Native, born elsewhere (%)
Residents speaking Spanish at home - Foreign born (%)
Residents speaking other language at home (%)
Residents speaking other language at home - Born in the United States (%)
Residents speaking other language at home - Native, born elsewhere (%)
Residents speaking other language at home - Foreign born (%)
Marital status - Never married (%)
Marital status - Now married (%)
Marital status - Separated (%)
Marital status - Widowed (%)
Marital status - Divorced (%)
Ancestries Reported - Arab (%)
Ancestries Reported - Czech (%)
Ancestries Reported - Danish (%)
Ancestries Reported - Dutch (%)
Ancestries Reported - English (%)
Ancestries Reported - French (%)
Ancestries Reported - French Canadian (%)
Ancestries Reported - German (%)
Ancestries Reported - Greek (%)
Ancestries Reported - Hungarian (%)
Ancestries Reported - Irish (%)
Ancestries Reported - Italian (%)
Ancestries Reported - Lithuanian (%)
Ancestries Reported - Norwegian (%)
Ancestries Reported - Polish (%)
Ancestries Reported - Portuguese (%)
Ancestries Reported - Russian (%)
Ancestries Reported - Scotch-Irish (%)
Ancestries Reported - Scottish (%)
Ancestries Reported - Slovak (%)
Ancestries Reported - Subsaharan African (%)
Ancestries Reported - Swedish (%)
Ancestries Reported - Swiss (%)
Ancestries Reported - Ukrainian (%)
Ancestries Reported - United States (%)
Ancestries Reported - Welsh (%)
Ancestries Reported - West Indian (%)
Ancestries Reported - Other (%)
Geographical mobility - Same house 1 year ago (%)
Geographical mobility - Same house 1 year ago (%) - White
Geographical mobility - Same house 1 year ago (%) - Black or African American
Geographical mobility - Same house 1 year ago (%) - Asian
Geographical mobility - Same house 1 year ago (%) - Hispanic or Latino
Geographical mobility - Same house 1 year ago (%) - American Indian and Alaska Native
Geographical mobility - Same house 1 year ago (%) - Multirace
Geographical mobility - Same house 1 year ago (%) - Other Race
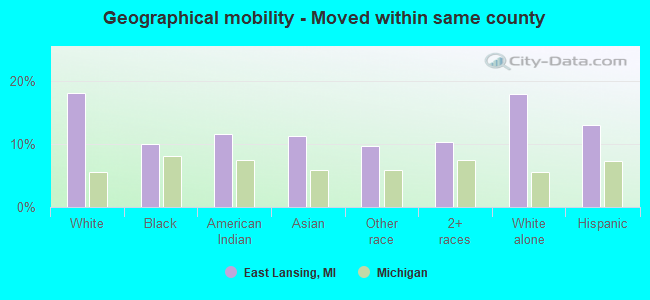
Geographical mobility - Moved within same county (%)
Geographical mobility - Moved within same county (%) - White
Geographical mobility - Moved within same county (%) - Black or African American
Geographical mobility - Moved within same county (%) - Asian
Geographical mobility - Moved within same county (%) - Hispanic or Latino
Geographical mobility - Moved within same county (%) - American Indian and Alaska Native
Geographical mobility - Moved within same county (%) - Multirace
Geographical mobility - Moved within same county (%) - Other Race
Geographical mobility - Moved from different county within same state (%)
Geographical mobility - Moved from different county within same state (%) - White
Geographical mobility - Moved from different county within same state (%) - Black or African American
Geographical mobility - Moved from different county within same state (%) - Asian
Geographical mobility - Moved from different county within same state (%) - Hispanic or Latino
Geographical mobility - Moved from different county within same state (%) - American Indian and Alaska Native
Geographical mobility - Moved from different county within same state (%) - Multirace
Geographical mobility - Moved from different county within same state (%) - Other Race
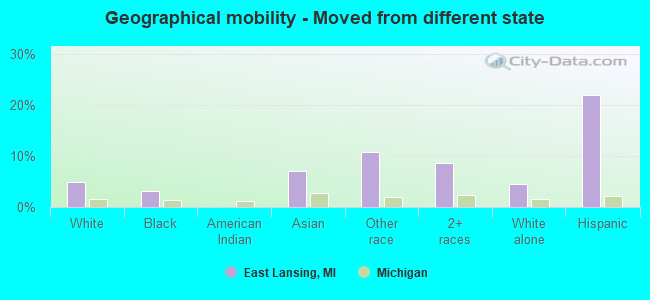
Geographical mobility - Moved from different state (%)
Geographical mobility - Moved from different state (%) - White
Geographical mobility - Moved from different state (%) - Black or African American
Geographical mobility - Moved from different state (%) - Asian
Geographical mobility - Moved from different state (%) - Hispanic or Latino
Geographical mobility - Moved from different state (%) - American Indian and Alaska Native
Geographical mobility - Moved from different state (%) - Multirace
Geographical mobility - Moved from different state (%) - Other Race
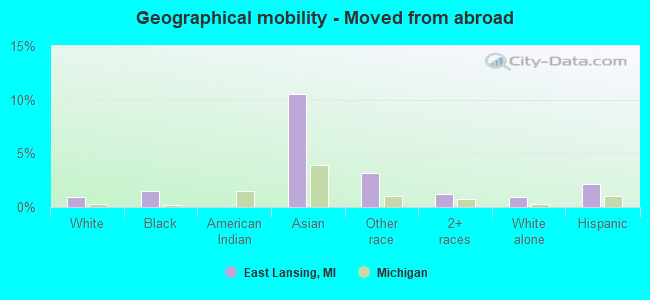
Geographical mobility - Moved from abroad (%)
Geographical mobility - Moved from abroad (%) - White
Geographical mobility - Moved from abroad (%) - Black or African American
Geographical mobility - Moved from abroad (%) - Asian
Geographical mobility - Moved from abroad (%) - Hispanic or Latino
Geographical mobility - Moved from abroad (%) - American Indian and Alaska Native
Geographical mobility - Moved from abroad (%) - Multirace
Geographical mobility - Moved from abroad (%) - Other Race
Place of birth for the foreign-born population - Ireland (%)
Place of birth for the foreign-born population - Denmark (%)
Place of birth for the foreign-born population - Norway (%)
Place of birth for the foreign-born population - Sweden (%)
Place of birth for the foreign-born population - United Kingdom (%)
Place of birth for the foreign-born population - England (%)
Place of birth for the foreign-born population - Scotland (%)
Place of birth for the foreign-born population - Other Northern Europe (%)
Place of birth for the foreign-born population - Austria (%)
Place of birth for the foreign-born population - Belgium (%)
Place of birth for the foreign-born population - France (%)
Place of birth for the foreign-born population - Germany (%)
Place of birth for the foreign-born population - Netherlands (%)
Place of birth for the foreign-born population - Switzerland (%)
Place of birth for the foreign-born population - Other Western Europe (%)
Place of birth for the foreign-born population - Greece (%)
Place of birth for the foreign-born population - Italy (%)
Place of birth for the foreign-born population - Portugal (%)
Place of birth for the foreign-born population - Spain (%)
Place of birth for the foreign-born population - Other Southern Europe (%)
Place of birth for the foreign-born population - Albania (%)
Place of birth for the foreign-born population - Belarus (%)
Place of birth for the foreign-born population - Bosnia and Herzegovina (%)
Place of birth for the foreign-born population - Bulgaria (%)
Place of birth for the foreign-born population - Croatia (%)
Place of birth for the foreign-born population - Czechoslovakia (%)
Place of birth for the foreign-born population - Hungary (%)
Place of birth for the foreign-born population - Latvia (%)
Place of birth for the foreign-born population - Lithuania (%)
Place of birth for the foreign-born population - North Macedonia (Macedonia) (%)
Place of birth for the foreign-born population - Moldova (%)
Place of birth for the foreign-born population - Poland (%)
Place of birth for the foreign-born population - Romania (%)
Place of birth for the foreign-born population - Russia (%)
Place of birth for the foreign-born population - Serbia (%)
Place of birth for the foreign-born population - Ukraine (%)
Place of birth for the foreign-born population - Other Eastern Europe (%)
Place of birth for the foreign-born population - China (%)
Place of birth for the foreign-born population - Hong Kong (%)
Place of birth for the foreign-born population - Taiwan (%)
Place of birth for the foreign-born population - Japan (%)
Place of birth for the foreign-born population - Korea (%)
Place of birth for the foreign-born population - Other Eastern Asia (%)
Place of birth for the foreign-born population - Afghanistan (%)
Place of birth for the foreign-born population - Bangladesh (%)
Place of birth for the foreign-born population - India (%)
Place of birth for the foreign-born population - Iran (%)
Place of birth for the foreign-born population - Kazakhstan (%)
Place of birth for the foreign-born population - Nepal (%)
Place of birth for the foreign-born population - Pakistan (%)
Place of birth for the foreign-born population - Sri Lanka (%)
Place of birth for the foreign-born population - Uzbekistan (%)
Place of birth for the foreign-born population - Other South Central Asia (%)
Place of birth for the foreign-born population - Burma (%)
Place of birth for the foreign-born population - Cambodia (%)
Place of birth for the foreign-born population - Indonesia (%)
Place of birth for the foreign-born population - Laos (%)
Place of birth for the foreign-born population - Malaysia (%)
Place of birth for the foreign-born population - Philippines (%)
Place of birth for the foreign-born population - Singapore (%)
Place of birth for the foreign-born population - Thailand (%)
Place of birth for the foreign-born population - Vietnam (%)
Place of birth for the foreign-born population - Other South Eastern Asia (%)
Place of birth for the foreign-born population - Armenia (%)
Place of birth for the foreign-born population - Iraq (%)
Place of birth for the foreign-born population - Israel (%)
Place of birth for the foreign-born population - Jordan (%)
Place of birth for the foreign-born population - Kuwait (%)
Place of birth for the foreign-born population - Lebanon (%)
Place of birth for the foreign-born population - Saudi Arabia (%)
Place of birth for the foreign-born population - Syria (%)
Place of birth for the foreign-born population - Turkey (%)
Place of birth for the foreign-born population - Yemen (%)
Place of birth for the foreign-born population - Other Western Asia (%)
Place of birth for the foreign-born population - Eritrea (%)
Place of birth for the foreign-born population - Ethiopia (%)
Place of birth for the foreign-born population - Kenya (%)
Place of birth for the foreign-born population - Somalia (%)
Place of birth for the foreign-born population - Uganda (%)
Place of birth for the foreign-born population - Zimbabwe (%)
Place of birth for the foreign-born population - Other Eastern Africa (%)
Place of birth for the foreign-born population - Cameroon (%)
Place of birth for the foreign-born population - Congo (%)
Place of birth for the foreign-born population - Democratic Republic of Congo (Zaire) (%)
Place of birth for the foreign-born population - Other Middle Africa (%)
Place of birth for the foreign-born population - Egypt (%)
Place of birth for the foreign-born population - Morocco (%)
Place of birth for the foreign-born population - Sudan (%)
Place of birth for the foreign-born population - Other Northern Africa (%)
Place of birth for the foreign-born population - South Africa (%)
Place of birth for the foreign-born population - Other Southern Africa (%)
Place of birth for the foreign-born population - Cabo Verde (%)
Place of birth for the foreign-born population - Ghana (%)
Place of birth for the foreign-born population - Liberia (%)
Place of birth for the foreign-born population - Nigeria (%)
Place of birth for the foreign-born population - Senegal (%)
Place of birth for the foreign-born population - Sierra Leone (%)
Place of birth for the foreign-born population - Other Western Africa (%)
Place of birth for the foreign-born population - Australia (%)
Place of birth for the foreign-born population - New Zealand (%)
Place of birth for the foreign-born population - Fiji (%)
Place of birth for the foreign-born population - Micronesia (%)
Place of birth for the foreign-born population - Bahamas (%)
Place of birth for the foreign-born population - Barbados (%)
Place of birth for the foreign-born population - Cuba (%)
Place of birth for the foreign-born population - Dominica (%)
Place of birth for the foreign-born population - Dominican Republic (%)
Place of birth for the foreign-born population - Grenada (%)
Place of birth for the foreign-born population - Haiti (%)
Place of birth for the foreign-born population - Jamaica (%)
Place of birth for the foreign-born population - St. Vincent and the Grenadines (%)
Place of birth for the foreign-born population - Trinidad and Tobago (%)
Place of birth for the foreign-born population - West Indies (%)
Place of birth for the foreign-born population - Other Caribbean (%)
Place of birth for the foreign-born population - Belize (%)
Place of birth for the foreign-born population - Costa Rica (%)
Place of birth for the foreign-born population - El Salvador (%)
Place of birth for the foreign-born population - Guatemala (%)
Place of birth for the foreign-born population - Honduras (%)
Place of birth for the foreign-born population - Mexico (%)
Place of birth for the foreign-born population - Nicaragua (%)
Place of birth for the foreign-born population - Panama (%)
Place of birth for the foreign-born population - Other Central America (%)
Place of birth for the foreign-born population - Argentina (%)
Place of birth for the foreign-born population - Bolivia (%)
Place of birth for the foreign-born population - Brazil (%)
Place of birth for the foreign-born population - Chile (%)
Place of birth for the foreign-born population - Colombia (%)
Place of birth for the foreign-born population - Ecuador (%)
Place of birth for the foreign-born population - Guyana (%)
Place of birth for the foreign-born population - Peru (%)
Place of birth for the foreign-born population - Uruguay (%)
Place of birth for the foreign-born population - Venezuela (%)
Place of birth for the foreign-born population - Other South America (%)
Place of birth for the foreign-born population - Canada (%)
Place of birth for the foreign-born population - Other Northern America (%)
Place of birth for the foreign-born population - Other (%)
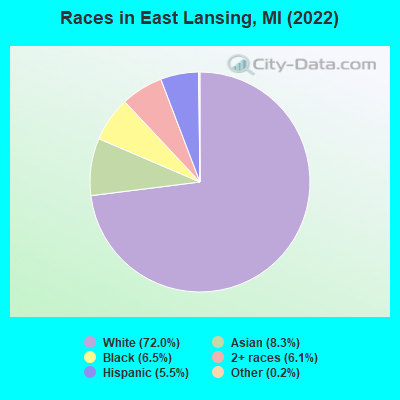
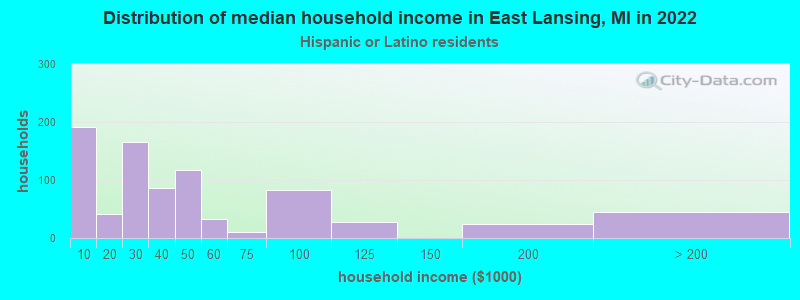
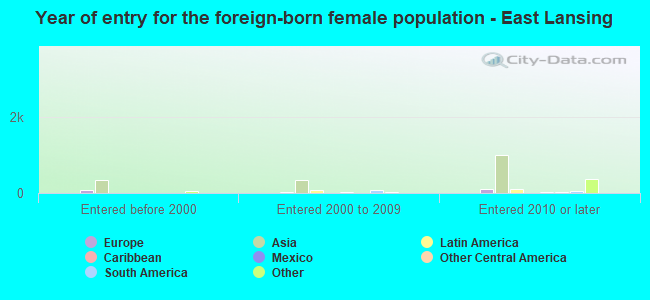
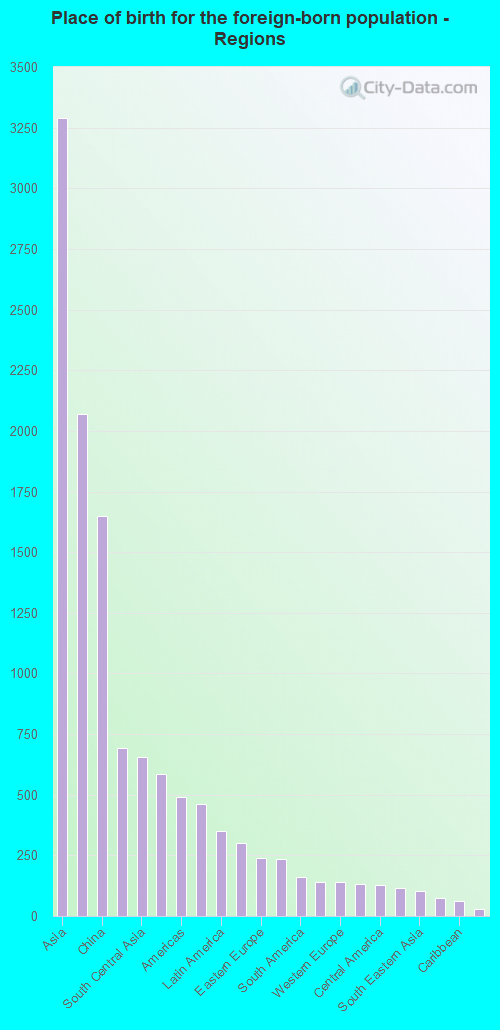
According to 2022 data, the most numerous races in East Lansing, MI are White alone (32,893 residents), Black alone (2,978 residents), and Hispanic (2,525 residents). 83.6% of East Lansing residents speak English at home. 11.1% of East Lansing, MI residents are foreign-born (7.2% born in Asia, 1.5% born in Africa, 1.3% born in Europe), which is 45.9% greater than the foreign-born rate of 6.0% across the entire state of Michigan.
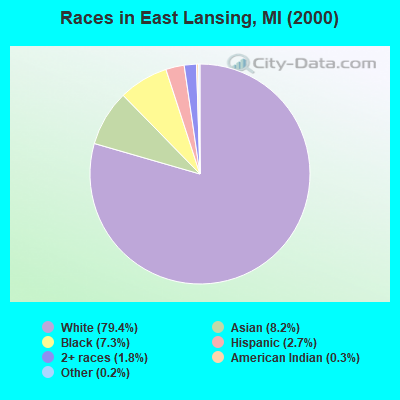
Race distribution in East Lansing
2000 2022
7,806,691 78.6% White alone 1,402,047 14.1% Black alone 323,877 3.3% Hispanic 175,311 1.8% Asian alone 163,487 1.6% Two or more races 53,421 0.5% American Indian alone 11,465 0.1% Other race alone 2,145 0.02% Native Hawaiian and Other
7,289,051 72.6% White alone 1,310,464 13.1% Black alone 572,405 5.7% Hispanic 450,031 4.5% Two or more races 335,732 3.3% Asian alone 45,217 0.5% Other race alone 29,011 0.3% American Indian alone 2,207 0.02% Native Hawaiian and Other
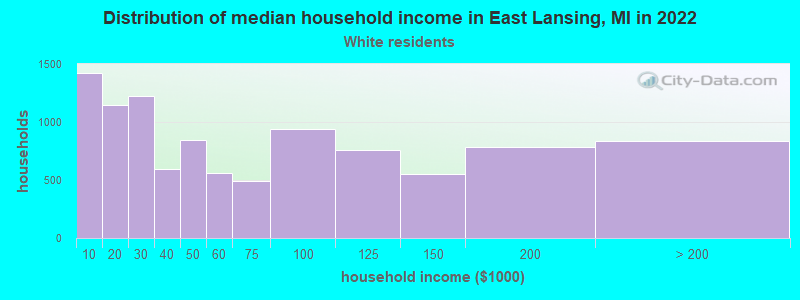
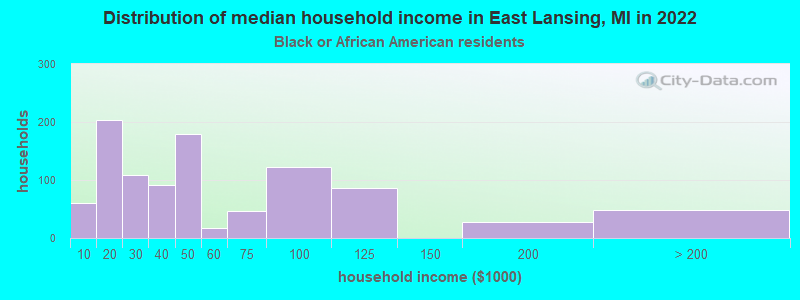
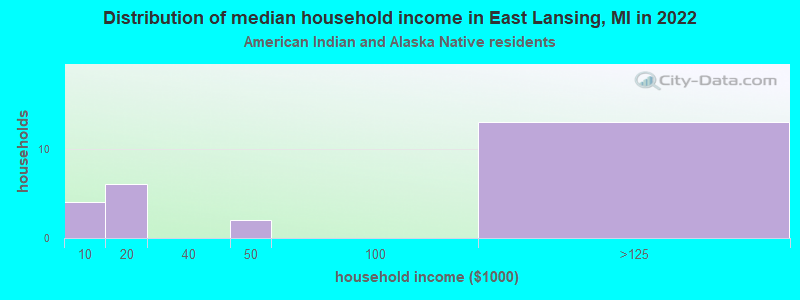
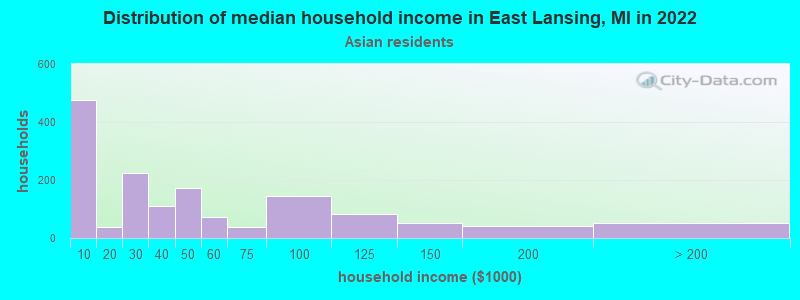
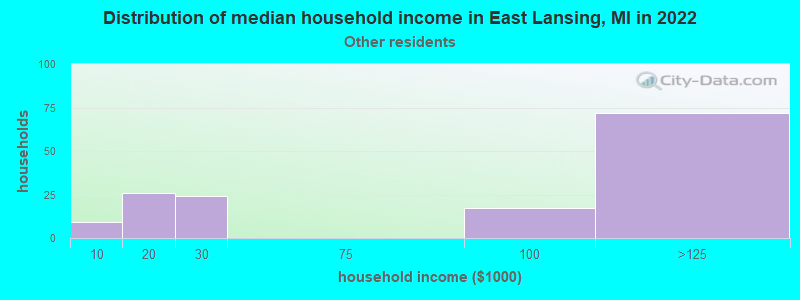
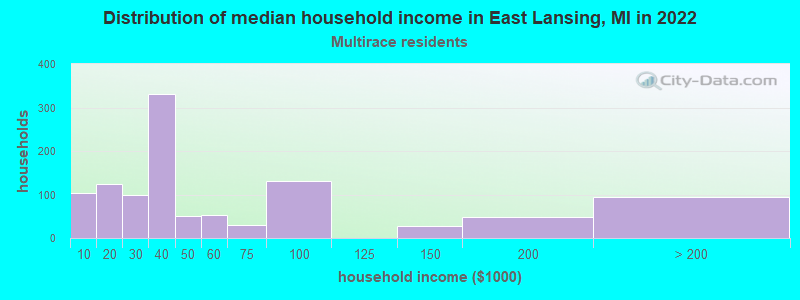
Income and house value in East Lansing Median household income in 2022 $49,146 White non-Hispanic householders$36,754 Black householders$28,500 Asian householders$40,377 Two or more races householders$35,039 Hispanic or Latino race householdersMedian 2022 house value $259,711 White Non-Hispanic householders$234,618 Black or African American householders$124,747 American Indian or Alaska Native householders $304,520 Asian householders$175,650 Some other race householders$236,231 Two or more races householders$236,052 Hispanic or Latino householders
Median age by race in East Lansing
21.2 Median age for White residents20.9 21.2 23.4 Median age for Black or African American residents23.9 26.5 27.9 Median age for American Indian / Alaska Native residents18.5 106.2 21.5 Median age for Asian residents22.1 20.8 -666,666,666.0 Median age for Native Hawaiian / Pacific Islander residents-666,666,666.0 -666,666,666.0 22.9 Median age for Other race residents30.1 16.9 21.9 Median age for Two or more races residents21.6 22.1 21.1 Median age for White alone residents21.1 21.1 20.9 Median age for Hispanic or Latino residents21.5 20.8
Owner/renter occupied households by race in East Lansing
House owners and renters - White residents 4,596 45.2% Owner occupied5,582 54.8% Renter occupiedHouse owners and renters - Black or African American residents 262 26.5% Owner occupied724 73.5% Renter occupiedHouse owners and renters - American Indian / Alaska Native residents 18 64.3% Owner occupied10 35.7% Renter occupiedHouse owners and renters - Asian residents 483 36.5% Owner occupied839 63.5% Renter occupiedHouse owners and renters - Other race residents 59 27.1% Owner occupied158 72.9% Renter occupiedHouse owners and renters - Two or more races residents 320 28.6% Owner occupied797 71.4% Renter occupiedHouse owners and renters - White alone residents 4,636 46.1% Owner occupied5,429 53.9% Renter occupiedHouse owners and renters - Hispanic or Latino residents 178 21.6% Owner occupied647 78.4% Renter occupied
Language usage in East Lansing
English speakers - Total 83.6% of residents of East Lansing speak English at home.
4.1% of residents speak Spanish at home 1,742 95.6% Speak English very well81 4.4% Speak English less than very well12.7% of residents speak other language at home 4,365 76.6% Speak English very well1,336 23.4% Speak English less than very well
English speakers - Born in the United States 85.4% of residents of East Lansing speak English at home.
8.6% of residents speak Spanish at home 925 98.6% Speak English very well13 1.4% Speak English less than very well6.1% of residents speak other language at home 625 94.8% Speak English very well34 5.2% Speak English less than very well
English speakers - Native, born elsewhere 38.2% of residents of East Lansing speak English at home.
31.8% of residents speak Spanish at home 197 96.6% Speak English very well7 3.4% Speak English less than very well46.0% of residents speak other language at home 216 73.2% Speak English very well79 26.8% Speak English less than very well
English speakers - Foreign-born 20.8% of residents of East Lansing speak English at home.
9.7% of residents speak Spanish at home 434 90.6% Speak English very well45 9.4% Speak English less than very well72.3% of residents speak other language at home 2,470 69.0% Speak English very well1,109 31.0% Speak English less than very well
White (Caucasian) - Speak only English Native:
96.0% (29,992)Foreign-born:
30.6% (435)
White (Caucasian) - Speak another language Native:
4.0% (1,265)Foreign-born:
68.9% (978)
Black or African American - Speak only English Native:
95.2% (2,517)Foreign-born:
14.6% (64)
Black or African American - Speak another language Native:
3.8% (102)Foreign-born:
100.0% (436)
Asian - Speak only English Native:
34.0% (424)Foreign-born:
20.1% (505)
Asian - Speak another language Native:
66.8% (834)Foreign-born:
80.6% (2,026)
Other race - Speak another language Native:
72.9% (397)Foreign-born:
89.7% (96)
Two or more races - Speak only English Native:
79.7% (2,883)Foreign-born:
5.6% (19)
Two or more races - Speak another language Native:
21.2% (766)Foreign-born:
85.0% (284)
White alone - Speak only English Native:
96.7% (29,898)Foreign-born:
28.5% (445)
White alone - Speak another language Native:
3.5% (1,067)Foreign-born:
71.8% (1,122)
Hispanic or Latino - Speak another language Native:
45.4% (1,005)Foreign-born:
87.5% (232)
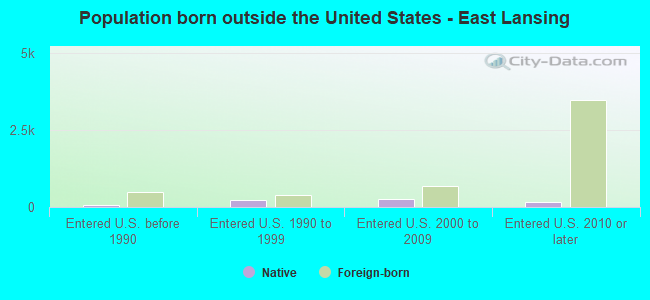
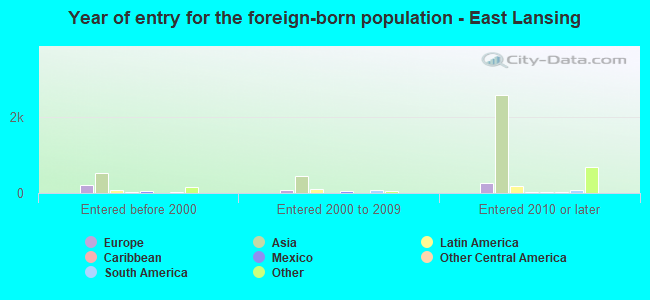
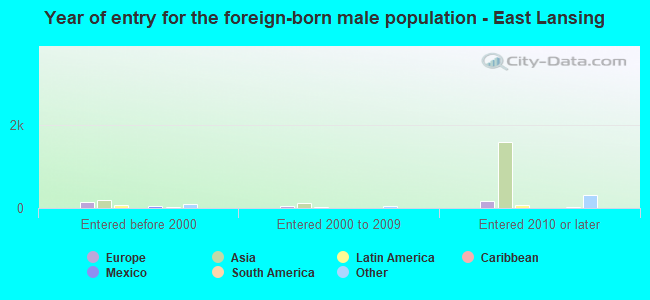
Foreign-born residents in East Lansing 5,067 residents are foreign born (7.2% Asia , 1.5% Africa , 1.3% Europe ).
This city:
11.1%Michigan:
6.9%
Marital status for residents in East Lansing Marital status - White (Caucasian) population 15 years and over
Males 75.0% Never married21.0% Now married0.1% Separated1.5% Widowed2.4% DivorcedFemales 73.4% Never married20.1% Now married0.2% Separated3.2% Widowed3.2% DivorcedWomen who gave birth in the past 12 months Now married:
89.8% (112)Unmarried:
10.2% (13)
Women who did not give birth in the past 12 months Now married:
11.8% (1,572)Unmarried:
88.2% (11,734)
Marital status - Black or African American population 15 years and over
Males 79.9% Never married14.8% Now married0.8% Separated0.0% Widowed4.6% DivorcedFemales 75.1% Never married11.5% Now married0.0% Separated5.8% Widowed7.6% DivorcedWomen who gave birth in the past 12 months Now married:
100.0% (3)Unmarried:
0.0% (0)
Women who did not give birth in the past 12 months Now married:
9.7% (107)Unmarried:
90.3% (993)
Marital status - American Indian / Alaska Native population 15 years and over
Males 52.4% Never married47.6% Now married0.0% Separated0.0% Widowed0.0% DivorcedFemales 39.5% Never married34.2% Now married13.2% Separated0.0% Widowed13.2% DivorcedWomen who did not give birth in the past 12 months Now married:
54.5% (19)Unmarried:
45.5% (15)
Marital status - Asian population 15 years and over
Males 79.2% Never married18.1% Now married0.6% Separated0.6% Widowed1.5% DivorcedFemales 70.1% Never married27.3% Now married1.1% Separated0.9% Widowed0.6% DivorcedWomen who gave birth in the past 12 months Now married:
100.0% (20)Unmarried:
0.0% (0)
Women who did not give birth in the past 12 months Now married:
17.4% (272)Unmarried:
82.6% (1,286)
Marital status - Other race population 15 years and over
Males 57.4% Never married34.6% Now married0.0% Separated0.0% Widowed8.0% DivorcedFemales 65.3% Never married34.7% Now married0.0% Separated0.0% Widowed0.0% DivorcedWomen who did not give birth in the past 12 months Now married:
29.7% (55)Unmarried:
70.3% (130)
Marital status - Two or more races population 15 years and over
Males 81.0% Never married14.6% Now married0.0% Separated0.0% Widowed4.3% DivorcedFemales 89.3% Never married7.9% Now married1.1% Separated0.0% Widowed1.6% DivorcedWomen who did not give birth in the past 12 months Now married:
7.3% (149)Unmarried:
92.7% (1,900)
Marital status - White alone, not Hispanic / Latino population 15 years and over
Males 74.4% Never married21.5% Now married0.1% Separated1.5% Widowed2.5% DivorcedFemales 72.7% Never married20.6% Now married0.2% Separated3.3% Widowed3.3% DivorcedWomen who gave birth in the past 12 months Now married:
89.8% (116)Unmarried:
10.2% (13)
Women who did not give birth in the past 12 months Now married:
12.2% (1,611)Unmarried:
87.8% (11,631)
Marital status - Hispanic or Latino population 15 years and over
Males 77.4% Never married21.3% Now married0.0% Separated0.0% Widowed1.3% DivorcedFemales 83.8% Never married12.7% Now married1.2% Separated0.5% Widowed1.8% DivorcedWomen who did not give birth in the past 12 months Now married:
11.8% (129)Unmarried:
88.2% (965)
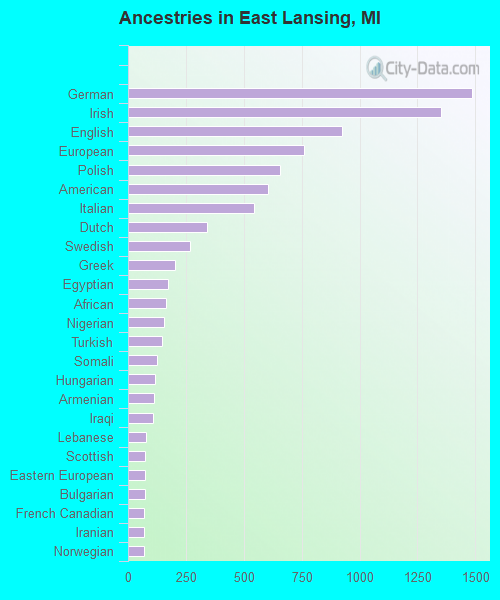
Ancestries in East Lansing
1,485 9.2% German1,353 8.4% Irish925 5.7% English760 4.7% European655 4.1% Polish603 3.7% American543 3.4% Italian341 2.1% Dutch269 1.7% Swedish203 1.3% Greek173 1.1% Egyptian165 1.0% African154 1.0% Nigerian146 0.9% Turkish125 0.8% Somali115 0.7% Hungarian112 0.7% Armenian109 0.7% Iraqi77 0.5% Lebanese75 0.5% Scottish75 0.5% Eastern European72 0.4% Bulgarian71 0.4% French Canadian70 0.4% Iranian68 0.4% Norwegian66 0.4% Ethiopian66 0.4% Danish60 0.4% British47 0.3% French46 0.3% Finnish44 0.3% Serbian44 0.3% Ukrainian40 0.2% Russian40 0.2% Scotch-Irish37 0.2% Australian34 0.2% Romanian34 0.2% Jordanian34 0.2% Ghanaian31 0.2% Scandinavian29 0.2% Assyrian26 0.2% Palestinian24 0.1% Canadian21 0.1% Lithuanian19 0.1% Brazilian17 0.1% Swiss14 0.09% Austrian14 0.09% Yugoslavian12 0.07% Czech11 0.07% Albanian10 0.06% Belgian10 0.06% Portuguese10 0.06% Latvian5 0.03% Cypriot4 0.02% Macedonian4 0.02% Northern European
Geographical mobility in East Lansing Same house 1 year ago 18,084 54.7% White (Caucasian)2,261 72.6% Black or African American81 70.1% American Indian / Alaska Native2,157 56.2% Asian324 65.3% Other race2,500 62.3% Two or more races18,109 55.2% White alone, not Hispanic / Latino1,388 54.8% Hispanic or LatinoMoved within same county 5,945 18.0% White / Caucasian313 10.0% Black or African American13 11.6% American Indian / Alaska Native433 11.3% Asian48 9.6% Other race411 10.2% Two or more races5,890 18.0% White alone, not Hispanic / Latino329 13.0% Hispanic or LatinoMoved within same state 7,657 23.2% White / Caucasian397 12.8% Black or African American14 12.2% American Indian / Alaska Native420 10.9% Asian57 11.5% Other race701 17.5% Two or more races7,564 23.1% White alone, not Hispanic / Latino368 14.5% Hispanic or LatinoMoved from different state 1,608 4.9% White / Caucasian99 3.2% Black or African American270 7.0% Asian54 10.8% Other race344 8.6% Two or more races1,465 4.5% White alone, not Hispanic / Latino556 22.0% Hispanic or LatinoMoved from abroad 316 1.0% White47 1.5% Black or African American406 10.6% Asian16 3.2% Other race49 1.2% Two or more races310 0.9% White alone, not Hispanic / Latino55 2.2% Hispanic or Latino
Children Nativity (place of birth) in East Lansing
Children under 6 years - Living with two parents Both parents native 822 100.0% NativeBoth parents foreign-born 93 84.5% Native17 15.5% Foreign-bornOne native, one foreign-born parent 69 100.0% NativeChildren under 6 years - Living with one parent Native parent 83 100.0% NativeForeign-born parent 25 76.0% Native8 24.0% Foreign-bornChildren 6 to 17 years - Living with two parents Both parents native 1,561 95.4% Native75 4.6% Foreign-bornBoth parents foreign-born 64 86.7% Native10 13.3% Foreign-bornOne native, one foreign-born parent 141 100.0% NativeChildren 6 to 17 years - Living with one parent Native parent 239 69.9% Native103 30.1% Foreign-bornForeign-born parent 221 77.9% Native62 22.1% Foreign-born
Grandparents responsible for own grandchildren in East Lansing
Grandparents (30 to 59 years) White / Caucasian 42 100.0% Responsible for grandchildrenBlack or African American 7 100.0% Responsible for grandchildrenWhite alone, not Hispanic / Latino 42 100.0% Responsible for grandchildrenGrandparents (60 years and over) White / Caucasian 9 18.3% Responsible for grandchildren42 81.7% Not responsible for grandchildrenBlack or African American 7 100.0% Not responsible for grandchildrenWhite alone, not Hispanic / Latino 10 17.1% Responsible for grandchildren47 82.9% Not responsible for grandchildren