Races in East Lake-Orient Park, Florida (FL) Detailed Stats
Data:
Races - White alone (%)
Races - White alone (% change since 2000)
Races - Black alone (%)
Races - Black alone (% change since 2000)
Races - American Indian alone (%)
Races - American Indian alone (% change since 2000)
Races - Asian alone (%)
Races - Asian alone (% change since 2000)
Races - Hispanic (%)
Races - Hispanic (% change since 2000)
Races - Native Hawaiian and Other Pacific Islander alone (%)
Races - Native Hawaiian and Other Pacific Islander alone (% change since 2000)
Races - Two or more races(%)
Races - Two or more races(% change since 2000)
Races - Other race alone (%)
Races - Other race alone (% change since 2000)
Racial diversity
Place of birth - Born in state of residence (%)
Place of birth - Born in state of residence (%) - White
Place of birth - Born in state of residence (%) - Black or African American
Place of birth - Born in state of residence (%) - Asian
Place of birth - Born in state of residence (%) - Hispanic or Latino
Place of birth - Born in state of residence (%) - American Indian and Alaska Native
Place of birth - Born in state of residence (%) - Multirace
Place of birth - Born in state of residence (%) - Other Race
Place of birth - Born in other state (%)
Place of birth - Born in other state (%) - White
Place of birth - Born in other state (%) - Black or African American
Place of birth - Born in other state (%) - Asian
Place of birth - Born in other state (%) - Hispanic or Latino
Place of birth - Born in other state (%) - American Indian and Alaska Native
Place of birth - Born in other state (%) - Multirace
Place of birth - Born in other state (%) - Other Race
Place of birth - Native, outside of US (%)
Place of birth - Native, outside of US (%) - White
Place of birth - Native, outside of US (%) - Black or African American
Place of birth - Native, outside of US (%) - Asian
Place of birth - Native, outside of US (%) - Hispanic or Latino
Place of birth - Native, outside of US (%) - American Indian and Alaska Native
Place of birth - Native, outside of US (%) - Multirace
Place of birth - Native, outside of US (%) - Other Race
Place of birth - Foreign born (%)
Place of birth - Foreign born (%) - White
Place of birth - Foreign born (%) - Black or African American
Place of birth - Foreign born (%) - Asian
Place of birth - Foreign born (%) - Hispanic or Latino
Place of birth - Foreign born (%) - American Indian and Alaska Native
Place of birth - Foreign born (%) - Multirace
Place of birth - Foreign born (%) - Other Race
Residents speaking English at home (%)
Residents speaking English at home - Born in the United States (%)
Residents speaking English at home - Native, born elsewhere (%)
Residents speaking English at home - Foreign born (%)
Residents speaking Spanish at home (%)
Residents speaking Spanish at home - Born in the United States (%)
Residents speaking Spanish at home - Native, born elsewhere (%)
Residents speaking Spanish at home - Foreign born (%)
Residents speaking other language at home (%)
Residents speaking other language at home - Born in the United States (%)
Residents speaking other language at home - Native, born elsewhere (%)
Residents speaking other language at home - Foreign born (%)
Marital status - Never married (%)
Marital status - Now married (%)
Marital status - Separated (%)
Marital status - Widowed (%)
Marital status - Divorced (%)
Ancestries Reported - Arab (%)
Ancestries Reported - Czech (%)
Ancestries Reported - Danish (%)
Ancestries Reported - Dutch (%)
Ancestries Reported - English (%)
Ancestries Reported - French (%)
Ancestries Reported - French Canadian (%)
Ancestries Reported - German (%)
Ancestries Reported - Greek (%)
Ancestries Reported - Hungarian (%)
Ancestries Reported - Irish (%)
Ancestries Reported - Italian (%)
Ancestries Reported - Lithuanian (%)
Ancestries Reported - Norwegian (%)
Ancestries Reported - Polish (%)
Ancestries Reported - Portuguese (%)
Ancestries Reported - Russian (%)
Ancestries Reported - Scotch-Irish (%)
Ancestries Reported - Scottish (%)
Ancestries Reported - Slovak (%)
Ancestries Reported - Subsaharan African (%)
Ancestries Reported - Swedish (%)
Ancestries Reported - Swiss (%)
Ancestries Reported - Ukrainian (%)
Ancestries Reported - United States (%)
Ancestries Reported - Welsh (%)
Ancestries Reported - West Indian (%)
Ancestries Reported - Other (%)
Geographical mobility - Same house 1 year ago (%)
Geographical mobility - Same house 1 year ago (%) - White
Geographical mobility - Same house 1 year ago (%) - Black or African American
Geographical mobility - Same house 1 year ago (%) - Asian
Geographical mobility - Same house 1 year ago (%) - Hispanic or Latino
Geographical mobility - Same house 1 year ago (%) - American Indian and Alaska Native
Geographical mobility - Same house 1 year ago (%) - Multirace
Geographical mobility - Same house 1 year ago (%) - Other Race
Geographical mobility - Moved within same county (%)
Geographical mobility - Moved within same county (%) - White
Geographical mobility - Moved within same county (%) - Black or African American
Geographical mobility - Moved within same county (%) - Asian
Geographical mobility - Moved within same county (%) - Hispanic or Latino
Geographical mobility - Moved within same county (%) - American Indian and Alaska Native
Geographical mobility - Moved within same county (%) - Multirace
Geographical mobility - Moved within same county (%) - Other Race
Geographical mobility - Moved from different county within same state (%)
Geographical mobility - Moved from different county within same state (%) - White
Geographical mobility - Moved from different county within same state (%) - Black or African American
Geographical mobility - Moved from different county within same state (%) - Asian
Geographical mobility - Moved from different county within same state (%) - Hispanic or Latino
Geographical mobility - Moved from different county within same state (%) - American Indian and Alaska Native
Geographical mobility - Moved from different county within same state (%) - Multirace
Geographical mobility - Moved from different county within same state (%) - Other Race
Geographical mobility - Moved from different state (%)
Geographical mobility - Moved from different state (%) - White
Geographical mobility - Moved from different state (%) - Black or African American
Geographical mobility - Moved from different state (%) - Asian
Geographical mobility - Moved from different state (%) - Hispanic or Latino
Geographical mobility - Moved from different state (%) - American Indian and Alaska Native
Geographical mobility - Moved from different state (%) - Multirace
Geographical mobility - Moved from different state (%) - Other Race
Geographical mobility - Moved from abroad (%)
Geographical mobility - Moved from abroad (%) - White
Geographical mobility - Moved from abroad (%) - Black or African American
Geographical mobility - Moved from abroad (%) - Asian
Geographical mobility - Moved from abroad (%) - Hispanic or Latino
Geographical mobility - Moved from abroad (%) - American Indian and Alaska Native
Geographical mobility - Moved from abroad (%) - Multirace
Geographical mobility - Moved from abroad (%) - Other Race
Place of birth for the foreign-born population - Ireland (%)
Place of birth for the foreign-born population - Denmark (%)
Place of birth for the foreign-born population - Norway (%)
Place of birth for the foreign-born population - Sweden (%)
Place of birth for the foreign-born population - United Kingdom (%)
Place of birth for the foreign-born population - England (%)
Place of birth for the foreign-born population - Scotland (%)
Place of birth for the foreign-born population - Other Northern Europe (%)
Place of birth for the foreign-born population - Austria (%)
Place of birth for the foreign-born population - Belgium (%)
Place of birth for the foreign-born population - France (%)
Place of birth for the foreign-born population - Germany (%)
Place of birth for the foreign-born population - Netherlands (%)
Place of birth for the foreign-born population - Switzerland (%)
Place of birth for the foreign-born population - Other Western Europe (%)
Place of birth for the foreign-born population - Greece (%)
Place of birth for the foreign-born population - Italy (%)
Place of birth for the foreign-born population - Portugal (%)
Place of birth for the foreign-born population - Spain (%)
Place of birth for the foreign-born population - Other Southern Europe (%)
Place of birth for the foreign-born population - Albania (%)
Place of birth for the foreign-born population - Belarus (%)
Place of birth for the foreign-born population - Bosnia and Herzegovina (%)
Place of birth for the foreign-born population - Bulgaria (%)
Place of birth for the foreign-born population - Croatia (%)
Place of birth for the foreign-born population - Czechoslovakia (%)
Place of birth for the foreign-born population - Hungary (%)
Place of birth for the foreign-born population - Latvia (%)
Place of birth for the foreign-born population - Lithuania (%)
Place of birth for the foreign-born population - North Macedonia (Macedonia) (%)
Place of birth for the foreign-born population - Moldova (%)
Place of birth for the foreign-born population - Poland (%)
Place of birth for the foreign-born population - Romania (%)
Place of birth for the foreign-born population - Russia (%)
Place of birth for the foreign-born population - Serbia (%)
Place of birth for the foreign-born population - Ukraine (%)
Place of birth for the foreign-born population - Other Eastern Europe (%)
Place of birth for the foreign-born population - China (%)
Place of birth for the foreign-born population - Hong Kong (%)
Place of birth for the foreign-born population - Taiwan (%)
Place of birth for the foreign-born population - Japan (%)
Place of birth for the foreign-born population - Korea (%)
Place of birth for the foreign-born population - Other Eastern Asia (%)
Place of birth for the foreign-born population - Afghanistan (%)
Place of birth for the foreign-born population - Bangladesh (%)
Place of birth for the foreign-born population - India (%)
Place of birth for the foreign-born population - Iran (%)
Place of birth for the foreign-born population - Kazakhstan (%)
Place of birth for the foreign-born population - Nepal (%)
Place of birth for the foreign-born population - Pakistan (%)
Place of birth for the foreign-born population - Sri Lanka (%)
Place of birth for the foreign-born population - Uzbekistan (%)
Place of birth for the foreign-born population - Other South Central Asia (%)
Place of birth for the foreign-born population - Burma (%)
Place of birth for the foreign-born population - Cambodia (%)
Place of birth for the foreign-born population - Indonesia (%)
Place of birth for the foreign-born population - Laos (%)
Place of birth for the foreign-born population - Malaysia (%)
Place of birth for the foreign-born population - Philippines (%)
Place of birth for the foreign-born population - Singapore (%)
Place of birth for the foreign-born population - Thailand (%)
Place of birth for the foreign-born population - Vietnam (%)
Place of birth for the foreign-born population - Other South Eastern Asia (%)
Place of birth for the foreign-born population - Armenia (%)
Place of birth for the foreign-born population - Iraq (%)
Place of birth for the foreign-born population - Israel (%)
Place of birth for the foreign-born population - Jordan (%)
Place of birth for the foreign-born population - Kuwait (%)
Place of birth for the foreign-born population - Lebanon (%)
Place of birth for the foreign-born population - Saudi Arabia (%)
Place of birth for the foreign-born population - Syria (%)
Place of birth for the foreign-born population - Turkey (%)
Place of birth for the foreign-born population - Yemen (%)
Place of birth for the foreign-born population - Other Western Asia (%)
Place of birth for the foreign-born population - Eritrea (%)
Place of birth for the foreign-born population - Ethiopia (%)
Place of birth for the foreign-born population - Kenya (%)
Place of birth for the foreign-born population - Somalia (%)
Place of birth for the foreign-born population - Uganda (%)
Place of birth for the foreign-born population - Zimbabwe (%)
Place of birth for the foreign-born population - Other Eastern Africa (%)
Place of birth for the foreign-born population - Cameroon (%)
Place of birth for the foreign-born population - Congo (%)
Place of birth for the foreign-born population - Democratic Republic of Congo (Zaire) (%)
Place of birth for the foreign-born population - Other Middle Africa (%)
Place of birth for the foreign-born population - Egypt (%)
Place of birth for the foreign-born population - Morocco (%)
Place of birth for the foreign-born population - Sudan (%)
Place of birth for the foreign-born population - Other Northern Africa (%)
Place of birth for the foreign-born population - South Africa (%)
Place of birth for the foreign-born population - Other Southern Africa (%)
Place of birth for the foreign-born population - Cabo Verde (%)
Place of birth for the foreign-born population - Ghana (%)
Place of birth for the foreign-born population - Liberia (%)
Place of birth for the foreign-born population - Nigeria (%)
Place of birth for the foreign-born population - Senegal (%)
Place of birth for the foreign-born population - Sierra Leone (%)
Place of birth for the foreign-born population - Other Western Africa (%)
Place of birth for the foreign-born population - Australia (%)
Place of birth for the foreign-born population - New Zealand (%)
Place of birth for the foreign-born population - Fiji (%)
Place of birth for the foreign-born population - Micronesia (%)
Place of birth for the foreign-born population - Bahamas (%)
Place of birth for the foreign-born population - Barbados (%)
Place of birth for the foreign-born population - Cuba (%)
Place of birth for the foreign-born population - Dominica (%)
Place of birth for the foreign-born population - Dominican Republic (%)
Place of birth for the foreign-born population - Grenada (%)
Place of birth for the foreign-born population - Haiti (%)
Place of birth for the foreign-born population - Jamaica (%)
Place of birth for the foreign-born population - St. Vincent and the Grenadines (%)
Place of birth for the foreign-born population - Trinidad and Tobago (%)
Place of birth for the foreign-born population - West Indies (%)
Place of birth for the foreign-born population - Other Caribbean (%)
Place of birth for the foreign-born population - Belize (%)
Place of birth for the foreign-born population - Costa Rica (%)
Place of birth for the foreign-born population - El Salvador (%)
Place of birth for the foreign-born population - Guatemala (%)
Place of birth for the foreign-born population - Honduras (%)
Place of birth for the foreign-born population - Mexico (%)
Place of birth for the foreign-born population - Nicaragua (%)
Place of birth for the foreign-born population - Panama (%)
Place of birth for the foreign-born population - Other Central America (%)
Place of birth for the foreign-born population - Argentina (%)
Place of birth for the foreign-born population - Bolivia (%)
Place of birth for the foreign-born population - Brazil (%)
Place of birth for the foreign-born population - Chile (%)
Place of birth for the foreign-born population - Colombia (%)
Place of birth for the foreign-born population - Ecuador (%)
Place of birth for the foreign-born population - Guyana (%)
Place of birth for the foreign-born population - Peru (%)
Place of birth for the foreign-born population - Uruguay (%)
Place of birth for the foreign-born population - Venezuela (%)
Place of birth for the foreign-born population - Other South America (%)
Place of birth for the foreign-born population - Canada (%)
Place of birth for the foreign-born population - Other Northern America (%)
Place of birth for the foreign-born population - Other (%)
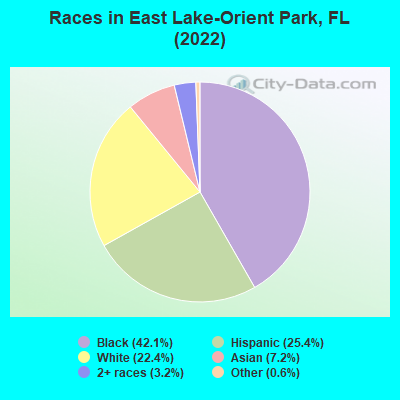
According to 2022 data, the most numerous races in East Lake-Orient Park, FL are White alone (6,751 residents), Hispanic (7,660 residents), and Black alone (12,697 residents). 72.1% of East Lake-Orient Park residents speak English at home. 18.7% of East Lake-Orient Park, FL residents are foreign-born (9.4% born in Latin America, 7.3% born in Asia), which is 12.0% less than the foreign-born rate of 21.0% across the entire state of Florida.
Race distribution in East Lake-Orient Park
2000 2022
10,458,509 65.4% White alone 2,682,715 16.8% Hispanic 2,264,268 14.2% Black alone 261,693 1.6% Asian alone 236,954 1.5% Two or more races 42,358 0.3% American Indian alone 28,994 0.2% Other race alone 6,887 0.04% Native Hawaiian and Other
11,309,403 50.8% White alone 6,025,039 27.1% Hispanic 3,241,015 14.6% Black alone 861,630 3.9% Two or more races 623,692 2.8% Asian alone 152,054 0.7% Other race alone 22,504 0.1% American Indian alone 9,486 0.04% Native Hawaiian and Other
Income and house value in East Lake-Orient Park Median household income in 2022 $72,414 White non-Hispanic householders$46,306 Black householders$77,013 Asian householders$90,360 Some other race householders$65,841 Two or more races householders$69,734 Hispanic or Latino race householdersMedian 2022 house value $248,849 White Non-Hispanic householders$262,334 Black or African American householders$252,118 Some other race householders$306,465 Two or more races householders$259,882 Hispanic or Latino householders
Median age by race in East Lake-Orient Park
45.5 Median age for White residents45.4 46.1 29.4 Median age for Black or African American residents28.5 31.0 61.7 Median age for American Indian / Alaska Native residents-676,245,210.1 -655,399,060.4 33.5 Median age for Asian residents31.6 34.1 -848,484,847.6 Median age for Native Hawaiian / Pacific Islander residents-776,729,559.0 -490,118,576.6 35.2 Median age for Other race residents35.4 34.8 29.5 Median age for Two or more races residents30.3 29.2 46.1 Median age for White alone residents45.0 47.9 32.5 Median age for Hispanic or Latino residents31.6 34.3
Owner/renter occupied households by race in East Lake-Orient Park
House owners and renters - White residents 2,486 64.3% Owner occupied1,380 35.7% Renter occupiedHouse owners and renters - Black or African American residents 1,807 39.1% Owner occupied2,815 60.9% Renter occupiedHouse owners and renters - American Indian / Alaska Native residents 21 75.8% Owner occupied7 24.2% Renter occupiedHouse owners and renters - Asian residents 329 50.2% Owner occupied326 49.8% Renter occupiedHouse owners and renters - Other race residents 295 71.8% Owner occupied116 28.2% Renter occupiedHouse owners and renters - Two or more races residents 1,016 51.6% Owner occupied954 48.4% Renter occupiedHouse owners and renters - White alone residents 2,225 65.8% Owner occupied1,157 34.2% Renter occupiedHouse owners and renters - Hispanic or Latino residents 1,297 56.9% Owner occupied983 43.1% Renter occupied
Language usage in East Lake-Orient Park
English speakers - Total 72.1% of residents of East Lake-Orient Park speak English at home.
15.2% of residents speak Spanish at home 2,820 65.9% Speak English very well1,458 34.1% Speak English less than very well13.2% of residents speak other language at home 2,010 54.0% Speak English very well1,711 46.0% Speak English less than very well
English speakers - Born in the United States 85.7% of residents of East Lake-Orient Park speak English at home.
13.5% of residents speak Spanish at home 785 84.4% Speak English very well145 15.6% Speak English less than very well0.7% of residents speak other language at home 48 100.0% Speak English very well
English speakers - Native, born elsewhere 17.3% of residents of East Lake-Orient Park speak English at home.
78.4% of residents speak Spanish at home 806 77.9% Speak English very well229 22.1% Speak English less than very well
English speakers - Foreign-born 13.8% of residents of East Lake-Orient Park speak English at home.
32.2% of residents speak Spanish at home 794 42.9% Speak English very well1,058 57.1% Speak English less than very well54.5% of residents speak other language at home 1,442 46.0% Speak English very well1,690 54.0% Speak English less than very well
White (Caucasian) - Speak only English Native:
88.4% (6,627)Foreign-born:
24.7% (127)
White (Caucasian) - Speak another language Native:
8.7% (650)Foreign-born:
72.9% (374)
Black or African American - Speak only English Native:
97.8% (10,391)Foreign-born:
36.7% (504)
Black or African American - Speak another language Native:
2.3% (247)Foreign-born:
63.4% (870)
Asian - Speak only English Native:
26.6% (37)Foreign-born:
0.5% (9)
Asian - Speak another language Native:
77.9% (109)Foreign-born:
99.1% (1,842)
Other race - Speak only English Native:
37.6% (308)Foreign-born:
2.2% (11)
Other race - Speak another language Native:
62.8% (515)Foreign-born:
98.8% (500)
Two or more races - Speak only English Native:
62.8% (2,412)Foreign-born:
12.2% (218)
Two or more races - Speak another language Native:
36.4% (1,400)Foreign-born:
85.7% (1,530)
White alone - Speak only English Native:
95.2% (5,946)Foreign-born:
8.9% (37)
White alone - Speak another language Native:
4.7% (291)Foreign-born:
88.2% (361)
Hispanic or Latino - Speak only English Native:
55.2% (2,669)Foreign-born:
11.2% (234)
Hispanic or Latino - Speak another language Native:
47.2% (2,285)Foreign-born:
88.1% (1,837)
Foreign-born residents in East Lake-Orient Park 5,648 residents are foreign born (9.4% Latin America , 7.3% Asia ).
This city:
18.7%Florida:
21.1%
Marital status for residents in East Lake-Orient Park Marital status - White (Caucasian) population 15 years and over
Males 40.7% Never married33.2% Now married5.8% Separated2.6% Widowed17.7% DivorcedFemales 32.5% Never married30.4% Now married3.5% Separated10.2% Widowed23.4% DivorcedWomen who gave birth in the past 12 months Now married:
38.3% (15)Unmarried:
61.7% (25)
Women who did not give birth in the past 12 months Now married:
31.7% (593)Unmarried:
68.3% (1,276)
Marital status - Black or African American population 15 years and over
Males 55.3% Never married28.4% Now married2.3% Separated2.4% Widowed11.7% DivorcedFemales 53.4% Never married19.2% Now married4.6% Separated5.7% Widowed17.0% DivorcedWomen who gave birth in the past 12 months Now married:
39.4% (64)Unmarried:
60.6% (99)
Women who did not give birth in the past 12 months Now married:
22.5% (664)Unmarried:
77.5% (2,287)
Marital status - American Indian / Alaska Native population 15 years and over
Males 100.0% Never married0.0% Now married0.0% Separated0.0% Widowed0.0% DivorcedFemales 0.0% Never married82.6% Now married0.0% Separated17.4% Widowed0.0% DivorcedMarital status - Asian population 15 years and over
Males 34.5% Never married58.4% Now married0.0% Separated0.0% Widowed7.0% DivorcedFemales 7.7% Never married72.3% Now married3.0% Separated10.4% Widowed6.6% DivorcedWomen who gave birth in the past 12 months Now married:
100.0% (18)Unmarried:
0.0% (0)
Women who did not give birth in the past 12 months Now married:
86.9% (574)Unmarried:
13.1% (87)
Marital status - Other race population 15 years and over
Males 50.9% Never married39.1% Now married4.7% Separated0.0% Widowed5.3% DivorcedFemales 20.2% Never married48.0% Now married0.0% Separated21.5% Widowed10.4% DivorcedWomen who gave birth in the past 12 months Now married:
100.0% (37)Unmarried:
0.0% (0)
Women who did not give birth in the past 12 months Now married:
62.3% (188)Unmarried:
37.7% (114)
Marital status - Two or more races population 15 years and over
Males 49.8% Never married32.1% Now married0.0% Separated0.0% Widowed18.0% DivorcedFemales 55.9% Never married31.3% Now married0.0% Separated5.1% Widowed7.7% DivorcedWomen who did not give birth in the past 12 months Now married:
33.1% (568)Unmarried:
66.9% (1,147)
Marital status - White alone, not Hispanic / Latino population 15 years and over
Males 41.8% Never married32.4% Now married6.6% Separated3.4% Widowed15.8% DivorcedFemales 34.4% Never married32.4% Now married0.0% Separated10.7% Widowed22.4% DivorcedWomen who gave birth in the past 12 months Now married:
38.3% (18)Unmarried:
61.7% (29)
Women who did not give birth in the past 12 months Now married:
27.6% (437)Unmarried:
72.4% (1,147)
Marital status - Hispanic or Latino population 15 years and over
Males 46.0% Never married34.4% Now married2.4% Separated0.0% Widowed17.3% DivorcedFemales 38.9% Never married32.4% Now married5.1% Separated9.0% Widowed14.6% DivorcedWomen who gave birth in the past 12 months Now married:
52.9% (28)Unmarried:
47.1% (25)
Women who did not give birth in the past 12 months Now married:
43.6% (794)Unmarried:
56.4% (1,027)
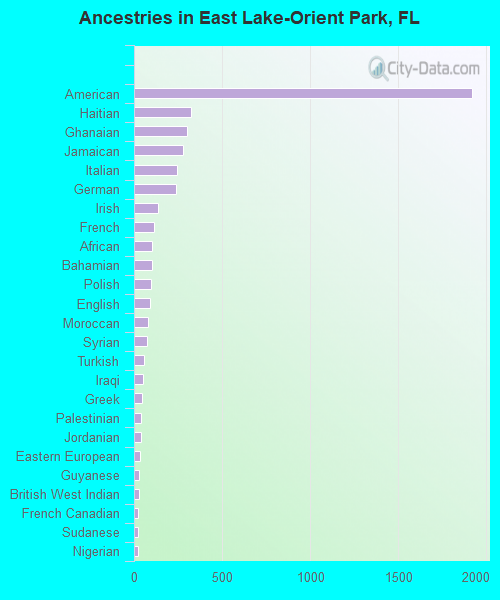
Ancestries in East Lake-Orient Park
1,920 9.2% American326 1.6% Haitian299 1.4% Ghanaian279 1.3% Jamaican247 1.2% Italian238 1.1% German139 0.7% Irish114 0.5% French102 0.5% African100 0.5% Bahamian95 0.5% Polish93 0.4% English82 0.4% Moroccan73 0.3% Syrian54 0.3% Turkish50 0.2% Iraqi45 0.2% Greek42 0.2% Palestinian39 0.2% Jordanian35 0.2% Eastern European27 0.1% Guyanese26 0.1% British West Indian24 0.1% French Canadian24 0.1% Sudanese21 0.1% Nigerian14 0.07% Albanian13 0.06% Scottish13 0.06% Danish11 0.05% Norwegian11 0.05% Pennsylvania German11 0.05% Celtic10 0.05% Czechoslovakian9 0.04% Scotch-Irish8 0.04% Lithuanian8 0.04% Dutch6 0.03% Canadian3 0.01% European
Geographical mobility in East Lake-Orient Park Same house 1 year ago 7,283 88.6% White (Caucasian)10,334 80.2% Black or African American57 100.0% American Indian / Alaska Native1,772 81.2% Asian1,114 78.7% Other race4,167 66.0% Two or more races5,801 86.1% White alone, not Hispanic / Latino6,015 79.2% Hispanic or LatinoMoved within same county 580 7.1% White / Caucasian1,750 13.6% Black or African American124 5.7% Asian197 13.9% Other race1,698 26.9% Two or more races538 8.0% White alone, not Hispanic / Latino1,162 15.3% Hispanic or LatinoMoved within same state 149 1.8% White / Caucasian330 2.6% Black or African American78 5.5% Other race115 1.8% Two or more races172 2.6% White alone, not Hispanic / Latino124 1.6% Hispanic or LatinoMoved from different state 161 2.0% White / Caucasian57 0.4% Black or African American45 2.1% Asian46 0.7% Two or more races172 2.6% White alone, not Hispanic / Latino1 0.0% Hispanic or LatinoMoved from abroad 17 0.2% White23 0.2% Black or African American226 10.4% Asian58 0.9% Two or more races5 0.1% White alone, not Hispanic / Latino88 1.2% Hispanic or Latino
Children Nativity (place of birth) in East Lake-Orient Park
Children under 6 years - Living with two parents Both parents native 410 100.0% NativeBoth parents foreign-born 342 81.4% Native78 18.6% Foreign-bornOne native, one foreign-born parent 116 100.0% NativeChildren under 6 years - Living with one parent Native parent 1,032 100.0% NativeForeign-born parent 154 74.1% Native54 25.9% Foreign-bornChildren 6 to 17 years - Living with two parents Both parents native 1,353 100.0% NativeBoth parents foreign-born 404 59.8% Native272 40.2% Foreign-bornOne native, one foreign-born parent 185 93.9% Native12 6.1% Foreign-bornChildren 6 to 17 years - Living with one parent Native parent 1,810 100.0% NativeForeign-born parent 355 64.1% Native199 35.9% Foreign-born
Grandparents responsible for own grandchildren in East Lake-Orient Park
Grandparents (30 to 59 years) White / Caucasian 2 2.4% Responsible for grandchildren75 97.6% Not responsible for grandchildrenBlack or African American 60 100.0% Responsible for grandchildrenAsian 72 100.0% Responsible for grandchildrenWhite alone, not Hispanic / Latino 14 100.0% Not responsible for grandchildrenHispanic or Latino 4 7.2% Responsible for grandchildren56 92.8% Not responsible for grandchildrenGrandparents (60 years and over) White / Caucasian 88 68.3% Responsible for grandchildren41 31.7% Not responsible for grandchildrenBlack or African American 50 55.6% Responsible for grandchildren40 44.4% Not responsible for grandchildrenAsian 23 100.0% Not responsible for grandchildrenWhite alone, not Hispanic / Latino 19 28.3% Responsible for grandchildren49 71.7% Not responsible for grandchildrenHispanic or Latino 32 25.7% Responsible for grandchildren91 74.3% Not responsible for grandchildren