Races in East Haven, Connecticut (CT) Detailed Stats
Data:
Races - White alone (%)
Races - White alone (% change since 2000)
Races - Black alone (%)
Races - Black alone (% change since 2000)
Races - American Indian alone (%)
Races - American Indian alone (% change since 2000)
Races - Asian alone (%)
Races - Asian alone (% change since 2000)
Races - Hispanic (%)
Races - Hispanic (% change since 2000)
Races - Native Hawaiian and Other Pacific Islander alone (%)
Races - Native Hawaiian and Other Pacific Islander alone (% change since 2000)
Races - Two or more races(%)
Races - Two or more races(% change since 2000)
Races - Other race alone (%)
Races - Other race alone (% change since 2000)
Racial diversity
Place of birth - Born in state of residence (%)
Place of birth - Born in state of residence (%) - White
Place of birth - Born in state of residence (%) - Black or African American
Place of birth - Born in state of residence (%) - Asian
Place of birth - Born in state of residence (%) - Hispanic or Latino
Place of birth - Born in state of residence (%) - American Indian and Alaska Native
Place of birth - Born in state of residence (%) - Multirace
Place of birth - Born in state of residence (%) - Other Race
Place of birth - Born in other state (%)
Place of birth - Born in other state (%) - White
Place of birth - Born in other state (%) - Black or African American
Place of birth - Born in other state (%) - Asian
Place of birth - Born in other state (%) - Hispanic or Latino
Place of birth - Born in other state (%) - American Indian and Alaska Native
Place of birth - Born in other state (%) - Multirace
Place of birth - Born in other state (%) - Other Race
Place of birth - Native, outside of US (%)
Place of birth - Native, outside of US (%) - White
Place of birth - Native, outside of US (%) - Black or African American
Place of birth - Native, outside of US (%) - Asian
Place of birth - Native, outside of US (%) - Hispanic or Latino
Place of birth - Native, outside of US (%) - American Indian and Alaska Native
Place of birth - Native, outside of US (%) - Multirace
Place of birth - Native, outside of US (%) - Other Race
Place of birth - Foreign born (%)
Place of birth - Foreign born (%) - White
Place of birth - Foreign born (%) - Black or African American
Place of birth - Foreign born (%) - Asian
Place of birth - Foreign born (%) - Hispanic or Latino
Place of birth - Foreign born (%) - American Indian and Alaska Native
Place of birth - Foreign born (%) - Multirace
Place of birth - Foreign born (%) - Other Race
Residents speaking English at home (%)
Residents speaking English at home - Born in the United States (%)
Residents speaking English at home - Native, born elsewhere (%)
Residents speaking English at home - Foreign born (%)
Residents speaking Spanish at home (%)
Residents speaking Spanish at home - Born in the United States (%)
Residents speaking Spanish at home - Native, born elsewhere (%)
Residents speaking Spanish at home - Foreign born (%)
Residents speaking other language at home (%)
Residents speaking other language at home - Born in the United States (%)
Residents speaking other language at home - Native, born elsewhere (%)
Residents speaking other language at home - Foreign born (%)
Marital status - Never married (%)
Marital status - Now married (%)
Marital status - Separated (%)
Marital status - Widowed (%)
Marital status - Divorced (%)
Ancestries Reported - Arab (%)
Ancestries Reported - Czech (%)
Ancestries Reported - Danish (%)
Ancestries Reported - Dutch (%)
Ancestries Reported - English (%)
Ancestries Reported - French (%)
Ancestries Reported - French Canadian (%)
Ancestries Reported - German (%)
Ancestries Reported - Greek (%)
Ancestries Reported - Hungarian (%)
Ancestries Reported - Irish (%)
Ancestries Reported - Italian (%)
Ancestries Reported - Lithuanian (%)
Ancestries Reported - Norwegian (%)
Ancestries Reported - Polish (%)
Ancestries Reported - Portuguese (%)
Ancestries Reported - Russian (%)
Ancestries Reported - Scotch-Irish (%)
Ancestries Reported - Scottish (%)
Ancestries Reported - Slovak (%)
Ancestries Reported - Subsaharan African (%)
Ancestries Reported - Swedish (%)
Ancestries Reported - Swiss (%)
Ancestries Reported - Ukrainian (%)
Ancestries Reported - United States (%)
Ancestries Reported - Welsh (%)
Ancestries Reported - West Indian (%)
Ancestries Reported - Other (%)
Geographical mobility - Same house 1 year ago (%)
Geographical mobility - Same house 1 year ago (%) - White
Geographical mobility - Same house 1 year ago (%) - Black or African American
Geographical mobility - Same house 1 year ago (%) - Asian
Geographical mobility - Same house 1 year ago (%) - Hispanic or Latino
Geographical mobility - Same house 1 year ago (%) - American Indian and Alaska Native
Geographical mobility - Same house 1 year ago (%) - Multirace
Geographical mobility - Same house 1 year ago (%) - Other Race
Geographical mobility - Moved within same county (%)
Geographical mobility - Moved within same county (%) - White
Geographical mobility - Moved within same county (%) - Black or African American
Geographical mobility - Moved within same county (%) - Asian
Geographical mobility - Moved within same county (%) - Hispanic or Latino
Geographical mobility - Moved within same county (%) - American Indian and Alaska Native
Geographical mobility - Moved within same county (%) - Multirace
Geographical mobility - Moved within same county (%) - Other Race
Geographical mobility - Moved from different county within same state (%)
Geographical mobility - Moved from different county within same state (%) - White
Geographical mobility - Moved from different county within same state (%) - Black or African American
Geographical mobility - Moved from different county within same state (%) - Asian
Geographical mobility - Moved from different county within same state (%) - Hispanic or Latino
Geographical mobility - Moved from different county within same state (%) - American Indian and Alaska Native
Geographical mobility - Moved from different county within same state (%) - Multirace
Geographical mobility - Moved from different county within same state (%) - Other Race
Geographical mobility - Moved from different state (%)
Geographical mobility - Moved from different state (%) - White
Geographical mobility - Moved from different state (%) - Black or African American
Geographical mobility - Moved from different state (%) - Asian
Geographical mobility - Moved from different state (%) - Hispanic or Latino
Geographical mobility - Moved from different state (%) - American Indian and Alaska Native
Geographical mobility - Moved from different state (%) - Multirace
Geographical mobility - Moved from different state (%) - Other Race
Geographical mobility - Moved from abroad (%)
Geographical mobility - Moved from abroad (%) - White
Geographical mobility - Moved from abroad (%) - Black or African American
Geographical mobility - Moved from abroad (%) - Asian
Geographical mobility - Moved from abroad (%) - Hispanic or Latino
Geographical mobility - Moved from abroad (%) - American Indian and Alaska Native
Geographical mobility - Moved from abroad (%) - Multirace
Geographical mobility - Moved from abroad (%) - Other Race
Place of birth for the foreign-born population - Ireland (%)
Place of birth for the foreign-born population - Denmark (%)
Place of birth for the foreign-born population - Norway (%)
Place of birth for the foreign-born population - Sweden (%)
Place of birth for the foreign-born population - United Kingdom (%)
Place of birth for the foreign-born population - England (%)
Place of birth for the foreign-born population - Scotland (%)
Place of birth for the foreign-born population - Other Northern Europe (%)
Place of birth for the foreign-born population - Austria (%)
Place of birth for the foreign-born population - Belgium (%)
Place of birth for the foreign-born population - France (%)
Place of birth for the foreign-born population - Germany (%)
Place of birth for the foreign-born population - Netherlands (%)
Place of birth for the foreign-born population - Switzerland (%)
Place of birth for the foreign-born population - Other Western Europe (%)
Place of birth for the foreign-born population - Greece (%)
Place of birth for the foreign-born population - Italy (%)
Place of birth for the foreign-born population - Portugal (%)
Place of birth for the foreign-born population - Spain (%)
Place of birth for the foreign-born population - Other Southern Europe (%)
Place of birth for the foreign-born population - Albania (%)
Place of birth for the foreign-born population - Belarus (%)
Place of birth for the foreign-born population - Bosnia and Herzegovina (%)
Place of birth for the foreign-born population - Bulgaria (%)
Place of birth for the foreign-born population - Croatia (%)
Place of birth for the foreign-born population - Czechoslovakia (%)
Place of birth for the foreign-born population - Hungary (%)
Place of birth for the foreign-born population - Latvia (%)
Place of birth for the foreign-born population - Lithuania (%)
Place of birth for the foreign-born population - North Macedonia (Macedonia) (%)
Place of birth for the foreign-born population - Moldova (%)
Place of birth for the foreign-born population - Poland (%)
Place of birth for the foreign-born population - Romania (%)
Place of birth for the foreign-born population - Russia (%)
Place of birth for the foreign-born population - Serbia (%)
Place of birth for the foreign-born population - Ukraine (%)
Place of birth for the foreign-born population - Other Eastern Europe (%)
Place of birth for the foreign-born population - China (%)
Place of birth for the foreign-born population - Hong Kong (%)
Place of birth for the foreign-born population - Taiwan (%)
Place of birth for the foreign-born population - Japan (%)
Place of birth for the foreign-born population - Korea (%)
Place of birth for the foreign-born population - Other Eastern Asia (%)
Place of birth for the foreign-born population - Afghanistan (%)
Place of birth for the foreign-born population - Bangladesh (%)
Place of birth for the foreign-born population - India (%)
Place of birth for the foreign-born population - Iran (%)
Place of birth for the foreign-born population - Kazakhstan (%)
Place of birth for the foreign-born population - Nepal (%)
Place of birth for the foreign-born population - Pakistan (%)
Place of birth for the foreign-born population - Sri Lanka (%)
Place of birth for the foreign-born population - Uzbekistan (%)
Place of birth for the foreign-born population - Other South Central Asia (%)
Place of birth for the foreign-born population - Burma (%)
Place of birth for the foreign-born population - Cambodia (%)
Place of birth for the foreign-born population - Indonesia (%)
Place of birth for the foreign-born population - Laos (%)
Place of birth for the foreign-born population - Malaysia (%)
Place of birth for the foreign-born population - Philippines (%)
Place of birth for the foreign-born population - Singapore (%)
Place of birth for the foreign-born population - Thailand (%)
Place of birth for the foreign-born population - Vietnam (%)
Place of birth for the foreign-born population - Other South Eastern Asia (%)
Place of birth for the foreign-born population - Armenia (%)
Place of birth for the foreign-born population - Iraq (%)
Place of birth for the foreign-born population - Israel (%)
Place of birth for the foreign-born population - Jordan (%)
Place of birth for the foreign-born population - Kuwait (%)
Place of birth for the foreign-born population - Lebanon (%)
Place of birth for the foreign-born population - Saudi Arabia (%)
Place of birth for the foreign-born population - Syria (%)
Place of birth for the foreign-born population - Turkey (%)
Place of birth for the foreign-born population - Yemen (%)
Place of birth for the foreign-born population - Other Western Asia (%)
Place of birth for the foreign-born population - Eritrea (%)
Place of birth for the foreign-born population - Ethiopia (%)
Place of birth for the foreign-born population - Kenya (%)
Place of birth for the foreign-born population - Somalia (%)
Place of birth for the foreign-born population - Uganda (%)
Place of birth for the foreign-born population - Zimbabwe (%)
Place of birth for the foreign-born population - Other Eastern Africa (%)
Place of birth for the foreign-born population - Cameroon (%)
Place of birth for the foreign-born population - Congo (%)
Place of birth for the foreign-born population - Democratic Republic of Congo (Zaire) (%)
Place of birth for the foreign-born population - Other Middle Africa (%)
Place of birth for the foreign-born population - Egypt (%)
Place of birth for the foreign-born population - Morocco (%)
Place of birth for the foreign-born population - Sudan (%)
Place of birth for the foreign-born population - Other Northern Africa (%)
Place of birth for the foreign-born population - South Africa (%)
Place of birth for the foreign-born population - Other Southern Africa (%)
Place of birth for the foreign-born population - Cabo Verde (%)
Place of birth for the foreign-born population - Ghana (%)
Place of birth for the foreign-born population - Liberia (%)
Place of birth for the foreign-born population - Nigeria (%)
Place of birth for the foreign-born population - Senegal (%)
Place of birth for the foreign-born population - Sierra Leone (%)
Place of birth for the foreign-born population - Other Western Africa (%)
Place of birth for the foreign-born population - Australia (%)
Place of birth for the foreign-born population - New Zealand (%)
Place of birth for the foreign-born population - Fiji (%)
Place of birth for the foreign-born population - Micronesia (%)
Place of birth for the foreign-born population - Bahamas (%)
Place of birth for the foreign-born population - Barbados (%)
Place of birth for the foreign-born population - Cuba (%)
Place of birth for the foreign-born population - Dominica (%)
Place of birth for the foreign-born population - Dominican Republic (%)
Place of birth for the foreign-born population - Grenada (%)
Place of birth for the foreign-born population - Haiti (%)
Place of birth for the foreign-born population - Jamaica (%)
Place of birth for the foreign-born population - St. Vincent and the Grenadines (%)
Place of birth for the foreign-born population - Trinidad and Tobago (%)
Place of birth for the foreign-born population - West Indies (%)
Place of birth for the foreign-born population - Other Caribbean (%)
Place of birth for the foreign-born population - Belize (%)
Place of birth for the foreign-born population - Costa Rica (%)
Place of birth for the foreign-born population - El Salvador (%)
Place of birth for the foreign-born population - Guatemala (%)
Place of birth for the foreign-born population - Honduras (%)
Place of birth for the foreign-born population - Mexico (%)
Place of birth for the foreign-born population - Nicaragua (%)
Place of birth for the foreign-born population - Panama (%)
Place of birth for the foreign-born population - Other Central America (%)
Place of birth for the foreign-born population - Argentina (%)
Place of birth for the foreign-born population - Bolivia (%)
Place of birth for the foreign-born population - Brazil (%)
Place of birth for the foreign-born population - Chile (%)
Place of birth for the foreign-born population - Colombia (%)
Place of birth for the foreign-born population - Ecuador (%)
Place of birth for the foreign-born population - Guyana (%)
Place of birth for the foreign-born population - Peru (%)
Place of birth for the foreign-born population - Uruguay (%)
Place of birth for the foreign-born population - Venezuela (%)
Place of birth for the foreign-born population - Other South America (%)
Place of birth for the foreign-born population - Canada (%)
Place of birth for the foreign-born population - Other Northern America (%)
Place of birth for the foreign-born population - Other (%)
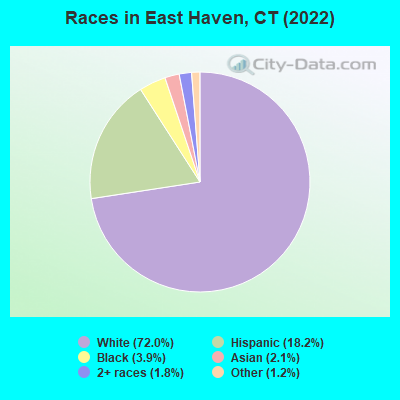
According to 2022 data, the most numerous races in East Haven, CT are White alone (20,156 residents), Hispanic (5,100 residents), and Black alone (1,083 residents). 81.5% of East Haven residents speak English at home. 10.9% of East Haven, CT residents are foreign-born (5.5% born in Latin America, 2.7% born in Europe, 2.0% born in Asia), which is 37.5% less than the foreign-born rate of 15.0% across the entire state of Connecticut.
Race distribution in East Haven
2000 2022
2,638,845 77.5% White alone 320,323 9.4% Hispanic 295,571 8.7% Black alone 81,564 2.4% Asian alone 52,896 1.6% Two or more races 8,141 0.2% Other race alone 7,267 0.2% American Indian alone 958 0.03% Native Hawaiian and Other
2,246,913 62.0% White alone 658,978 18.2% Hispanic 353,973 9.8% Black alone 172,929 4.8% Asian alone 159,631 4.4% Two or more races 29,761 0.8% Other race alone 3,428 0.09% American Indian alone 592 0.02% Native Hawaiian and Other
Income and house value in East Haven Median household income in 2022 $82,009 White non-Hispanic householders$129,521 Asian householders$68,950 Some other race householders$56,991 Two or more races householders$68,279 Hispanic or Latino race householdersMedian 2022 house value $287,522 White Non-Hispanic householders$248,540 Black or African American householders $276,256 Asian householders$256,427 Some other race householders$273,552 Two or more races householders$259,581 Hispanic or Latino householders
Median age by race in East Haven
50.7 Median age for White residents47.8 52.8 35.5 Median age for Black or African American residents35.4 35.6 59.2 Median age for American Indian / Alaska Native residents31.2 -704,477,611.2 48.5 Median age for Asian residents37.3 49.7 -641,269,840.6 Median age for Native Hawaiian / Pacific Islander residents-414,239,481.8 -691,588,784.4 32.7 Median age for Other race residents31.7 33.9 36.5 Median age for Two or more races residents37.3 28.8 51.1 Median age for White alone residents49.4 53.3 32.0 Median age for Hispanic or Latino residents32.2 31.4
Owner/renter occupied households by race in East Haven
House owners and renters - White residents 6,947 78.8% Owner occupied1,870 21.2% Renter occupiedHouse owners and renters - Black or African American residents 394 67.8% Owner occupied187 32.2% Renter occupiedHouse owners and renters - American Indian / Alaska Native residents 6 100.0% Owner occupiedHouse owners and renters - Asian residents 157 82.0% Owner occupied34 18.0% Renter occupiedHouse owners and renters - Native Hawaiian / Pacific Islander residents 3 100.0% Renter occupiedHouse owners and renters - Other race residents 549 57.8% Owner occupied401 42.2% Renter occupiedHouse owners and renters - Two or more races residents 386 64.2% Owner occupied215 35.8% Renter occupiedHouse owners and renters - White alone residents 6,789 78.0% Owner occupied1,909 22.0% Renter occupiedHouse owners and renters - Hispanic or Latino residents 993 61.7% Owner occupied618 38.3% Renter occupied
Language usage in East Haven
English speakers - Total 81.5% of residents of East Haven speak English at home.
11.3% of residents speak Spanish at home 1,990 65.4% Speak English very well1,055 34.6% Speak English less than very well6.9% of residents speak other language at home 1,053 56.5% Speak English very well812 43.5% Speak English less than very well
English speakers - Born in the United States 88.1% of residents of East Haven speak English at home.
10.3% of residents speak Spanish at home 372 94.9% Speak English very well20 5.1% Speak English less than very well1.9% of residents speak other language at home 71 100.0% Speak English very well
English speakers - Native, born elsewhere 20.6% of residents of East Haven speak English at home.
65.3% of residents speak Spanish at home 354 70.4% Speak English very well149 29.6% Speak English less than very well13.9% of residents speak other language at home 37 34.6% Speak English very well70 65.4% Speak English less than very well
English speakers - Foreign-born 19.5% of residents of East Haven speak English at home.
41.9% of residents speak Spanish at home 419 33.8% Speak English very well819 66.2% Speak English less than very well38.6% of residents speak other language at home 443 38.9% Speak English very well697 61.1% Speak English less than very well
White (Caucasian) - Speak only English Native:
97.0% (18,482)Foreign-born:
24.4% (214)
White (Caucasian) - Speak another language Native:
3.6% (692)Foreign-born:
74.4% (653)
Black or African American - Speak only English Native:
91.1% (1,141)Foreign-born:
32.2% (27)
Black or African American - Speak another language Native:
9.0% (112)Foreign-born:
59.4% (50)
American Indian / Alaska Native - Speak another language Native:
100.0% (4)Foreign-born:
92.6% (21)
Asian - Speak only English Native:
23.6% (36)Foreign-born:
15.5% (69)
Asian - Speak another language Native:
74.8% (113)Foreign-born:
84.5% (376)
Other race - Speak only English Native:
36.5% (734)Foreign-born:
6.9% (63)
Other race - Speak another language Native:
63.7% (1,280)Foreign-born:
93.0% (852)
Two or more races - Speak only English Native:
72.2% (861)Foreign-born:
23.0% (168)
Two or more races - Speak another language Native:
26.1% (311)Foreign-born:
68.4% (499)
White alone - Speak only English Native:
97.2% (18,259)Foreign-born:
27.4% (219)
White alone - Speak another language Native:
2.8% (521)Foreign-born:
72.4% (578)
Hispanic or Latino - Speak only English Native:
49.2% (1,631)Foreign-born:
12.6% (182)
Hispanic or Latino - Speak another language Native:
51.3% (1,700)Foreign-born:
86.0% (1,239)
Foreign-born residents in East Haven 3,054 residents are foreign born (5.5% Latin America , 2.7% Europe , 2.0% Asia ).
This city:
10.9%Connecticut:
15.0%
Marital status for residents in East Haven Marital status - White (Caucasian) population 15 years and over
Males 42.9% Never married42.1% Now married0.4% Separated3.4% Widowed11.2% DivorcedFemales 30.2% Never married42.3% Now married1.9% Separated10.8% Widowed14.8% DivorcedWomen who gave birth in the past 12 months Now married:
59.7% (37)Unmarried:
40.3% (25)
Women who did not give birth in the past 12 months Now married:
39.0% (1,484)Unmarried:
61.0% (2,318)
Marital status - Black or African American population 15 years and over
Males 46.8% Never married48.2% Now married0.5% Separated2.6% Widowed1.9% DivorcedFemales 60.4% Never married27.5% Now married6.2% Separated1.0% Widowed4.9% DivorcedWomen who gave birth in the past 12 months Now married:
0.0% (0)Unmarried:
100.0% (22)
Women who did not give birth in the past 12 months Now married:
30.9% (151)Unmarried:
69.1% (337)
Marital status - American Indian / Alaska Native population 15 years and over
Males 60.0% Never married40.0% Now married0.0% Separated0.0% Widowed0.0% DivorcedFemales 0.0% Never married100.0% Now married0.0% Separated0.0% Widowed0.0% DivorcedMarital status - Asian population 15 years and over
Males 36.9% Never married59.0% Now married0.0% Separated0.0% Widowed4.0% DivorcedFemales 20.1% Never married68.7% Now married0.0% Separated8.5% Widowed2.8% DivorcedWomen who did not give birth in the past 12 months Now married:
64.4% (94)Unmarried:
35.6% (52)
Marital status - Other race population 15 years and over
Males 38.1% Never married40.9% Now married0.0% Separated0.0% Widowed21.0% DivorcedFemales 58.1% Never married35.4% Now married4.4% Separated1.2% Widowed0.9% DivorcedWomen who gave birth in the past 12 months Now married:
0.0% (0)Unmarried:
100.0% (11)
Women who did not give birth in the past 12 months Now married:
24.4% (206)Unmarried:
75.6% (637)
Marital status - Two or more races population 15 years and over
Males 17.5% Never married76.8% Now married0.0% Separated0.0% Widowed5.8% DivorcedFemales 63.7% Never married20.5% Now married4.2% Separated7.7% Widowed3.9% DivorcedWomen who gave birth in the past 12 months Now married:
0.0% (0)Unmarried:
100.0% (11)
Women who did not give birth in the past 12 months Now married:
26.8% (196)Unmarried:
73.2% (535)
Marital status - White alone, not Hispanic / Latino population 15 years and over
Males 41.9% Never married42.6% Now married0.5% Separated3.5% Widowed11.6% DivorcedFemales 29.3% Never married42.7% Now married1.8% Separated10.9% Widowed15.3% DivorcedWomen who gave birth in the past 12 months Now married:
56.5% (34)Unmarried:
43.5% (26)
Women who did not give birth in the past 12 months Now married:
39.0% (1,422)Unmarried:
61.0% (2,224)
Marital status - Hispanic or Latino population 15 years and over
Males 39.4% Never married47.0% Now married0.0% Separated0.0% Widowed13.6% DivorcedFemales 55.5% Never married32.4% Now married5.6% Separated3.0% Widowed3.5% DivorcedWomen who gave birth in the past 12 months Now married:
35.7% (5)Unmarried:
64.3% (9)
Women who did not give birth in the past 12 months Now married:
31.7% (490)Unmarried:
68.3% (1,057)
Ancestries in East Haven
5,726 39.9% Italian1,420 9.9% Irish488 3.4% English461 3.2% Polish399 2.8% American375 2.6% German265 1.8% Brazilian219 1.5% European83 0.6% Portuguese74 0.5% Scottish74 0.5% French Canadian69 0.5% Ukrainian59 0.4% Greek58 0.4% Turkish57 0.4% Barbadian55 0.4% Jamaican52 0.4% Arab36 0.3% Eastern European33 0.2% Dutch26 0.2% French24 0.2% Welsh23 0.2% Czechoslovakian22 0.2% Swedish22 0.2% Albanian19 0.1% Egyptian18 0.1% Nigerian18 0.1% Danish17 0.1% Lithuanian17 0.1% Hungarian16 0.1% Palestinian14 0.10% Scandinavian14 0.10% Norwegian13 0.09% Syrian12 0.08% African7 0.05% Slovak5 0.03% Canadian4 0.03% Czech2 0.01% Scotch-Irish
Geographical mobility in East Haven Same house 1 year ago 18,972 92.8% White (Caucasian)1,297 91.1% Black or African American22 94.8% American Indian / Alaska Native539 91.0% Asian3 100.0% Native Hawaiian / Pacific Islander2,652 89.5% Other race2,116 97.9% Two or more races18,662 92.7% White alone, not Hispanic / Latino4,684 92.4% Hispanic or LatinoMoved within same county 932 4.6% White / Caucasian74 5.2% Black or African American29 4.8% Asian224 7.6% Other race51 2.4% Two or more races932 4.6% White alone, not Hispanic / Latino308 6.1% Hispanic or LatinoMoved within same state 162 0.8% White / Caucasian6 0.9% Asian25 0.8% Other race164 0.8% White alone, not Hispanic / Latino38 0.8% Hispanic or LatinoMoved from different state 214 1.0% White / Caucasian30 2.1% Black or African American9 1.6% Asian41 1.4% Other race219 1.1% White alone, not Hispanic / Latino34 0.7% Hispanic or Latino
Children Nativity (place of birth) in East Haven
Children under 6 years - Living with two parents Both parents native 613 100.0% NativeBoth parents foreign-born 12 100.0% NativeOne native, one foreign-born parent 43 100.0% NativeChildren under 6 years - Living with one parent Native parent 223 100.0% NativeForeign-born parent 44 22.3% Native154 77.7% Foreign-bornChildren 6 to 17 years - Living with two parents Both parents native 1,159 98.5% Native18 1.5% Foreign-bornBoth parents foreign-born 468 99.6% Native2 0.4% Foreign-bornOne native, one foreign-born parent 199 100.0% NativeChildren 6 to 17 years - Living with one parent Native parent 1,469 100.0% NativeForeign-born parent 91 50.8% Native88 49.2% Foreign-born
Grandparents responsible for own grandchildren in East Haven
Grandparents (30 to 59 years) White / Caucasian 42 52.6% Responsible for grandchildren38 47.4% Not responsible for grandchildrenAsian 5 100.0% Not responsible for grandchildrenOther race 44 53.2% Responsible for grandchildren39 46.8% Not responsible for grandchildrenWhite alone, not Hispanic / Latino 48 48.4% Responsible for grandchildren51 51.6% Not responsible for grandchildrenHispanic or Latino 88 76.2% Responsible for grandchildren27 23.8% Not responsible for grandchildrenGrandparents (60 years and over) White / Caucasian 39 9.3% Responsible for grandchildren380 90.7% Not responsible for grandchildrenAsian 18 100.0% Not responsible for grandchildrenOther race 9 100.0% Not responsible for grandchildrenWhite alone, not Hispanic / Latino 41 9.7% Responsible for grandchildren385 90.3% Not responsible for grandchildrenHispanic or Latino 25 100.0% Not responsible for grandchildren