Races in East Grand Forks, Minnesota (MN) Detailed Stats
Data:
Races - White alone (%)
Races - White alone (% change since 2000)
Races - Black alone (%)
Races - Black alone (% change since 2000)
Races - American Indian alone (%)
Races - American Indian alone (% change since 2000)
Races - Asian alone (%)
Races - Asian alone (% change since 2000)
Races - Hispanic (%)
Races - Hispanic (% change since 2000)
Races - Native Hawaiian and Other Pacific Islander alone (%)
Races - Native Hawaiian and Other Pacific Islander alone (% change since 2000)
Races - Two or more races(%)
Races - Two or more races(% change since 2000)
Races - Other race alone (%)
Races - Other race alone (% change since 2000)
Racial diversity
Place of birth - Born in state of residence (%)
Place of birth - Born in state of residence (%) - White
Place of birth - Born in state of residence (%) - Black or African American
Place of birth - Born in state of residence (%) - Asian
Place of birth - Born in state of residence (%) - Hispanic or Latino
Place of birth - Born in state of residence (%) - American Indian and Alaska Native
Place of birth - Born in state of residence (%) - Multirace
Place of birth - Born in state of residence (%) - Other Race
Place of birth - Born in other state (%)
Place of birth - Born in other state (%) - White
Place of birth - Born in other state (%) - Black or African American
Place of birth - Born in other state (%) - Asian
Place of birth - Born in other state (%) - Hispanic or Latino
Place of birth - Born in other state (%) - American Indian and Alaska Native
Place of birth - Born in other state (%) - Multirace
Place of birth - Born in other state (%) - Other Race
Place of birth - Native, outside of US (%)
Place of birth - Native, outside of US (%) - White
Place of birth - Native, outside of US (%) - Black or African American
Place of birth - Native, outside of US (%) - Asian
Place of birth - Native, outside of US (%) - Hispanic or Latino
Place of birth - Native, outside of US (%) - American Indian and Alaska Native
Place of birth - Native, outside of US (%) - Multirace
Place of birth - Native, outside of US (%) - Other Race
Place of birth - Foreign born (%)
Place of birth - Foreign born (%) - White
Place of birth - Foreign born (%) - Black or African American
Place of birth - Foreign born (%) - Asian
Place of birth - Foreign born (%) - Hispanic or Latino
Place of birth - Foreign born (%) - American Indian and Alaska Native
Place of birth - Foreign born (%) - Multirace
Place of birth - Foreign born (%) - Other Race
Residents speaking English at home (%)
Residents speaking English at home - Born in the United States (%)
Residents speaking English at home - Native, born elsewhere (%)
Residents speaking English at home - Foreign born (%)
Residents speaking Spanish at home (%)
Residents speaking Spanish at home - Born in the United States (%)
Residents speaking Spanish at home - Native, born elsewhere (%)
Residents speaking Spanish at home - Foreign born (%)
Residents speaking other language at home (%)
Residents speaking other language at home - Born in the United States (%)
Residents speaking other language at home - Native, born elsewhere (%)
Residents speaking other language at home - Foreign born (%)
Marital status - Never married (%)
Marital status - Now married (%)
Marital status - Separated (%)
Marital status - Widowed (%)
Marital status - Divorced (%)
Ancestries Reported - Arab (%)
Ancestries Reported - Czech (%)
Ancestries Reported - Danish (%)
Ancestries Reported - Dutch (%)
Ancestries Reported - English (%)
Ancestries Reported - French (%)
Ancestries Reported - French Canadian (%)
Ancestries Reported - German (%)
Ancestries Reported - Greek (%)
Ancestries Reported - Hungarian (%)
Ancestries Reported - Irish (%)
Ancestries Reported - Italian (%)
Ancestries Reported - Lithuanian (%)
Ancestries Reported - Norwegian (%)
Ancestries Reported - Polish (%)
Ancestries Reported - Portuguese (%)
Ancestries Reported - Russian (%)
Ancestries Reported - Scotch-Irish (%)
Ancestries Reported - Scottish (%)
Ancestries Reported - Slovak (%)
Ancestries Reported - Subsaharan African (%)
Ancestries Reported - Swedish (%)
Ancestries Reported - Swiss (%)
Ancestries Reported - Ukrainian (%)
Ancestries Reported - United States (%)
Ancestries Reported - Welsh (%)
Ancestries Reported - West Indian (%)
Ancestries Reported - Other (%)
Geographical mobility - Same house 1 year ago (%)
Geographical mobility - Same house 1 year ago (%) - White
Geographical mobility - Same house 1 year ago (%) - Black or African American
Geographical mobility - Same house 1 year ago (%) - Asian
Geographical mobility - Same house 1 year ago (%) - Hispanic or Latino
Geographical mobility - Same house 1 year ago (%) - American Indian and Alaska Native
Geographical mobility - Same house 1 year ago (%) - Multirace
Geographical mobility - Same house 1 year ago (%) - Other Race
Geographical mobility - Moved within same county (%)
Geographical mobility - Moved within same county (%) - White
Geographical mobility - Moved within same county (%) - Black or African American
Geographical mobility - Moved within same county (%) - Asian
Geographical mobility - Moved within same county (%) - Hispanic or Latino
Geographical mobility - Moved within same county (%) - American Indian and Alaska Native
Geographical mobility - Moved within same county (%) - Multirace
Geographical mobility - Moved within same county (%) - Other Race
Geographical mobility - Moved from different county within same state (%)
Geographical mobility - Moved from different county within same state (%) - White
Geographical mobility - Moved from different county within same state (%) - Black or African American
Geographical mobility - Moved from different county within same state (%) - Asian
Geographical mobility - Moved from different county within same state (%) - Hispanic or Latino
Geographical mobility - Moved from different county within same state (%) - American Indian and Alaska Native
Geographical mobility - Moved from different county within same state (%) - Multirace
Geographical mobility - Moved from different county within same state (%) - Other Race
Geographical mobility - Moved from different state (%)
Geographical mobility - Moved from different state (%) - White
Geographical mobility - Moved from different state (%) - Black or African American
Geographical mobility - Moved from different state (%) - Asian
Geographical mobility - Moved from different state (%) - Hispanic or Latino
Geographical mobility - Moved from different state (%) - American Indian and Alaska Native
Geographical mobility - Moved from different state (%) - Multirace
Geographical mobility - Moved from different state (%) - Other Race
Geographical mobility - Moved from abroad (%)
Geographical mobility - Moved from abroad (%) - White
Geographical mobility - Moved from abroad (%) - Black or African American
Geographical mobility - Moved from abroad (%) - Asian
Geographical mobility - Moved from abroad (%) - Hispanic or Latino
Geographical mobility - Moved from abroad (%) - American Indian and Alaska Native
Geographical mobility - Moved from abroad (%) - Multirace
Geographical mobility - Moved from abroad (%) - Other Race
Place of birth for the foreign-born population - Ireland (%)
Place of birth for the foreign-born population - Denmark (%)
Place of birth for the foreign-born population - Norway (%)
Place of birth for the foreign-born population - Sweden (%)
Place of birth for the foreign-born population - United Kingdom (%)
Place of birth for the foreign-born population - England (%)
Place of birth for the foreign-born population - Scotland (%)
Place of birth for the foreign-born population - Other Northern Europe (%)
Place of birth for the foreign-born population - Austria (%)
Place of birth for the foreign-born population - Belgium (%)
Place of birth for the foreign-born population - France (%)
Place of birth for the foreign-born population - Germany (%)
Place of birth for the foreign-born population - Netherlands (%)
Place of birth for the foreign-born population - Switzerland (%)
Place of birth for the foreign-born population - Other Western Europe (%)
Place of birth for the foreign-born population - Greece (%)
Place of birth for the foreign-born population - Italy (%)
Place of birth for the foreign-born population - Portugal (%)
Place of birth for the foreign-born population - Spain (%)
Place of birth for the foreign-born population - Other Southern Europe (%)
Place of birth for the foreign-born population - Albania (%)
Place of birth for the foreign-born population - Belarus (%)
Place of birth for the foreign-born population - Bosnia and Herzegovina (%)
Place of birth for the foreign-born population - Bulgaria (%)
Place of birth for the foreign-born population - Croatia (%)
Place of birth for the foreign-born population - Czechoslovakia (%)
Place of birth for the foreign-born population - Hungary (%)
Place of birth for the foreign-born population - Latvia (%)
Place of birth for the foreign-born population - Lithuania (%)
Place of birth for the foreign-born population - North Macedonia (Macedonia) (%)
Place of birth for the foreign-born population - Moldova (%)
Place of birth for the foreign-born population - Poland (%)
Place of birth for the foreign-born population - Romania (%)
Place of birth for the foreign-born population - Russia (%)
Place of birth for the foreign-born population - Serbia (%)
Place of birth for the foreign-born population - Ukraine (%)
Place of birth for the foreign-born population - Other Eastern Europe (%)
Place of birth for the foreign-born population - China (%)
Place of birth for the foreign-born population - Hong Kong (%)
Place of birth for the foreign-born population - Taiwan (%)
Place of birth for the foreign-born population - Japan (%)
Place of birth for the foreign-born population - Korea (%)
Place of birth for the foreign-born population - Other Eastern Asia (%)
Place of birth for the foreign-born population - Afghanistan (%)
Place of birth for the foreign-born population - Bangladesh (%)
Place of birth for the foreign-born population - India (%)
Place of birth for the foreign-born population - Iran (%)
Place of birth for the foreign-born population - Kazakhstan (%)
Place of birth for the foreign-born population - Nepal (%)
Place of birth for the foreign-born population - Pakistan (%)
Place of birth for the foreign-born population - Sri Lanka (%)
Place of birth for the foreign-born population - Uzbekistan (%)
Place of birth for the foreign-born population - Other South Central Asia (%)
Place of birth for the foreign-born population - Burma (%)
Place of birth for the foreign-born population - Cambodia (%)
Place of birth for the foreign-born population - Indonesia (%)
Place of birth for the foreign-born population - Laos (%)
Place of birth for the foreign-born population - Malaysia (%)
Place of birth for the foreign-born population - Philippines (%)
Place of birth for the foreign-born population - Singapore (%)
Place of birth for the foreign-born population - Thailand (%)
Place of birth for the foreign-born population - Vietnam (%)
Place of birth for the foreign-born population - Other South Eastern Asia (%)
Place of birth for the foreign-born population - Armenia (%)
Place of birth for the foreign-born population - Iraq (%)
Place of birth for the foreign-born population - Israel (%)
Place of birth for the foreign-born population - Jordan (%)
Place of birth for the foreign-born population - Kuwait (%)
Place of birth for the foreign-born population - Lebanon (%)
Place of birth for the foreign-born population - Saudi Arabia (%)
Place of birth for the foreign-born population - Syria (%)
Place of birth for the foreign-born population - Turkey (%)
Place of birth for the foreign-born population - Yemen (%)
Place of birth for the foreign-born population - Other Western Asia (%)
Place of birth for the foreign-born population - Eritrea (%)
Place of birth for the foreign-born population - Ethiopia (%)
Place of birth for the foreign-born population - Kenya (%)
Place of birth for the foreign-born population - Somalia (%)
Place of birth for the foreign-born population - Uganda (%)
Place of birth for the foreign-born population - Zimbabwe (%)
Place of birth for the foreign-born population - Other Eastern Africa (%)
Place of birth for the foreign-born population - Cameroon (%)
Place of birth for the foreign-born population - Congo (%)
Place of birth for the foreign-born population - Democratic Republic of Congo (Zaire) (%)
Place of birth for the foreign-born population - Other Middle Africa (%)
Place of birth for the foreign-born population - Egypt (%)
Place of birth for the foreign-born population - Morocco (%)
Place of birth for the foreign-born population - Sudan (%)
Place of birth for the foreign-born population - Other Northern Africa (%)
Place of birth for the foreign-born population - South Africa (%)
Place of birth for the foreign-born population - Other Southern Africa (%)
Place of birth for the foreign-born population - Cabo Verde (%)
Place of birth for the foreign-born population - Ghana (%)
Place of birth for the foreign-born population - Liberia (%)
Place of birth for the foreign-born population - Nigeria (%)
Place of birth for the foreign-born population - Senegal (%)
Place of birth for the foreign-born population - Sierra Leone (%)
Place of birth for the foreign-born population - Other Western Africa (%)
Place of birth for the foreign-born population - Australia (%)
Place of birth for the foreign-born population - New Zealand (%)
Place of birth for the foreign-born population - Fiji (%)
Place of birth for the foreign-born population - Micronesia (%)
Place of birth for the foreign-born population - Bahamas (%)
Place of birth for the foreign-born population - Barbados (%)
Place of birth for the foreign-born population - Cuba (%)
Place of birth for the foreign-born population - Dominica (%)
Place of birth for the foreign-born population - Dominican Republic (%)
Place of birth for the foreign-born population - Grenada (%)
Place of birth for the foreign-born population - Haiti (%)
Place of birth for the foreign-born population - Jamaica (%)
Place of birth for the foreign-born population - St. Vincent and the Grenadines (%)
Place of birth for the foreign-born population - Trinidad and Tobago (%)
Place of birth for the foreign-born population - West Indies (%)
Place of birth for the foreign-born population - Other Caribbean (%)
Place of birth for the foreign-born population - Belize (%)
Place of birth for the foreign-born population - Costa Rica (%)
Place of birth for the foreign-born population - El Salvador (%)
Place of birth for the foreign-born population - Guatemala (%)
Place of birth for the foreign-born population - Honduras (%)
Place of birth for the foreign-born population - Mexico (%)
Place of birth for the foreign-born population - Nicaragua (%)
Place of birth for the foreign-born population - Panama (%)
Place of birth for the foreign-born population - Other Central America (%)
Place of birth for the foreign-born population - Argentina (%)
Place of birth for the foreign-born population - Bolivia (%)
Place of birth for the foreign-born population - Brazil (%)
Place of birth for the foreign-born population - Chile (%)
Place of birth for the foreign-born population - Colombia (%)
Place of birth for the foreign-born population - Ecuador (%)
Place of birth for the foreign-born population - Guyana (%)
Place of birth for the foreign-born population - Peru (%)
Place of birth for the foreign-born population - Uruguay (%)
Place of birth for the foreign-born population - Venezuela (%)
Place of birth for the foreign-born population - Other South America (%)
Place of birth for the foreign-born population - Canada (%)
Place of birth for the foreign-born population - Other Northern America (%)
Place of birth for the foreign-born population - Other (%)
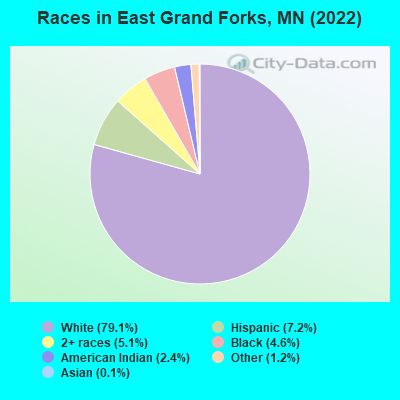
According to 2022 data, the most numerous races in East Grand Forks, MN are White alone (7,244 residents), Black alone (423 residents), and Hispanic (663 residents). 93.2% of East Grand Forks residents speak English at home. 2.9% of East Grand Forks, MN residents are foreign-born (1.2% born in Africa, 0.9% born in Latin America, 0.5% born in Asia), which is 178.4% less than the foreign-born rate of 8.0% across the entire state of Minnesota.
Race distribution in East Grand Forks
2000 2022
4,337,143 88.2% White alone 168,813 3.4% Black alone 143,382 2.9% Hispanic 141,083 2.9% Asian alone 70,304 1.4% Two or more races 52,009 1.1% American Indian alone 5,031 0.1% Other race alone 1,714 0.03% Native Hawaiian and Other
4,356,347 76.2% White alone 395,179 6.9% Black alone 333,830 5.8% Hispanic 294,800 5.2% Asian alone 259,649 4.5% Two or more races 42,125 0.7% American Indian alone 32,976 0.6% Other race alone 2,278 0.04% Native Hawaiian and Other
Income and house value in East Grand Forks Median household income in 2022 $88,889 White non-Hispanic householders$29,748 Black householders$53,502 Some other race householders$57,731 Two or more races householdersMedian 2022 house value $268,520 White Non-Hispanic householders$507,763 Black or African American householders$273,260 American Indian or Alaska Native householders $383,401 Asian householders$175,109 Some other race householders$182,080 Hispanic or Latino householders
Median age by race in East Grand Forks
37.5 Median age for White residents35.4 39.2 17.4 Median age for Black or African American residents13.4 26.5 34.9 Median age for American Indian / Alaska Native residents30.9 35.4 42.0 Median age for Asian residents-699,561,402.8 -687,499,999.3 -744,336,568.8 Median age for Native Hawaiian / Pacific Islander residents-856,799,036.4 -534,959,349.1 21.0 Median age for Other race residents40.5 20.3 20.6 Median age for Two or more races residents15.7 32.6 37.7 Median age for White alone residents36.6 38.8 21.1 Median age for Hispanic or Latino residents14.3 31.3
Owner/renter occupied households by race in East Grand Forks
House owners and renters - White residents 2,192 73.7% Owner occupied782 26.3% Renter occupiedHouse owners and renters - Black or African American residents 149 100.0% Renter occupiedHouse owners and renters - American Indian / Alaska Native residents 34 42.1% Owner occupied47 57.9% Renter occupiedHouse owners and renters - Other race residents 35 100.0% Owner occupiedHouse owners and renters - Two or more races residents 80 35.6% Owner occupied144 64.4% Renter occupiedHouse owners and renters - White alone residents 2,187 74.3% Owner occupied757 25.7% Renter occupiedHouse owners and renters - Hispanic or Latino residents 29 22.7% Owner occupied99 77.3% Renter occupied
Language usage in East Grand Forks
English speakers - Total 93.2% of residents of East Grand Forks speak English at home.
2.0% of residents speak Spanish at home 173 100.0% Speak English very well4.5% of residents speak other language at home 236 61.6% Speak English very well147 38.4% Speak English less than very well
English speakers - Born in the United States 96.5% of residents of East Grand Forks speak English at home.
1.5% of residents speak Spanish at home 83 100.0% Speak English very well1.8% of residents speak other language at home 98 100.0% Speak English very well
English speakers - Native, born elsewhere 85.2% of residents of East Grand Forks speak English at home.
13.0% of residents speak Spanish at home 14 100.0% Speak English very well
English speakers - Foreign-born 16.7% of residents of East Grand Forks speak English at home.
14.4% of residents speak Spanish at home 38 100.0% Speak English very well66.7% of residents speak other language at home 53 30.1% Speak English very well123 69.9% Speak English less than very well
White (Caucasian) - Speak only English Native:
98.5% (6,821)Foreign-born:
35.7% (18)
White (Caucasian) - Speak another language Native:
1.6% (107)Foreign-born:
62.8% (32)
Black or African American - Speak another language Native:
37.9% (94)Foreign-born:
100.0% (163)
Other race - Speak only English Native:
86.2% (195)Foreign-born:
100.0% (30)
White alone - Speak another language Native:
0.7% (48)Foreign-born:
95.9% (45)
Hispanic or Latino - Speak only English Native:
76.1% (394)Foreign-born:
100.0% (44)
Foreign-born residents in East Grand Forks 263 residents are foreign born (1.2% Africa , 0.9% Latin America , 0.5% Asia ).
This city:
2.9%Minnesota:
8.5%
Marital status for residents in East Grand Forks Marital status - White (Caucasian) population 15 years and over
Males 30.4% Never married59.0% Now married0.0% Separated2.2% Widowed8.4% DivorcedFemales 23.3% Never married59.1% Now married3.5% Separated6.1% Widowed8.0% DivorcedWomen who gave birth in the past 12 months Now married:
89.7% (159)Unmarried:
10.3% (18)
Women who did not give birth in the past 12 months Now married:
60.1% (877)Unmarried:
39.9% (582)
Marital status - Black or African American population 15 years and over
Males 81.7% Never married0.0% Now married0.0% Separated0.0% Widowed18.3% DivorcedFemales 44.2% Never married55.8% Now married0.0% Separated0.0% Widowed0.0% DivorcedWomen who did not give birth in the past 12 months Now married:
55.8% (79)Unmarried:
44.2% (63)
Marital status - American Indian / Alaska Native population 15 years and over
Males 27.6% Never married72.4% Now married0.0% Separated0.0% Widowed0.0% DivorcedFemales 62.5% Never married12.5% Now married0.0% Separated0.0% Widowed25.0% DivorcedWomen who gave birth in the past 12 months Now married:
0.0% (0)Unmarried:
100.0% (18)
Women who did not give birth in the past 12 months Now married:
17.4% (8)Unmarried:
82.6% (40)
Marital status - Asian population 15 years and over
Males 0.0% Never married100.0% Now married0.0% Separated0.0% Widowed0.0% DivorcedFemales 100.0% Never married0.0% Now married0.0% Separated0.0% Widowed0.0% DivorcedWomen who did not give birth in the past 12 months Now married:
0.0% (0)Unmarried:
100.0% (5)
Marital status - Other race population 15 years and over
Males 30.9% Never married69.1% Now married0.0% Separated0.0% Widowed0.0% DivorcedFemales 39.7% Never married60.3% Now married0.0% Separated0.0% Widowed0.0% DivorcedWomen who did not give birth in the past 12 months Now married:
60.3% (50)Unmarried:
39.7% (33)
Marital status - Two or more races population 15 years and over
Males 85.4% Never married9.9% Now married0.0% Separated0.0% Widowed4.7% DivorcedFemales 45.5% Never married40.7% Now married4.8% Separated0.0% Widowed9.0% DivorcedWomen who did not give birth in the past 12 months Now married:
44.5% (69)Unmarried:
55.5% (86)
Marital status - White alone, not Hispanic / Latino population 15 years and over
Males 29.1% Never married60.1% Now married0.0% Separated2.2% Widowed8.6% DivorcedFemales 23.2% Never married61.0% Now married1.2% Separated6.3% Widowed8.3% DivorcedWomen who gave birth in the past 12 months Now married:
89.7% (162)Unmarried:
10.3% (19)
Women who did not give birth in the past 12 months Now married:
61.4% (890)Unmarried:
38.6% (559)
Marital status - Hispanic or Latino population 15 years and over
Males 63.6% Never married36.4% Now married0.0% Separated0.0% Widowed0.0% DivorcedFemales 45.7% Never married25.1% Now married28.4% Separated0.0% Widowed0.8% DivorcedWomen who did not give birth in the past 12 months Now married:
30.2% (52)Unmarried:
69.8% (120)
Ancestries in East Grand Forks
1,282 29.7% Norwegian551 12.8% German335 7.8% Irish177 4.1% American159 3.7% European159 3.7% Somali95 2.2% Swedish92 2.1% Iraqi83 1.9% Czech76 1.8% French74 1.7% Scandinavian67 1.6% English46 1.1% Haitian38 0.9% Northern European34 0.8% Polish23 0.5% Finnish20 0.5% French Canadian18 0.4% Czechoslovakian13 0.3% Icelander13 0.3% Ukrainian10 0.2% Eastern European10 0.2% Italian7 0.2% Danish7 0.2% Romanian6 0.1% Macedonian5 0.1% Dutch
Children Nativity (place of birth) in East Grand Forks
Children under 6 years - Living with two parents Both parents native 552 100.0% NativeOne native, one foreign-born parent 9 100.0% NativeChildren under 6 years - Living with one parent Native parent 123 100.0% NativeForeign-born parent 87 100.0% NativeChildren 6 to 17 years - Living with two parents Both parents native 1,266 100.0% NativeBoth parents foreign-born 10 34.7% Native18 65.3% Foreign-bornOne native, one foreign-born parent 20 100.0% NativeChildren 6 to 17 years - Living with one parent Native parent 384 100.0% NativeForeign-born parent 17 50.4% Native17 49.6% Foreign-born
Grandparents responsible for own grandchildren in East Grand Forks
Grandparents (30 to 59 years) White / Caucasian 1 8.2% Responsible for grandchildren14 91.8% Not responsible for grandchildrenWhite alone, not Hispanic / Latino 1 8.2% Responsible for grandchildren14 91.8% Not responsible for grandchildren
Grandparents (60 years and over) White / Caucasian 15 100.0% Not responsible for grandchildrenWhite alone, not Hispanic / Latino 15 100.0% Not responsible for grandchildren