Races in East Cleveland, Oklahoma (OK) Detailed Stats
Ancestries, Foreign-born residents, place of birth
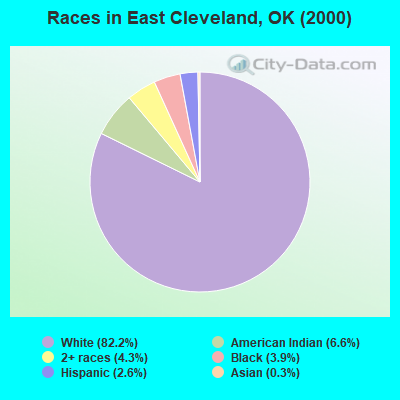
Race distribution in East Cleveland

- 17,27482.2%White alone
- 1,3776.6%American Indian alone
- 9124.3%Two or more races
- 8203.9%Black alone
- 5432.6%Hispanic
- 720.3%Asian alone
- 110.05%Other race alone
- 100.05%Native Hawaiian and Other
Pacific Islander alone
2000
2022
-
- 2,556,36874.1%White alone
- 266,1587.7%American Indian alone
- 257,9817.5%Black alone
- 179,3045.2%Hispanic
- 140,2494.1%Two or more races
- 46,1721.3%Asian alone
- 2,3220.07%Other race alone
- 2,1000.06%Native Hawaiian and Other
Pacific Islander alone

-
- 2,517,40362.6%White alone
- 486,69212.1%Hispanic
- 364,4539.1%Two or more races
- 273,6506.8%American Indian alone
- 268,5436.7%Black alone
- 92,6722.3%Asian alone
- 10,7860.3%Other race alone
- 5,6010.1%Native Hawaiian and Other
Pacific Islander alone

Income and house value in East Cleveland
- Median household income in 2022
- $72,462White non-Hispanic householders
- $72,902Black householders
- $78,144American Indian and Alaska Native householders
- $49,443Some other race householders
- $60,534Two or more races householders
- $64,492Hispanic or Latino race householders
- Median 2022 house value
- $245,666White Non-Hispanic householders
- $208,615Black or African American householders
- $159,482American Indian or Alaska Native householders
- $191,969Some other race householders
- $158,139Two or more races householders
- $183,377Hispanic or Latino householders
Household income for White non-Hispanic householders

Household income for Black householders

Household income for American Indian and Alaska Native householders

Household income for Two or more races householders

Household income for Hispanic or Latino race householders

Zip code: 73068