Races in East Bridgewater, Massachusetts (MA) Detailed Stats
Ancestries, Foreign-born residents, place of birth

Recent posts about races in East Bridgewater, Massachusetts on our local forum with over 2,400,000 registered users:

3.8% of East Bridgewater, MA residents are foreign-born (1.6% born in Europe, 1.0% born in Africa, 0.5% born in Latin America, 0.4% born in North America), which is 377.6% less than the foreign-born rate of 18.0% across the entire state of Massachusetts.
Race distribution in East Bridgewater

- 12,50396.4%White alone
- 1301.0%Two or more races
- 1220.9%Black alone
- 970.7%Hispanic
- 610.5%Asian alone
- 360.3%Other race alone
- 210.2%American Indian alone
- 40.03%Native Hawaiian and Other
Pacific Islander alone

2000
2022
-
- 5,198,35981.9%White alone
- 428,7296.8%Hispanic
- 318,3295.0%Black alone
- 236,7863.7%Asian alone
- 110,3381.7%Two or more races
- 43,5860.7%Other race alone
- 11,2640.2%American Indian alone
- 1,7060.03%Native Hawaiian and Other
Pacific Islander alone

-
- 4,676,62767.0%White alone
- 911,03813.0%Hispanic
- 501,4637.2%Asian alone
- 459,7406.6%Black alone
- 341,8894.9%Two or more races
- 84,4031.2%Other race alone
- 5,8380.08%American Indian alone
- 9760.01%Native Hawaiian and Other
Pacific Islander alone

Income and house value in East Bridgewater
- Median household income in 2022
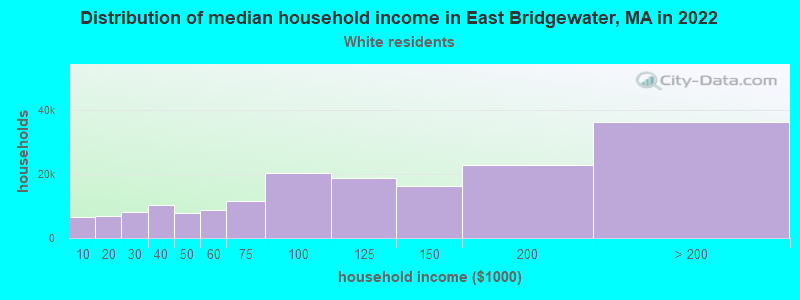
- $112,268White non-Hispanic householders
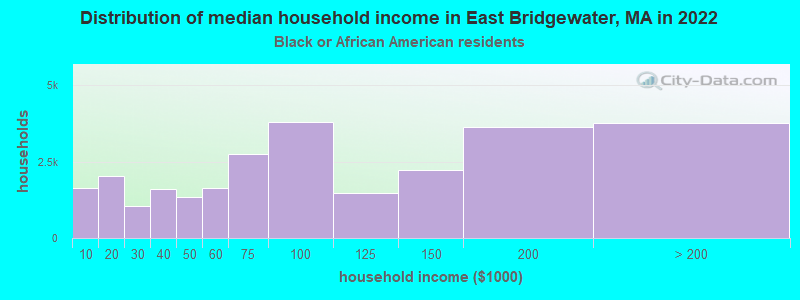
- $151,970Black householders
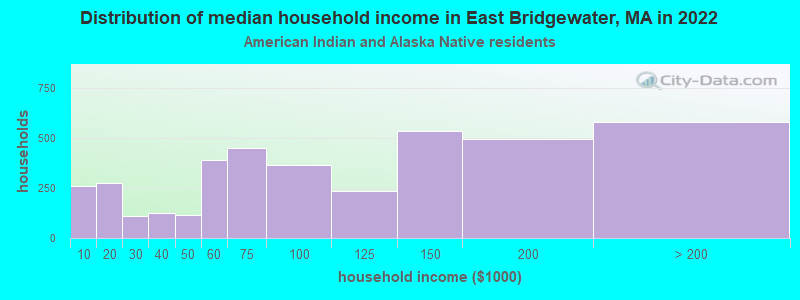
- $88,396American Indian and Alaska Native householders
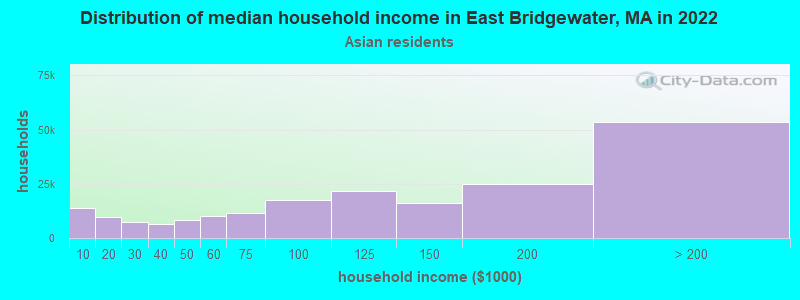
- $92,780Asian householders
- $114,550Some other race householders
- $145,682Two or more races householders
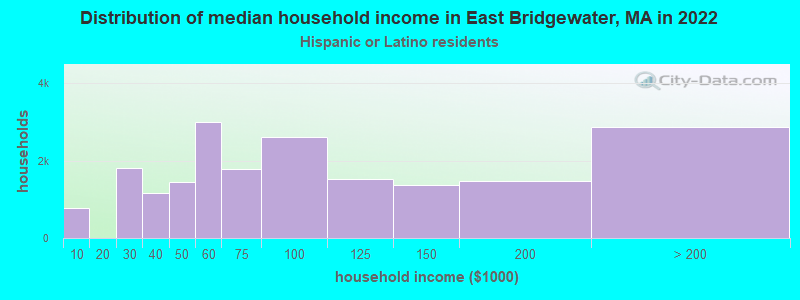
- over $200,000Hispanic or Latino race householders
- Median 2022 house value
- $538,451White Non-Hispanic householders
- $432,256Black or African American householders
- $506,063Asian householders
- $622,847Some other race householders
- $799,113Two or more races householders
- $528,174Hispanic or Latino householders
Household income for White non-Hispanic householders
Household income for Black householders
Household income for American Indian and Alaska Native householders
Household income for Asian householders
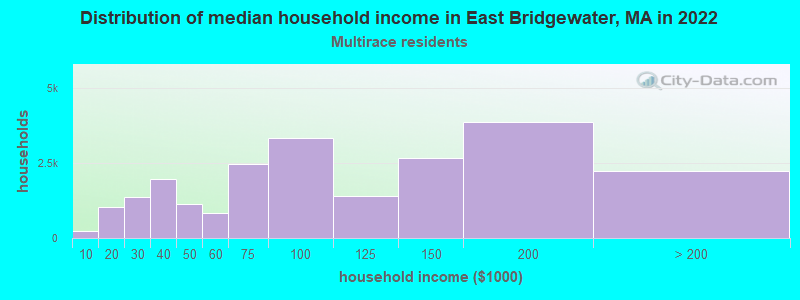
Household income for Two or more races householders
Household income for Hispanic or Latino race householders
Foreign-born residents in East Bridgewater
489 residents are foreign born (1.6% Europe, 1.0% Africa, 0.5% Latin America, 0.4% North America).
| This city: | 3.8% |
| Massachusetts: | 12.2% |
Ancestries in East Bridgewater

- 4,21026.5%Irish
- 2,21414.0%Italian
- 2,01112.7%English
- 1,0316.5%Other
- 8335.3%French
- 8185.2%German
- 7935.0%United States
- 5423.4%French Canadian
- 4703.0%Swedish
- 4612.9%Scottish
- 4372.8%Portuguese
- 4352.7%Polish
- 3672.3%Scotch-Irish
- 2551.6%Subsaharan African
- 2161.4%Russian
- 1681.1%Lithuanian
- 1611.0%Norwegian
- 1581.0%Arab
- 720.5%West Indian
- 700.4%Dutch
- 660.4%Greek
- 230.1%Slovak
- 140.09%Swiss
- 140.09%Ukrainian
- 90.06%Czech
- 70.04%Welsh
- 60.04%Danish

Zip codes: 02333.