Races in Dyer, Indiana (IN) Detailed Stats
Data:
Races - White alone (%)
Races - White alone (% change since 2000)
Races - Black alone (%)
Races - Black alone (% change since 2000)
Races - American Indian alone (%)
Races - American Indian alone (% change since 2000)
Races - Asian alone (%)
Races - Asian alone (% change since 2000)
Races - Hispanic (%)
Races - Hispanic (% change since 2000)
Races - Native Hawaiian and Other Pacific Islander alone (%)
Races - Native Hawaiian and Other Pacific Islander alone (% change since 2000)
Races - Two or more races(%)
Races - Two or more races(% change since 2000)
Races - Other race alone (%)
Races - Other race alone (% change since 2000)
Racial diversity
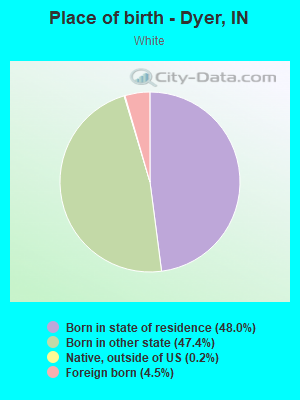
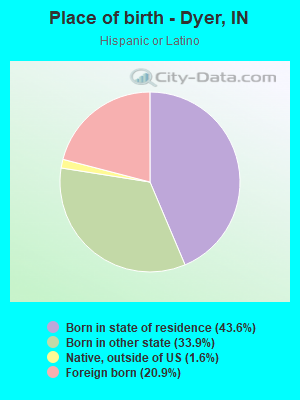
Place of birth - Born in state of residence (%)
Place of birth - Born in state of residence (%) - White
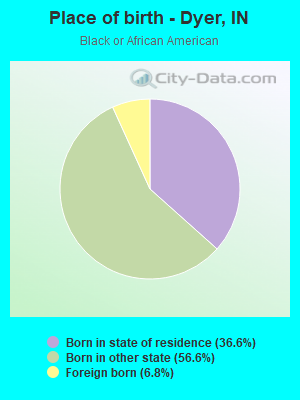
Place of birth - Born in state of residence (%) - Black or African American
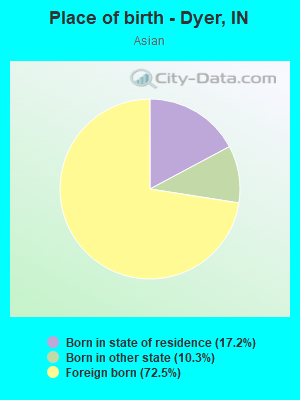
Place of birth - Born in state of residence (%) - Asian
Place of birth - Born in state of residence (%) - Hispanic or Latino
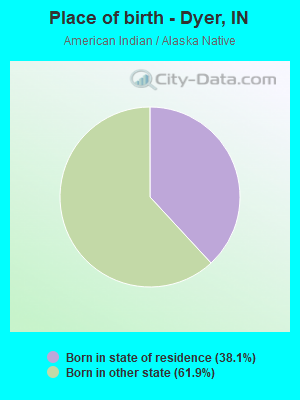
Place of birth - Born in state of residence (%) - American Indian and Alaska Native
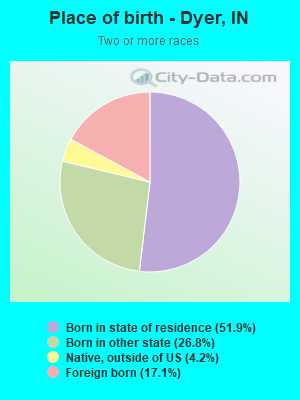
Place of birth - Born in state of residence (%) - Multirace
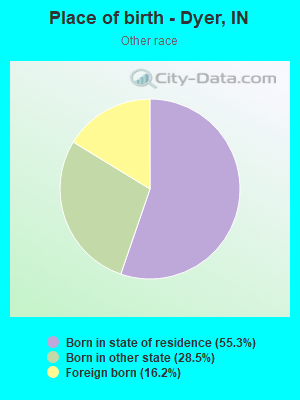
Place of birth - Born in state of residence (%) - Other Race
Place of birth - Born in other state (%)
Place of birth - Born in other state (%) - White
Place of birth - Born in other state (%) - Black or African American
Place of birth - Born in other state (%) - Asian
Place of birth - Born in other state (%) - Hispanic or Latino
Place of birth - Born in other state (%) - American Indian and Alaska Native
Place of birth - Born in other state (%) - Multirace
Place of birth - Born in other state (%) - Other Race
Place of birth - Native, outside of US (%)
Place of birth - Native, outside of US (%) - White
Place of birth - Native, outside of US (%) - Black or African American
Place of birth - Native, outside of US (%) - Asian
Place of birth - Native, outside of US (%) - Hispanic or Latino
Place of birth - Native, outside of US (%) - American Indian and Alaska Native
Place of birth - Native, outside of US (%) - Multirace
Place of birth - Native, outside of US (%) - Other Race
Place of birth - Foreign born (%)
Place of birth - Foreign born (%) - White
Place of birth - Foreign born (%) - Black or African American
Place of birth - Foreign born (%) - Asian
Place of birth - Foreign born (%) - Hispanic or Latino
Place of birth - Foreign born (%) - American Indian and Alaska Native
Place of birth - Foreign born (%) - Multirace
Place of birth - Foreign born (%) - Other Race
Residents speaking English at home (%)
Residents speaking English at home - Born in the United States (%)
Residents speaking English at home - Native, born elsewhere (%)
Residents speaking English at home - Foreign born (%)
Residents speaking Spanish at home (%)
Residents speaking Spanish at home - Born in the United States (%)
Residents speaking Spanish at home - Native, born elsewhere (%)
Residents speaking Spanish at home - Foreign born (%)
Residents speaking other language at home (%)
Residents speaking other language at home - Born in the United States (%)
Residents speaking other language at home - Native, born elsewhere (%)
Residents speaking other language at home - Foreign born (%)
Marital status - Never married (%)
Marital status - Now married (%)
Marital status - Separated (%)
Marital status - Widowed (%)
Marital status - Divorced (%)
Ancestries Reported - Arab (%)
Ancestries Reported - Czech (%)
Ancestries Reported - Danish (%)
Ancestries Reported - Dutch (%)
Ancestries Reported - English (%)
Ancestries Reported - French (%)
Ancestries Reported - French Canadian (%)
Ancestries Reported - German (%)
Ancestries Reported - Greek (%)
Ancestries Reported - Hungarian (%)
Ancestries Reported - Irish (%)
Ancestries Reported - Italian (%)
Ancestries Reported - Lithuanian (%)
Ancestries Reported - Norwegian (%)
Ancestries Reported - Polish (%)
Ancestries Reported - Portuguese (%)
Ancestries Reported - Russian (%)
Ancestries Reported - Scotch-Irish (%)
Ancestries Reported - Scottish (%)
Ancestries Reported - Slovak (%)
Ancestries Reported - Subsaharan African (%)
Ancestries Reported - Swedish (%)
Ancestries Reported - Swiss (%)
Ancestries Reported - Ukrainian (%)
Ancestries Reported - United States (%)
Ancestries Reported - Welsh (%)
Ancestries Reported - West Indian (%)
Ancestries Reported - Other (%)
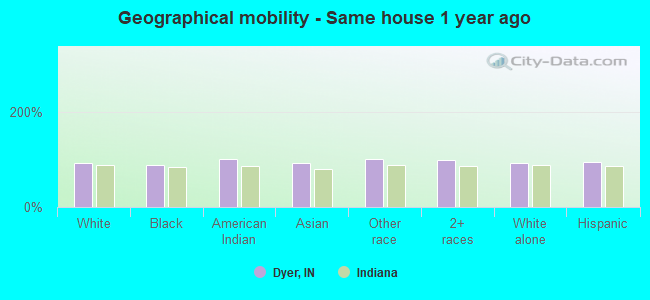
Geographical mobility - Same house 1 year ago (%)
Geographical mobility - Same house 1 year ago (%) - White
Geographical mobility - Same house 1 year ago (%) - Black or African American
Geographical mobility - Same house 1 year ago (%) - Asian
Geographical mobility - Same house 1 year ago (%) - Hispanic or Latino
Geographical mobility - Same house 1 year ago (%) - American Indian and Alaska Native
Geographical mobility - Same house 1 year ago (%) - Multirace
Geographical mobility - Same house 1 year ago (%) - Other Race
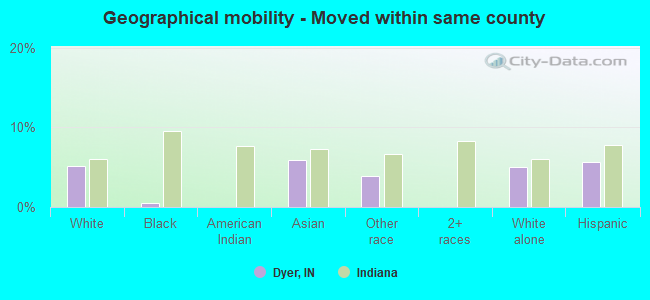
Geographical mobility - Moved within same county (%)
Geographical mobility - Moved within same county (%) - White
Geographical mobility - Moved within same county (%) - Black or African American
Geographical mobility - Moved within same county (%) - Asian
Geographical mobility - Moved within same county (%) - Hispanic or Latino
Geographical mobility - Moved within same county (%) - American Indian and Alaska Native
Geographical mobility - Moved within same county (%) - Multirace
Geographical mobility - Moved within same county (%) - Other Race
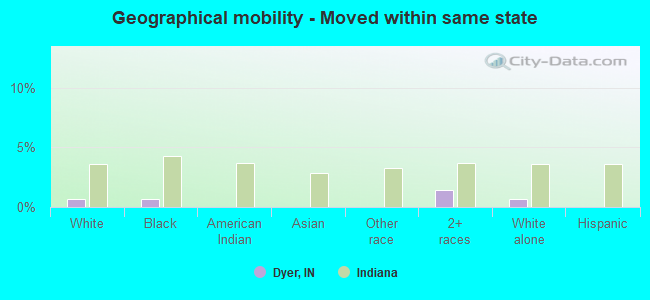
Geographical mobility - Moved from different county within same state (%)
Geographical mobility - Moved from different county within same state (%) - White
Geographical mobility - Moved from different county within same state (%) - Black or African American
Geographical mobility - Moved from different county within same state (%) - Asian
Geographical mobility - Moved from different county within same state (%) - Hispanic or Latino
Geographical mobility - Moved from different county within same state (%) - American Indian and Alaska Native
Geographical mobility - Moved from different county within same state (%) - Multirace
Geographical mobility - Moved from different county within same state (%) - Other Race
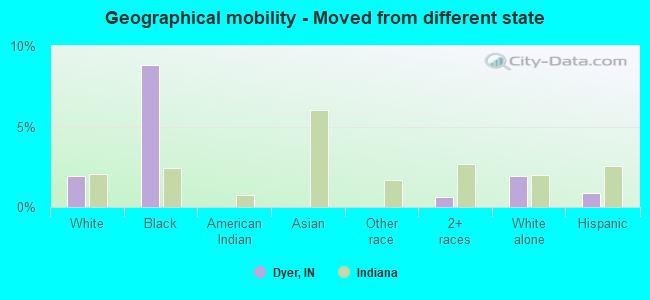
Geographical mobility - Moved from different state (%)
Geographical mobility - Moved from different state (%) - White
Geographical mobility - Moved from different state (%) - Black or African American
Geographical mobility - Moved from different state (%) - Asian
Geographical mobility - Moved from different state (%) - Hispanic or Latino
Geographical mobility - Moved from different state (%) - American Indian and Alaska Native
Geographical mobility - Moved from different state (%) - Multirace
Geographical mobility - Moved from different state (%) - Other Race
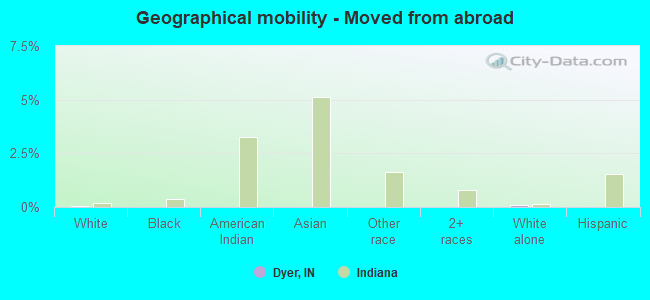
Geographical mobility - Moved from abroad (%)
Geographical mobility - Moved from abroad (%) - White
Geographical mobility - Moved from abroad (%) - Black or African American
Geographical mobility - Moved from abroad (%) - Asian
Geographical mobility - Moved from abroad (%) - Hispanic or Latino
Geographical mobility - Moved from abroad (%) - American Indian and Alaska Native
Geographical mobility - Moved from abroad (%) - Multirace
Geographical mobility - Moved from abroad (%) - Other Race
Place of birth for the foreign-born population - Ireland (%)
Place of birth for the foreign-born population - Denmark (%)
Place of birth for the foreign-born population - Norway (%)
Place of birth for the foreign-born population - Sweden (%)
Place of birth for the foreign-born population - United Kingdom (%)
Place of birth for the foreign-born population - England (%)
Place of birth for the foreign-born population - Scotland (%)
Place of birth for the foreign-born population - Other Northern Europe (%)
Place of birth for the foreign-born population - Austria (%)
Place of birth for the foreign-born population - Belgium (%)
Place of birth for the foreign-born population - France (%)
Place of birth for the foreign-born population - Germany (%)
Place of birth for the foreign-born population - Netherlands (%)
Place of birth for the foreign-born population - Switzerland (%)
Place of birth for the foreign-born population - Other Western Europe (%)
Place of birth for the foreign-born population - Greece (%)
Place of birth for the foreign-born population - Italy (%)
Place of birth for the foreign-born population - Portugal (%)
Place of birth for the foreign-born population - Spain (%)
Place of birth for the foreign-born population - Other Southern Europe (%)
Place of birth for the foreign-born population - Albania (%)
Place of birth for the foreign-born population - Belarus (%)
Place of birth for the foreign-born population - Bosnia and Herzegovina (%)
Place of birth for the foreign-born population - Bulgaria (%)
Place of birth for the foreign-born population - Croatia (%)
Place of birth for the foreign-born population - Czechoslovakia (%)
Place of birth for the foreign-born population - Hungary (%)
Place of birth for the foreign-born population - Latvia (%)
Place of birth for the foreign-born population - Lithuania (%)
Place of birth for the foreign-born population - North Macedonia (Macedonia) (%)
Place of birth for the foreign-born population - Moldova (%)
Place of birth for the foreign-born population - Poland (%)
Place of birth for the foreign-born population - Romania (%)
Place of birth for the foreign-born population - Russia (%)
Place of birth for the foreign-born population - Serbia (%)
Place of birth for the foreign-born population - Ukraine (%)
Place of birth for the foreign-born population - Other Eastern Europe (%)
Place of birth for the foreign-born population - China (%)
Place of birth for the foreign-born population - Hong Kong (%)
Place of birth for the foreign-born population - Taiwan (%)
Place of birth for the foreign-born population - Japan (%)
Place of birth for the foreign-born population - Korea (%)
Place of birth for the foreign-born population - Other Eastern Asia (%)
Place of birth for the foreign-born population - Afghanistan (%)
Place of birth for the foreign-born population - Bangladesh (%)
Place of birth for the foreign-born population - India (%)
Place of birth for the foreign-born population - Iran (%)
Place of birth for the foreign-born population - Kazakhstan (%)
Place of birth for the foreign-born population - Nepal (%)
Place of birth for the foreign-born population - Pakistan (%)
Place of birth for the foreign-born population - Sri Lanka (%)
Place of birth for the foreign-born population - Uzbekistan (%)
Place of birth for the foreign-born population - Other South Central Asia (%)
Place of birth for the foreign-born population - Burma (%)
Place of birth for the foreign-born population - Cambodia (%)
Place of birth for the foreign-born population - Indonesia (%)
Place of birth for the foreign-born population - Laos (%)
Place of birth for the foreign-born population - Malaysia (%)
Place of birth for the foreign-born population - Philippines (%)
Place of birth for the foreign-born population - Singapore (%)
Place of birth for the foreign-born population - Thailand (%)
Place of birth for the foreign-born population - Vietnam (%)
Place of birth for the foreign-born population - Other South Eastern Asia (%)
Place of birth for the foreign-born population - Armenia (%)
Place of birth for the foreign-born population - Iraq (%)
Place of birth for the foreign-born population - Israel (%)
Place of birth for the foreign-born population - Jordan (%)
Place of birth for the foreign-born population - Kuwait (%)
Place of birth for the foreign-born population - Lebanon (%)
Place of birth for the foreign-born population - Saudi Arabia (%)
Place of birth for the foreign-born population - Syria (%)
Place of birth for the foreign-born population - Turkey (%)
Place of birth for the foreign-born population - Yemen (%)
Place of birth for the foreign-born population - Other Western Asia (%)
Place of birth for the foreign-born population - Eritrea (%)
Place of birth for the foreign-born population - Ethiopia (%)
Place of birth for the foreign-born population - Kenya (%)
Place of birth for the foreign-born population - Somalia (%)
Place of birth for the foreign-born population - Uganda (%)
Place of birth for the foreign-born population - Zimbabwe (%)
Place of birth for the foreign-born population - Other Eastern Africa (%)
Place of birth for the foreign-born population - Cameroon (%)
Place of birth for the foreign-born population - Congo (%)
Place of birth for the foreign-born population - Democratic Republic of Congo (Zaire) (%)
Place of birth for the foreign-born population - Other Middle Africa (%)
Place of birth for the foreign-born population - Egypt (%)
Place of birth for the foreign-born population - Morocco (%)
Place of birth for the foreign-born population - Sudan (%)
Place of birth for the foreign-born population - Other Northern Africa (%)
Place of birth for the foreign-born population - South Africa (%)
Place of birth for the foreign-born population - Other Southern Africa (%)
Place of birth for the foreign-born population - Cabo Verde (%)
Place of birth for the foreign-born population - Ghana (%)
Place of birth for the foreign-born population - Liberia (%)
Place of birth for the foreign-born population - Nigeria (%)
Place of birth for the foreign-born population - Senegal (%)
Place of birth for the foreign-born population - Sierra Leone (%)
Place of birth for the foreign-born population - Other Western Africa (%)
Place of birth for the foreign-born population - Australia (%)
Place of birth for the foreign-born population - New Zealand (%)
Place of birth for the foreign-born population - Fiji (%)
Place of birth for the foreign-born population - Micronesia (%)
Place of birth for the foreign-born population - Bahamas (%)
Place of birth for the foreign-born population - Barbados (%)
Place of birth for the foreign-born population - Cuba (%)
Place of birth for the foreign-born population - Dominica (%)
Place of birth for the foreign-born population - Dominican Republic (%)
Place of birth for the foreign-born population - Grenada (%)
Place of birth for the foreign-born population - Haiti (%)
Place of birth for the foreign-born population - Jamaica (%)
Place of birth for the foreign-born population - St. Vincent and the Grenadines (%)
Place of birth for the foreign-born population - Trinidad and Tobago (%)
Place of birth for the foreign-born population - West Indies (%)
Place of birth for the foreign-born population - Other Caribbean (%)
Place of birth for the foreign-born population - Belize (%)
Place of birth for the foreign-born population - Costa Rica (%)
Place of birth for the foreign-born population - El Salvador (%)
Place of birth for the foreign-born population - Guatemala (%)
Place of birth for the foreign-born population - Honduras (%)
Place of birth for the foreign-born population - Mexico (%)
Place of birth for the foreign-born population - Nicaragua (%)
Place of birth for the foreign-born population - Panama (%)
Place of birth for the foreign-born population - Other Central America (%)
Place of birth for the foreign-born population - Argentina (%)
Place of birth for the foreign-born population - Bolivia (%)
Place of birth for the foreign-born population - Brazil (%)
Place of birth for the foreign-born population - Chile (%)
Place of birth for the foreign-born population - Colombia (%)
Place of birth for the foreign-born population - Ecuador (%)
Place of birth for the foreign-born population - Guyana (%)
Place of birth for the foreign-born population - Peru (%)
Place of birth for the foreign-born population - Uruguay (%)
Place of birth for the foreign-born population - Venezuela (%)
Place of birth for the foreign-born population - Other South America (%)
Place of birth for the foreign-born population - Canada (%)
Place of birth for the foreign-born population - Other Northern America (%)
Place of birth for the foreign-born population - Other (%)
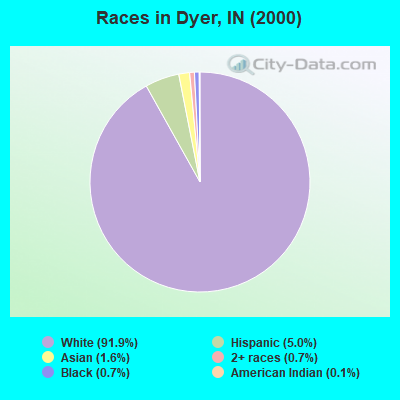
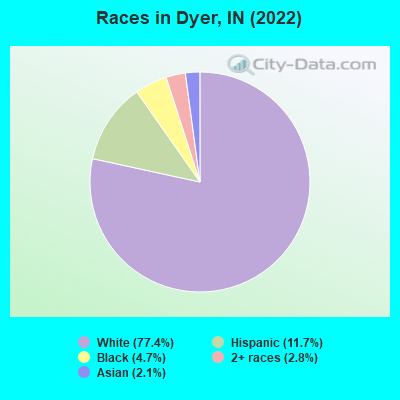
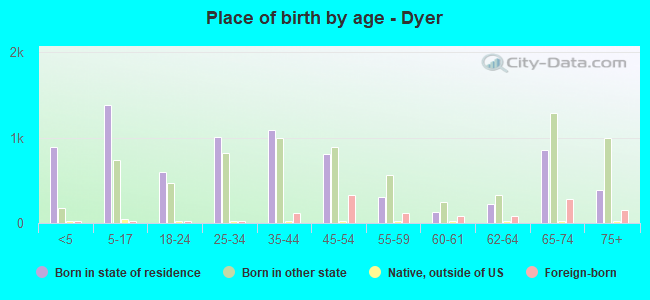
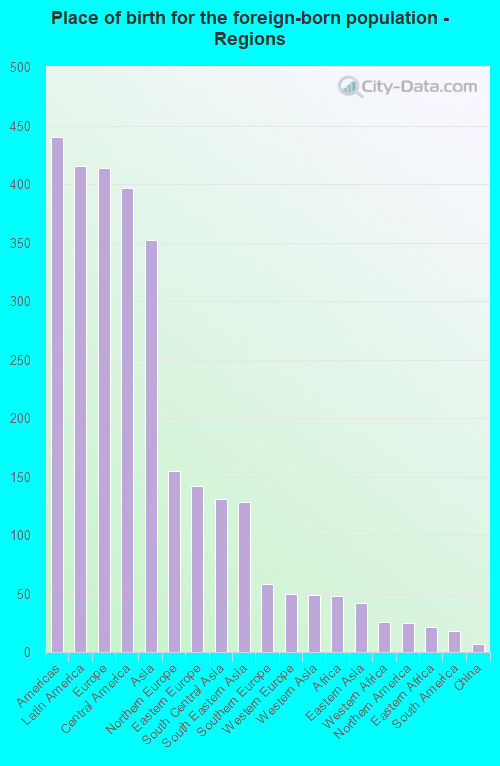
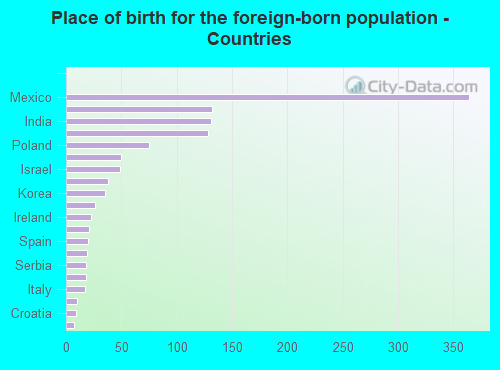
According to 2022 data, the most numerous races in Dyer, IN are White alone (12,749 residents), Black alone (780 residents), and Hispanic (1,931 residents). 89.0% of Dyer residents speak English at home. 7.6% of Dyer, IN residents are foreign-born (2.3% born in Latin America, 2.3% born in Europe, 2.0% born in Asia), which is 21.2% greater than the foreign-born rate of 6.0% across the entire state of Indiana.
Race distribution in Dyer
2000 2022
5,219,373 85.8% White alone 505,462 8.3% Black alone 214,536 3.5% Hispanic 61,115 1.0% Two or more races 58,424 1.0% Asian alone 13,654 0.2% American Indian alone 6,348 0.1% Other race alone 1,573 0.03% Native Hawaiian and Other
5,192,455 76.0% White alone 628,054 9.2% Black alone 534,528 7.8% Hispanic 263,242 3.9% Two or more races 172,880 2.5% Asian alone 33,467 0.5% Other race alone 5,866 0.09% American Indian alone 2,545 0.04% Native Hawaiian and Other
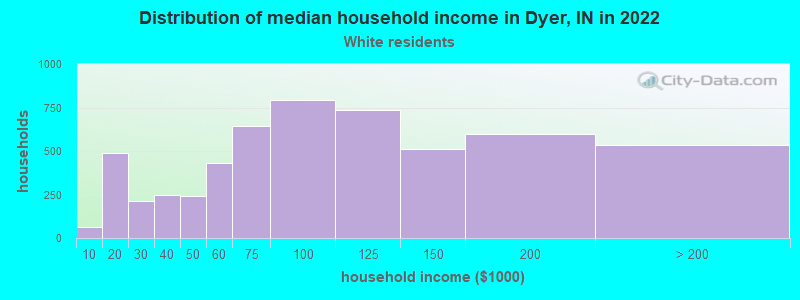
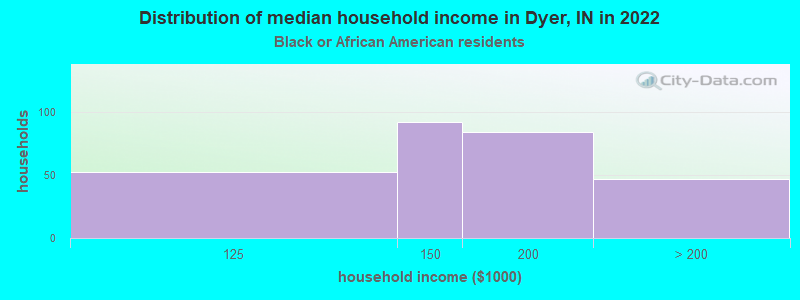
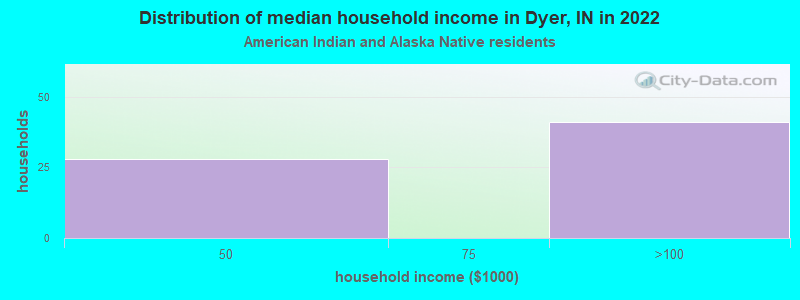
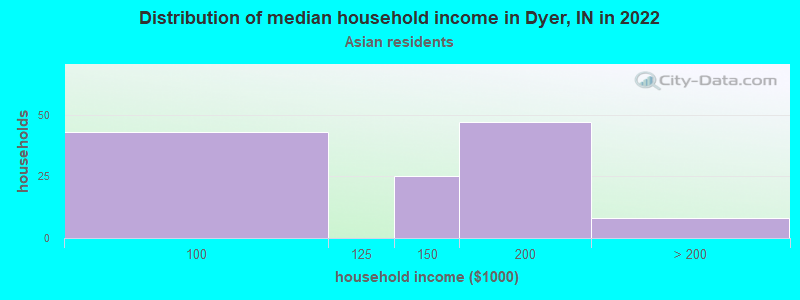
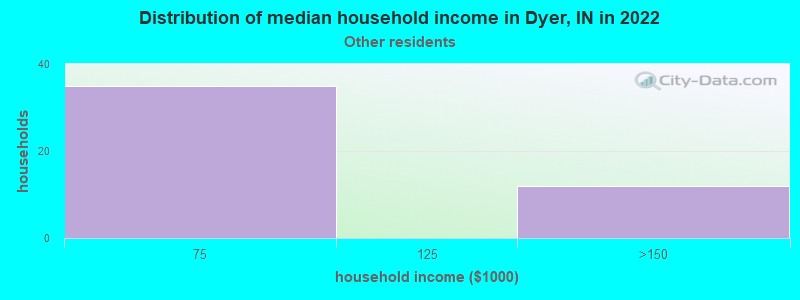
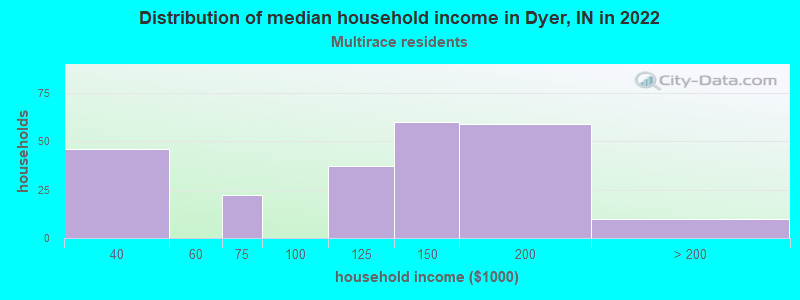
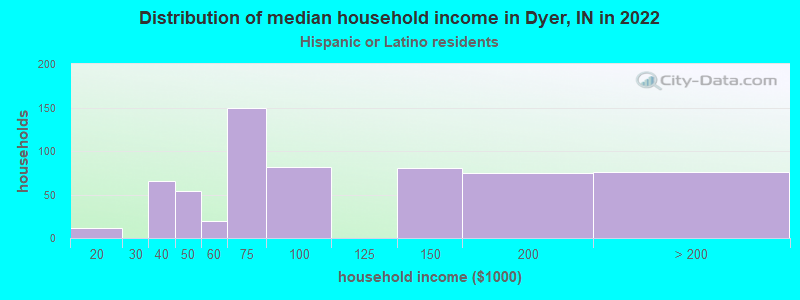
Income and house value in Dyer Median household income in 2022 $90,180 White non-Hispanic householders$168,152 Black householders$132,803 Asian householders$140,654 Two or more races householders$91,204 Hispanic or Latino race householdersMedian 2022 house value $313,215 White Non-Hispanic householdersover $1,000,000 Black or African American householders$122,873 American Indian or Alaska Native householders $691,219 Asian householders$457,983 Some other race householders$919,317 Two or more races householders$369,067 Hispanic or Latino householders
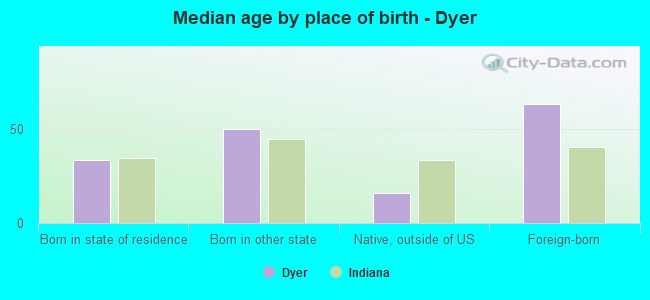
Median age by race in Dyer
46.4 Median age for White residents44.0 48.9 36.2 Median age for Black or African American residents36.2 35.7 38.2 Median age for American Indian / Alaska Native residents-531,041,069.2 -482,477,587.1 53.9 Median age for Asian residents49.3 53.8 -664,335,663.7 Median age for Native Hawaiian / Pacific Islander residents-644,025,156.6 -664,437,011.6 62.0 Median age for Other race residents69.3 62.3 25.5 Median age for Two or more races residents22.2 25.1 47.3 Median age for White alone residents45.2 48.9 35.4 Median age for Hispanic or Latino residents36.7 34.4
Owner/renter occupied households by race in Dyer
House owners and renters - White residents 4,852 87.9% Owner occupied667 12.1% Renter occupiedHouse owners and renters - Black or African American residents 215 100.0% Owner occupiedHouse owners and renters - American Indian / Alaska Native residents 71 100.0% Owner occupiedHouse owners and renters - Asian residents 132 100.0% Owner occupiedHouse owners and renters - Other race residents 39 100.0% Owner occupiedHouse owners and renters - Two or more races residents 344 100.0% Owner occupiedHouse owners and renters - White alone residents 4,699 87.4% Owner occupied675 12.6% Renter occupiedHouse owners and renters - Hispanic or Latino residents 614 95.4% Owner occupied30 4.6% Renter occupied
Language usage in Dyer
English speakers - Total 89.0% of residents of Dyer speak English at home.
5.0% of residents speak Spanish at home 658 85.3% Speak English very well113 14.7% Speak English less than very well5.7% of residents speak other language at home 541 61.3% Speak English very well342 38.7% Speak English less than very well
English speakers - Born in the United States 94.3% of residents of Dyer speak English at home.
3.5% of residents speak Spanish at home 247 94.6% Speak English very well14 5.4% Speak English less than very well1.5% of residents speak other language at home 112 100.0% Speak English very well
English speakers - Native, born elsewhere 66.1% of residents of Dyer speak English at home.
30.6% of residents speak Spanish at home 19 100.0% Speak English very well
English speakers - Foreign-born 27.3% of residents of Dyer speak English at home.
29.2% of residents speak Spanish at home 257 72.6% Speak English very well97 27.4% Speak English less than very well46.6% of residents speak other language at home 266 47.1% Speak English very well299 52.9% Speak English less than very well
White (Caucasian) - Speak only English Native:
97.2% (11,292)Foreign-born:
30.7% (179)
White (Caucasian) - Speak another language Native:
3.0% (349)Foreign-born:
66.1% (385)
Black or African American - Speak only English Native:
99.6% (720)Foreign-born:
100.0% (56)
Asian - Speak another language Native:
42.0% (39)Foreign-born:
92.9% (259)
Other race - Speak another language Native:
25.5% (31)Foreign-born:
97.6% (24)
Two or more races - Speak only English Native:
78.1% (956)Foreign-born:
10.2% (26)
Two or more races - Speak another language Native:
13.7% (168)Foreign-born:
89.5% (230)
White alone - Speak only English Native:
97.3% (11,114)Foreign-born:
30.4% (144)
White alone - Speak another language Native:
2.3% (263)Foreign-born:
60.8% (288)
Hispanic or Latino - Speak only English Native:
74.2% (1,018)Foreign-born:
14.2% (58)
Hispanic or Latino - Speak another language Native:
24.4% (335)Foreign-born:
85.9% (350)
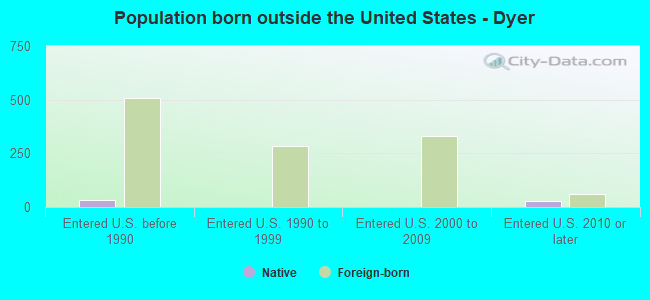
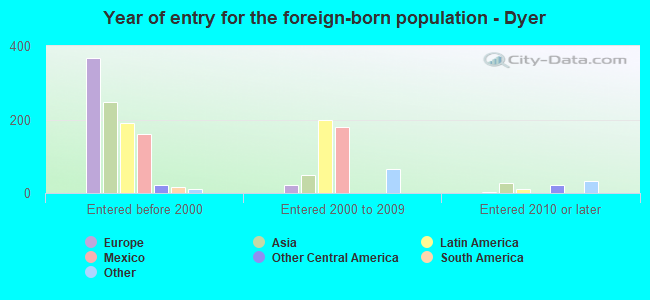
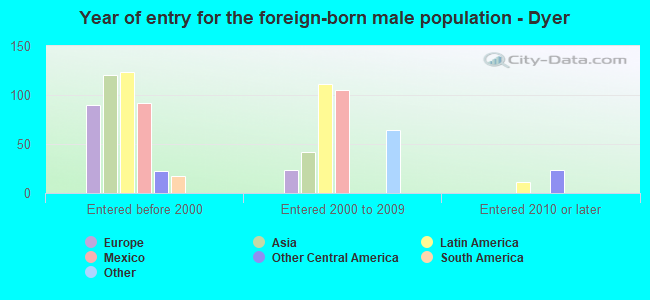
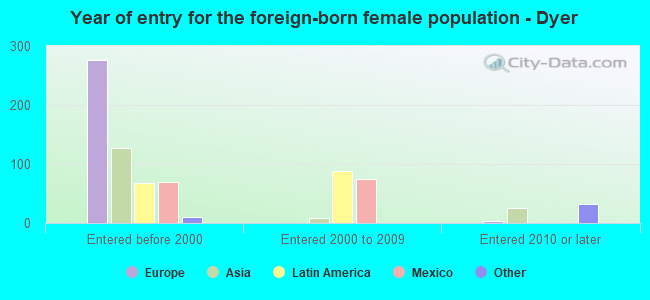
Foreign-born residents in Dyer 1,255 residents are foreign born (2.3% Latin America , 2.3% Europe , 2.0% Asia ).
This city:
7.6%Indiana:
5.6%
Marital status for residents in Dyer Marital status - White (Caucasian) population 15 years and over
Males 27.0% Never married58.8% Now married0.0% Separated6.8% Widowed7.4% DivorcedFemales 23.2% Never married50.4% Now married2.0% Separated11.2% Widowed13.1% DivorcedWomen who gave birth in the past 12 months Now married:
95.7% (207)Unmarried:
4.3% (9)
Women who did not give birth in the past 12 months Now married:
39.6% (1,039)Unmarried:
60.4% (1,586)
Marital status - Black or African American population 15 years and over
Males 15.1% Never married78.2% Now married2.7% Separated1.7% Widowed2.3% DivorcedFemales 9.7% Never married71.3% Now married8.0% Separated1.7% Widowed9.3% DivorcedWomen who did not give birth in the past 12 months Now married:
89.8% (169)Unmarried:
10.2% (19)
Marital status - American Indian / Alaska Native population 15 years and over
Males 0.0% Never married100.0% Now married0.0% Separated0.0% Widowed0.0% DivorcedFemales 0.0% Never married100.0% Now married0.0% Separated0.0% Widowed0.0% DivorcedMarital status - Asian population 15 years and over
Males 9.9% Never married59.9% Now married26.2% Separated0.0% Widowed4.1% DivorcedFemales 6.5% Never married75.4% Now married0.0% Separated0.0% Widowed18.1% DivorcedWomen who did not give birth in the past 12 months Now married:
60.9% (55)Unmarried:
39.1% (35)
Marital status - Other race population 15 years and over
Males 46.3% Never married42.6% Now married0.0% Separated11.1% Widowed0.0% DivorcedFemales 48.4% Never married44.0% Now married0.0% Separated7.7% Widowed0.0% DivorcedWomen who did not give birth in the past 12 months Now married:
21.4% (9)Unmarried:
78.6% (32)
Marital status - Two or more races population 15 years and over
Males 40.2% Never married59.8% Now married0.0% Separated0.0% Widowed0.0% DivorcedFemales 63.9% Never married14.3% Now married0.0% Separated5.9% Widowed16.0% DivorcedWomen who did not give birth in the past 12 months Now married:
2.9% (17)Unmarried:
97.1% (563)
Marital status - White alone, not Hispanic / Latino population 15 years and over
Males 26.4% Never married58.7% Now married0.0% Separated7.5% Widowed7.4% DivorcedFemales 24.0% Never married49.1% Now married2.1% Separated11.7% Widowed13.2% DivorcedWomen who gave birth in the past 12 months Now married:
94.2% (158)Unmarried:
5.8% (10)
Women who did not give birth in the past 12 months Now married:
38.5% (1,013)Unmarried:
61.5% (1,619)
Marital status - Hispanic or Latino population 15 years and over
Males 27.2% Never married61.5% Now married5.9% Separated0.8% Widowed4.6% DivorcedFemales 39.5% Never married41.4% Now married0.0% Separated5.2% Widowed13.9% DivorcedWomen who gave birth in the past 12 months Now married:
100.0% (61)Unmarried:
0.0% (0)
Women who did not give birth in the past 12 months Now married:
20.3% (83)Unmarried:
79.7% (326)
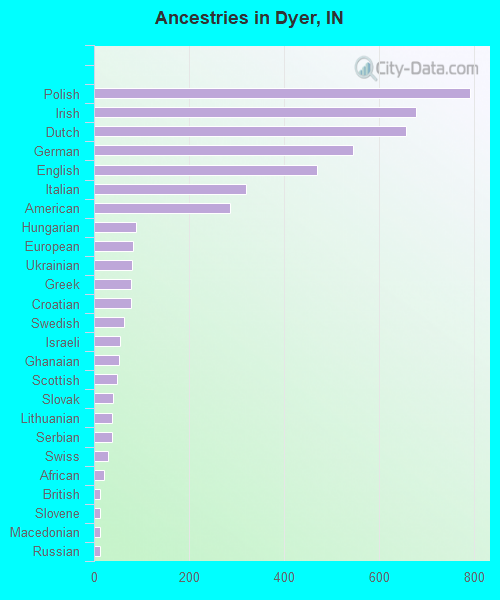
Ancestries in Dyer
791 11.8% Polish677 10.1% Irish655 9.8% Dutch544 8.1% German469 7.0% English319 4.8% Italian286 4.3% American88 1.3% Hungarian82 1.2% European79 1.2% Ukrainian78 1.2% Greek77 1.2% Croatian63 0.9% Swedish55 0.8% Israeli52 0.8% Ghanaian48 0.7% Scottish39 0.6% Slovak37 0.6% Lithuanian37 0.6% Serbian29 0.4% Swiss21 0.3% African13 0.2% British13 0.2% Slovene12 0.2% Macedonian12 0.2% Russian12 0.2% Yugoslavian11 0.2% Arab11 0.2% Norwegian10 0.1% Nigerian8 0.1% Welsh
Children Nativity (place of birth) in Dyer
Children under 6 years - Living with two parents Both parents native 852 100.0% NativeOne native, one foreign-born parent 22 100.0% NativeChildren under 6 years - Living with one parent Native parent 330 100.0% NativeChildren 6 to 17 years - Living with two parents Both parents native 1,333 99.8% Native3 0.2% Foreign-bornBoth parents foreign-born 102 87.2% Native15 12.8% Foreign-bornOne native, one foreign-born parent 144 100.0% NativeChildren 6 to 17 years - Living with one parent Native parent 429 100.0% Native
Grandparents responsible for own grandchildren in Dyer
Grandparents (30 to 59 years) White / Caucasian 78 100.0% Not responsible for grandchildrenBlack or African American 19 100.0% Not responsible for grandchildrenWhite alone, not Hispanic / Latino 83 100.0% Not responsible for grandchildrenGrandparents (60 years and over) White / Caucasian 35 28.9% Responsible for grandchildren85 71.1% Not responsible for grandchildrenWhite alone, not Hispanic / Latino 37 30.8% Responsible for grandchildren83 69.2% Not responsible for grandchildren