Races in Duluth, Georgia (GA) Detailed Stats
Data:
Races - White alone (%)
Races - White alone (% change since 2000)
Races - Black alone (%)
Races - Black alone (% change since 2000)
Races - American Indian alone (%)
Races - American Indian alone (% change since 2000)
Races - Asian alone (%)
Races - Asian alone (% change since 2000)
Races - Hispanic (%)
Races - Hispanic (% change since 2000)
Races - Native Hawaiian and Other Pacific Islander alone (%)
Races - Native Hawaiian and Other Pacific Islander alone (% change since 2000)
Races - Two or more races(%)
Races - Two or more races(% change since 2000)
Races - Other race alone (%)
Races - Other race alone (% change since 2000)
Racial diversity
Place of birth - Born in state of residence (%)
Place of birth - Born in state of residence (%) - White
Place of birth - Born in state of residence (%) - Black or African American
Place of birth - Born in state of residence (%) - Asian
Place of birth - Born in state of residence (%) - Hispanic or Latino
Place of birth - Born in state of residence (%) - American Indian and Alaska Native
Place of birth - Born in state of residence (%) - Multirace
Place of birth - Born in state of residence (%) - Other Race
Place of birth - Born in other state (%)
Place of birth - Born in other state (%) - White
Place of birth - Born in other state (%) - Black or African American
Place of birth - Born in other state (%) - Asian
Place of birth - Born in other state (%) - Hispanic or Latino
Place of birth - Born in other state (%) - American Indian and Alaska Native
Place of birth - Born in other state (%) - Multirace
Place of birth - Born in other state (%) - Other Race
Place of birth - Native, outside of US (%)
Place of birth - Native, outside of US (%) - White
Place of birth - Native, outside of US (%) - Black or African American
Place of birth - Native, outside of US (%) - Asian
Place of birth - Native, outside of US (%) - Hispanic or Latino
Place of birth - Native, outside of US (%) - American Indian and Alaska Native
Place of birth - Native, outside of US (%) - Multirace
Place of birth - Native, outside of US (%) - Other Race
Place of birth - Foreign born (%)
Place of birth - Foreign born (%) - White
Place of birth - Foreign born (%) - Black or African American
Place of birth - Foreign born (%) - Asian
Place of birth - Foreign born (%) - Hispanic or Latino
Place of birth - Foreign born (%) - American Indian and Alaska Native
Place of birth - Foreign born (%) - Multirace
Place of birth - Foreign born (%) - Other Race
Residents speaking English at home (%)
Residents speaking English at home - Born in the United States (%)
Residents speaking English at home - Native, born elsewhere (%)
Residents speaking English at home - Foreign born (%)
Residents speaking Spanish at home (%)
Residents speaking Spanish at home - Born in the United States (%)
Residents speaking Spanish at home - Native, born elsewhere (%)
Residents speaking Spanish at home - Foreign born (%)
Residents speaking other language at home (%)
Residents speaking other language at home - Born in the United States (%)
Residents speaking other language at home - Native, born elsewhere (%)
Residents speaking other language at home - Foreign born (%)
Marital status - Never married (%)
Marital status - Now married (%)
Marital status - Separated (%)
Marital status - Widowed (%)
Marital status - Divorced (%)
Ancestries Reported - Arab (%)
Ancestries Reported - Czech (%)
Ancestries Reported - Danish (%)
Ancestries Reported - Dutch (%)
Ancestries Reported - English (%)
Ancestries Reported - French (%)
Ancestries Reported - French Canadian (%)
Ancestries Reported - German (%)
Ancestries Reported - Greek (%)
Ancestries Reported - Hungarian (%)
Ancestries Reported - Irish (%)
Ancestries Reported - Italian (%)
Ancestries Reported - Lithuanian (%)
Ancestries Reported - Norwegian (%)
Ancestries Reported - Polish (%)
Ancestries Reported - Portuguese (%)
Ancestries Reported - Russian (%)
Ancestries Reported - Scotch-Irish (%)
Ancestries Reported - Scottish (%)
Ancestries Reported - Slovak (%)
Ancestries Reported - Subsaharan African (%)
Ancestries Reported - Swedish (%)
Ancestries Reported - Swiss (%)
Ancestries Reported - Ukrainian (%)
Ancestries Reported - United States (%)
Ancestries Reported - Welsh (%)
Ancestries Reported - West Indian (%)
Ancestries Reported - Other (%)
Geographical mobility - Same house 1 year ago (%)
Geographical mobility - Same house 1 year ago (%) - White
Geographical mobility - Same house 1 year ago (%) - Black or African American
Geographical mobility - Same house 1 year ago (%) - Asian
Geographical mobility - Same house 1 year ago (%) - Hispanic or Latino
Geographical mobility - Same house 1 year ago (%) - American Indian and Alaska Native
Geographical mobility - Same house 1 year ago (%) - Multirace
Geographical mobility - Same house 1 year ago (%) - Other Race
Geographical mobility - Moved within same county (%)
Geographical mobility - Moved within same county (%) - White
Geographical mobility - Moved within same county (%) - Black or African American
Geographical mobility - Moved within same county (%) - Asian
Geographical mobility - Moved within same county (%) - Hispanic or Latino
Geographical mobility - Moved within same county (%) - American Indian and Alaska Native
Geographical mobility - Moved within same county (%) - Multirace
Geographical mobility - Moved within same county (%) - Other Race
Geographical mobility - Moved from different county within same state (%)
Geographical mobility - Moved from different county within same state (%) - White
Geographical mobility - Moved from different county within same state (%) - Black or African American
Geographical mobility - Moved from different county within same state (%) - Asian
Geographical mobility - Moved from different county within same state (%) - Hispanic or Latino
Geographical mobility - Moved from different county within same state (%) - American Indian and Alaska Native
Geographical mobility - Moved from different county within same state (%) - Multirace
Geographical mobility - Moved from different county within same state (%) - Other Race
Geographical mobility - Moved from different state (%)
Geographical mobility - Moved from different state (%) - White
Geographical mobility - Moved from different state (%) - Black or African American
Geographical mobility - Moved from different state (%) - Asian
Geographical mobility - Moved from different state (%) - Hispanic or Latino
Geographical mobility - Moved from different state (%) - American Indian and Alaska Native
Geographical mobility - Moved from different state (%) - Multirace
Geographical mobility - Moved from different state (%) - Other Race
Geographical mobility - Moved from abroad (%)
Geographical mobility - Moved from abroad (%) - White
Geographical mobility - Moved from abroad (%) - Black or African American
Geographical mobility - Moved from abroad (%) - Asian
Geographical mobility - Moved from abroad (%) - Hispanic or Latino
Geographical mobility - Moved from abroad (%) - American Indian and Alaska Native
Geographical mobility - Moved from abroad (%) - Multirace
Geographical mobility - Moved from abroad (%) - Other Race
Place of birth for the foreign-born population - Ireland (%)
Place of birth for the foreign-born population - Denmark (%)
Place of birth for the foreign-born population - Norway (%)
Place of birth for the foreign-born population - Sweden (%)
Place of birth for the foreign-born population - United Kingdom (%)
Place of birth for the foreign-born population - England (%)
Place of birth for the foreign-born population - Scotland (%)
Place of birth for the foreign-born population - Other Northern Europe (%)
Place of birth for the foreign-born population - Austria (%)
Place of birth for the foreign-born population - Belgium (%)
Place of birth for the foreign-born population - France (%)
Place of birth for the foreign-born population - Germany (%)
Place of birth for the foreign-born population - Netherlands (%)
Place of birth for the foreign-born population - Switzerland (%)
Place of birth for the foreign-born population - Other Western Europe (%)
Place of birth for the foreign-born population - Greece (%)
Place of birth for the foreign-born population - Italy (%)
Place of birth for the foreign-born population - Portugal (%)
Place of birth for the foreign-born population - Spain (%)
Place of birth for the foreign-born population - Other Southern Europe (%)
Place of birth for the foreign-born population - Albania (%)
Place of birth for the foreign-born population - Belarus (%)
Place of birth for the foreign-born population - Bosnia and Herzegovina (%)
Place of birth for the foreign-born population - Bulgaria (%)
Place of birth for the foreign-born population - Croatia (%)
Place of birth for the foreign-born population - Czechoslovakia (%)
Place of birth for the foreign-born population - Hungary (%)
Place of birth for the foreign-born population - Latvia (%)
Place of birth for the foreign-born population - Lithuania (%)
Place of birth for the foreign-born population - North Macedonia (Macedonia) (%)
Place of birth for the foreign-born population - Moldova (%)
Place of birth for the foreign-born population - Poland (%)
Place of birth for the foreign-born population - Romania (%)
Place of birth for the foreign-born population - Russia (%)
Place of birth for the foreign-born population - Serbia (%)
Place of birth for the foreign-born population - Ukraine (%)
Place of birth for the foreign-born population - Other Eastern Europe (%)
Place of birth for the foreign-born population - China (%)
Place of birth for the foreign-born population - Hong Kong (%)
Place of birth for the foreign-born population - Taiwan (%)
Place of birth for the foreign-born population - Japan (%)
Place of birth for the foreign-born population - Korea (%)
Place of birth for the foreign-born population - Other Eastern Asia (%)
Place of birth for the foreign-born population - Afghanistan (%)
Place of birth for the foreign-born population - Bangladesh (%)
Place of birth for the foreign-born population - India (%)
Place of birth for the foreign-born population - Iran (%)
Place of birth for the foreign-born population - Kazakhstan (%)
Place of birth for the foreign-born population - Nepal (%)
Place of birth for the foreign-born population - Pakistan (%)
Place of birth for the foreign-born population - Sri Lanka (%)
Place of birth for the foreign-born population - Uzbekistan (%)
Place of birth for the foreign-born population - Other South Central Asia (%)
Place of birth for the foreign-born population - Burma (%)
Place of birth for the foreign-born population - Cambodia (%)
Place of birth for the foreign-born population - Indonesia (%)
Place of birth for the foreign-born population - Laos (%)
Place of birth for the foreign-born population - Malaysia (%)
Place of birth for the foreign-born population - Philippines (%)
Place of birth for the foreign-born population - Singapore (%)
Place of birth for the foreign-born population - Thailand (%)
Place of birth for the foreign-born population - Vietnam (%)
Place of birth for the foreign-born population - Other South Eastern Asia (%)
Place of birth for the foreign-born population - Armenia (%)
Place of birth for the foreign-born population - Iraq (%)
Place of birth for the foreign-born population - Israel (%)
Place of birth for the foreign-born population - Jordan (%)
Place of birth for the foreign-born population - Kuwait (%)
Place of birth for the foreign-born population - Lebanon (%)
Place of birth for the foreign-born population - Saudi Arabia (%)
Place of birth for the foreign-born population - Syria (%)
Place of birth for the foreign-born population - Turkey (%)
Place of birth for the foreign-born population - Yemen (%)
Place of birth for the foreign-born population - Other Western Asia (%)
Place of birth for the foreign-born population - Eritrea (%)
Place of birth for the foreign-born population - Ethiopia (%)
Place of birth for the foreign-born population - Kenya (%)
Place of birth for the foreign-born population - Somalia (%)
Place of birth for the foreign-born population - Uganda (%)
Place of birth for the foreign-born population - Zimbabwe (%)
Place of birth for the foreign-born population - Other Eastern Africa (%)
Place of birth for the foreign-born population - Cameroon (%)
Place of birth for the foreign-born population - Congo (%)
Place of birth for the foreign-born population - Democratic Republic of Congo (Zaire) (%)
Place of birth for the foreign-born population - Other Middle Africa (%)
Place of birth for the foreign-born population - Egypt (%)
Place of birth for the foreign-born population - Morocco (%)
Place of birth for the foreign-born population - Sudan (%)
Place of birth for the foreign-born population - Other Northern Africa (%)
Place of birth for the foreign-born population - South Africa (%)
Place of birth for the foreign-born population - Other Southern Africa (%)
Place of birth for the foreign-born population - Cabo Verde (%)
Place of birth for the foreign-born population - Ghana (%)
Place of birth for the foreign-born population - Liberia (%)
Place of birth for the foreign-born population - Nigeria (%)
Place of birth for the foreign-born population - Senegal (%)
Place of birth for the foreign-born population - Sierra Leone (%)
Place of birth for the foreign-born population - Other Western Africa (%)
Place of birth for the foreign-born population - Australia (%)
Place of birth for the foreign-born population - New Zealand (%)
Place of birth for the foreign-born population - Fiji (%)
Place of birth for the foreign-born population - Micronesia (%)
Place of birth for the foreign-born population - Bahamas (%)
Place of birth for the foreign-born population - Barbados (%)
Place of birth for the foreign-born population - Cuba (%)
Place of birth for the foreign-born population - Dominica (%)
Place of birth for the foreign-born population - Dominican Republic (%)
Place of birth for the foreign-born population - Grenada (%)
Place of birth for the foreign-born population - Haiti (%)
Place of birth for the foreign-born population - Jamaica (%)
Place of birth for the foreign-born population - St. Vincent and the Grenadines (%)
Place of birth for the foreign-born population - Trinidad and Tobago (%)
Place of birth for the foreign-born population - West Indies (%)
Place of birth for the foreign-born population - Other Caribbean (%)
Place of birth for the foreign-born population - Belize (%)
Place of birth for the foreign-born population - Costa Rica (%)
Place of birth for the foreign-born population - El Salvador (%)
Place of birth for the foreign-born population - Guatemala (%)
Place of birth for the foreign-born population - Honduras (%)
Place of birth for the foreign-born population - Mexico (%)
Place of birth for the foreign-born population - Nicaragua (%)
Place of birth for the foreign-born population - Panama (%)
Place of birth for the foreign-born population - Other Central America (%)
Place of birth for the foreign-born population - Argentina (%)
Place of birth for the foreign-born population - Bolivia (%)
Place of birth for the foreign-born population - Brazil (%)
Place of birth for the foreign-born population - Chile (%)
Place of birth for the foreign-born population - Colombia (%)
Place of birth for the foreign-born population - Ecuador (%)
Place of birth for the foreign-born population - Guyana (%)
Place of birth for the foreign-born population - Peru (%)
Place of birth for the foreign-born population - Uruguay (%)
Place of birth for the foreign-born population - Venezuela (%)
Place of birth for the foreign-born population - Other South America (%)
Place of birth for the foreign-born population - Canada (%)
Place of birth for the foreign-born population - Other Northern America (%)
Place of birth for the foreign-born population - Other (%)
Latest news about races in Duluth, GA collected exclusively by city-data.com from local newspapers, TV, and radio stations
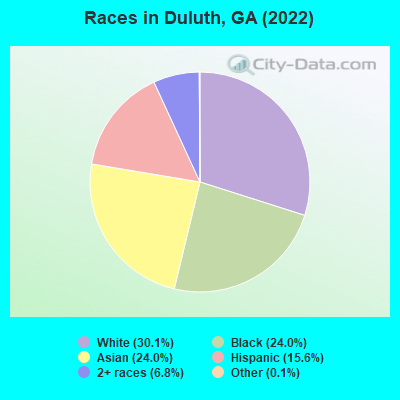
According to 2022 data, the most numerous races in Duluth, GA are White alone (9,735 residents), Black alone (7,761 residents), and Hispanic (5,036 residents). 60.8% of Duluth residents speak English at home. 30.9% of Duluth, GA residents are foreign-born (18.6% born in Asia, 7.1% born in Latin America), which is 67.7% greater than the foreign-born rate of 10.0% across the entire state of Georgia.
Race distribution in Duluth
2000 2022
5,128,661 62.6% White alone 2,331,465 28.5% Black alone 435,227 5.3% Hispanic 171,513 2.1% Asian alone 87,364 1.1% Two or more races 17,670 0.2% American Indian alone 11,275 0.1% Other race alone 3,278 0.04% Native Hawaiian and Other
5,415,657 49.6% White alone 3,349,240 30.7% Black alone 1,132,604 10.4% Hispanic 479,156 4.4% Asian alone 462,923 4.2% Two or more races 54,416 0.5% Other race alone 11,923 0.1% American Indian alone 6,957 0.06% Native Hawaiian and Other
Income and house value in Duluth Median household income in 2022 $83,617 White non-Hispanic householders$83,720 Black householders$88,962 Asian householders$99,495 Some other race householders$129,775 Two or more races householders$130,560 Hispanic or Latino race householdersMedian 2022 house value $413,657 White Non-Hispanic householders$405,956 Black or African American householders$89,387 American Indian or Alaska Native householders $463,439 Asian householders$391,929 Some other race householders$435,110 Two or more races householders$419,983 Hispanic or Latino householders
Median age by race in Duluth
47.7 Median age for White residents45.8 52.6 32.3 Median age for Black or African American residents34.0 31.8 -626,666,666.0 Median age for American Indian / Alaska Native residents-574,468,084.5 -732,307,691.6 41.4 Median age for Asian residents43.2 40.6 -1,080,291,969.7 Median age for Native Hawaiian / Pacific Islander residents-1,248,062,014.3 -776,776,776.0 23.1 Median age for Other race residents25.8 21.2 24.9 Median age for Two or more races residents25.3 24.3 50.1 Median age for White alone residents47.4 52.9 27.9 Median age for Hispanic or Latino residents29.2 25.5
Owner/renter occupied households by race in Duluth
House owners and renters - White residents 3,477 72.8% Owner occupied1,300 27.2% Renter occupiedHouse owners and renters - Black or African American residents 925 30.2% Owner occupied2,140 69.8% Renter occupiedHouse owners and renters - Asian residents 1,907 57.3% Owner occupied1,419 42.7% Renter occupiedHouse owners and renters - Other race residents 117 19.4% Owner occupied485 80.6% Renter occupiedHouse owners and renters - Two or more races residents 591 62.7% Owner occupied351 37.3% Renter occupiedHouse owners and renters - White alone residents 3,435 73.0% Owner occupied1,269 27.0% Renter occupiedHouse owners and renters - Hispanic or Latino residents 581 43.3% Owner occupied759 56.7% Renter occupied
Language usage in Duluth
English speakers - Total 60.8% of residents of Duluth speak English at home.
12.7% of residents speak Spanish at home 1,619 42.3% Speak English very well2,208 57.7% Speak English less than very well27.1% of residents speak other language at home 4,463 54.5% Speak English very well3,729 45.5% Speak English less than very well
English speakers - Born in the United States 91.2% of residents of Duluth speak English at home.
4.8% of residents speak Spanish at home 426 91.6% Speak English very well39 8.4% Speak English less than very well4.0% of residents speak other language at home 382 97.4% Speak English very well10 2.6% Speak English less than very well
English speakers - Native, born elsewhere 33.3% of residents of Duluth speak English at home.
70.4% of residents speak Spanish at home 97 10.5% Speak English very well827 89.5% Speak English less than very well10.7% of residents speak other language at home 80 57.1% Speak English very well60 42.9% Speak English less than very well
English speakers - Foreign-born 12.1% of residents of Duluth speak English at home.
19.9% of residents speak Spanish at home 599 30.6% Speak English very well1,361 69.4% Speak English less than very well68.8% of residents speak other language at home 3,247 47.9% Speak English very well3,528 52.1% Speak English less than very well
White (Caucasian) - Speak only English Native:
95.1% (8,138)Foreign-born:
14.6% (158)
White (Caucasian) - Speak another language Native:
5.5% (469)Foreign-born:
85.1% (920)
Black or African American - Speak only English Native:
97.4% (6,233)Foreign-born:
46.8% (426)
Black or African American - Speak another language Native:
2.7% (174)Foreign-born:
52.9% (481)
Asian - Speak only English Native:
42.2% (682)Foreign-born:
6.8% (396)
Asian - Speak another language Native:
57.1% (922)Foreign-born:
93.4% (5,453)
Other race - Speak only English Native:
9.7% (110)Foreign-born:
14.7% (188)
Other race - Speak another language Native:
90.6% (1,032)Foreign-born:
86.2% (1,107)
Two or more races - Speak only English Native:
77.0% (2,236)Foreign-born:
3.1% (13)
Two or more races - Speak another language Native:
25.0% (726)Foreign-born:
98.1% (402)
White alone - Speak only English Native:
96.4% (8,040)Foreign-born:
17.3% (164)
White alone - Speak another language Native:
3.6% (304)Foreign-born:
83.1% (788)
Hispanic or Latino - Speak only English Native:
30.0% (726)Foreign-born:
8.6% (184)
Hispanic or Latino - Speak another language Native:
70.2% (1,700)Foreign-born:
92.3% (1,964)
Foreign-born residents in Duluth 9,992 residents are foreign born (18.6% Asia , 7.1% Latin America ).
This city:
30.9%Georgia:
10.4%
Marital status for residents in Duluth Marital status - White (Caucasian) population 15 years and over
Males 23.5% Never married63.2% Now married0.1% Separated1.1% Widowed12.2% DivorcedFemales 21.9% Never married53.9% Now married1.0% Separated9.5% Widowed13.7% DivorcedWomen who gave birth in the past 12 months Now married:
92.6% (106)Unmarried:
7.4% (8)
Women who did not give birth in the past 12 months Now married:
53.2% (935)Unmarried:
46.8% (823)
Marital status - Black or African American population 15 years and over
Males 34.8% Never married54.7% Now married0.5% Separated0.9% Widowed9.2% DivorcedFemales 50.2% Never married32.1% Now married3.2% Separated0.6% Widowed13.9% DivorcedWomen who gave birth in the past 12 months Now married:
100.0% (30)Unmarried:
0.0% (0)
Women who did not give birth in the past 12 months Now married:
25.5% (723)Unmarried:
74.5% (2,111)
Marital status - Asian population 15 years and over
Males 31.5% Never married65.7% Now married0.0% Separated0.5% Widowed2.3% DivorcedFemales 21.3% Never married62.0% Now married1.5% Separated10.8% Widowed4.5% DivorcedWomen who gave birth in the past 12 months Now married:
100.0% (32)Unmarried:
0.0% (0)
Women who did not give birth in the past 12 months Now married:
65.9% (1,400)Unmarried:
34.1% (724)
Marital status - Other race population 15 years and over
Males 45.2% Never married45.1% Now married0.0% Separated0.0% Widowed9.7% DivorcedFemales 48.8% Never married32.6% Now married3.9% Separated0.0% Widowed14.7% DivorcedWomen who gave birth in the past 12 months Now married:
28.6% (31)Unmarried:
71.4% (76)
Women who did not give birth in the past 12 months Now married:
38.9% (283)Unmarried:
61.1% (445)
Marital status - Two or more races population 15 years and over
Males 42.5% Never married50.3% Now married0.0% Separated0.0% Widowed7.2% DivorcedFemales 54.7% Never married40.0% Now married1.0% Separated0.0% Widowed4.3% DivorcedWomen who gave birth in the past 12 months Now married:
0.0% (0)Unmarried:
100.0% (22)
Women who did not give birth in the past 12 months Now married:
43.4% (311)Unmarried:
56.6% (405)
Marital status - White alone, not Hispanic / Latino population 15 years and over
Males 23.5% Never married61.8% Now married0.1% Separated1.2% Widowed13.4% DivorcedFemales 22.7% Never married53.0% Now married1.0% Separated9.0% Widowed14.3% DivorcedWomen who gave birth in the past 12 months Now married:
87.5% (65)Unmarried:
12.5% (9)
Women who did not give birth in the past 12 months Now married:
51.0% (910)Unmarried:
49.0% (876)
Marital status - Hispanic or Latino population 15 years and over
Males 35.8% Never married56.3% Now married0.0% Separated0.0% Widowed7.9% DivorcedFemales 37.4% Never married46.0% Now married2.4% Separated3.8% Widowed10.4% DivorcedWomen who gave birth in the past 12 months Now married:
50.6% (82)Unmarried:
49.4% (80)
Women who did not give birth in the past 12 months Now married:
45.0% (503)Unmarried:
55.0% (615)
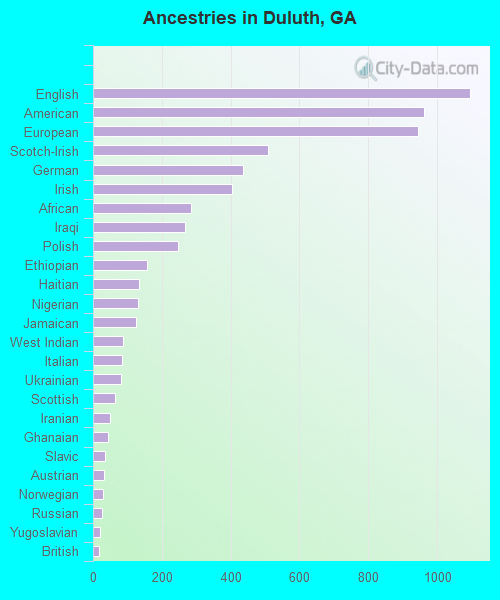
Ancestries in Duluth
1,096 5.6% English962 5.0% American945 4.9% European509 2.6% Scotch-Irish437 2.3% German403 2.1% Irish286 1.5% African266 1.4% Iraqi248 1.3% Polish156 0.8% Ethiopian135 0.7% Haitian130 0.7% Nigerian124 0.6% Jamaican88 0.5% West Indian84 0.4% Italian81 0.4% Ukrainian65 0.3% Scottish49 0.3% Iranian44 0.2% Ghanaian35 0.2% Slavic32 0.2% Austrian30 0.2% Norwegian27 0.1% Russian19 0.10% Yugoslavian17 0.09% British17 0.09% South African15 0.08% Arab13 0.07% Pennsylvania German13 0.07% Welsh12 0.06% Dutch9 0.05% French Canadian7 0.04% French7 0.04% Northern European6 0.03% Romanian6 0.03% Swedish4 0.02% Greek
Geographical mobility in Duluth Same house 1 year ago 8,857 87.2% White (Caucasian)6,953 90.3% Black or African American35 99.5% American Indian / Alaska Native6,319 81.6% Asian1,876 69.7% Other race3,337 88.7% Two or more races8,549 88.7% White alone, not Hispanic / Latino3,807 76.2% Hispanic or LatinoMoved within same county 611 6.0% White / Caucasian607 7.9% Black or African American385 5.0% Asian865 32.1% Other race426 11.3% Two or more races379 3.9% White alone, not Hispanic / Latino1,127 22.6% Hispanic or LatinoMoved within same state 461 4.5% White / Caucasian47 0.6% Black or African American200 2.6% Asian110 4.1% Other race8 0.2% Two or more races486 5.0% White alone, not Hispanic / Latino55 1.1% Hispanic or LatinoMoved from different state 173 1.7% White / Caucasian158 2.1% Black or African American326 4.2% Asian18 0.7% Other race8 0.2% Two or more races183 1.9% White alone, not Hispanic / Latino19 0.4% Hispanic or LatinoMoved from abroad 15 0.2% White20 0.3% Black or African American409 5.3% Asian11 0.4% Other race69 1.8% Two or more races11 0.1% White alone, not Hispanic / Latino9 0.2% Hispanic or Latino
Children Nativity (place of birth) in Duluth
Children under 6 years - Living with two parents Both parents native 624 99.7% Native2 0.3% Foreign-bornBoth parents foreign-born 279 69.0% Native126 31.0% Foreign-bornOne native, one foreign-born parent 363 100.0% NativeChildren under 6 years - Living with one parent Native parent 602 99.8% Native1 0.2% Foreign-bornForeign-born parent 168 63.8% Native95 36.2% Foreign-bornChildren 6 to 17 years - Living with two parents Both parents native 1,266 100.0% NativeBoth parents foreign-born 758 66.7% Native379 33.3% Foreign-bornOne native, one foreign-born parent 457 87.6% Native64 12.4% Foreign-bornChildren 6 to 17 years - Living with one parent Native parent 1,201 100.0% NativeForeign-born parent 431 60.3% Native284 39.7% Foreign-born
Grandparents responsible for own grandchildren in Duluth
Grandparents (30 to 59 years) White / Caucasian 20 100.0% Not responsible for grandchildrenBlack or African American 58 36.7% Responsible for grandchildren101 63.3% Not responsible for grandchildrenOther race 58 100.0% Not responsible for grandchildrenTwo or more races 9 100.0% Responsible for grandchildrenWhite alone, not Hispanic / Latino 21 100.0% Not responsible for grandchildrenHispanic or Latino 6 11.8% Responsible for grandchildren45 88.2% Not responsible for grandchildrenGrandparents (60 years and over) White / Caucasian 86 31.3% Responsible for grandchildren189 68.7% Not responsible for grandchildrenBlack or African American 148 72.4% Responsible for grandchildren56 27.6% Not responsible for grandchildrenTwo or more races 202 100.0% Not responsible for grandchildrenWhite alone, not Hispanic / Latino 86 29.7% Responsible for grandchildren204 70.3% Not responsible for grandchildren