Races in Douglasville, Georgia (GA) Detailed Stats
Data:
Races - White alone (%)
Races - White alone (% change since 2000)
Races - Black alone (%)
Races - Black alone (% change since 2000)
Races - American Indian alone (%)
Races - American Indian alone (% change since 2000)
Races - Asian alone (%)
Races - Asian alone (% change since 2000)
Races - Hispanic (%)
Races - Hispanic (% change since 2000)
Races - Native Hawaiian and Other Pacific Islander alone (%)
Races - Native Hawaiian and Other Pacific Islander alone (% change since 2000)
Races - Two or more races(%)
Races - Two or more races(% change since 2000)
Races - Other race alone (%)
Races - Other race alone (% change since 2000)
Racial diversity
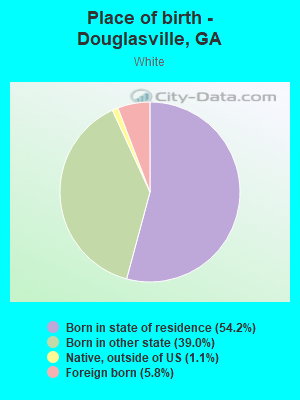
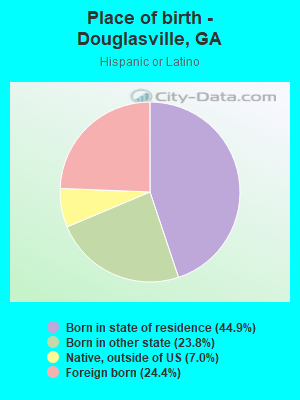
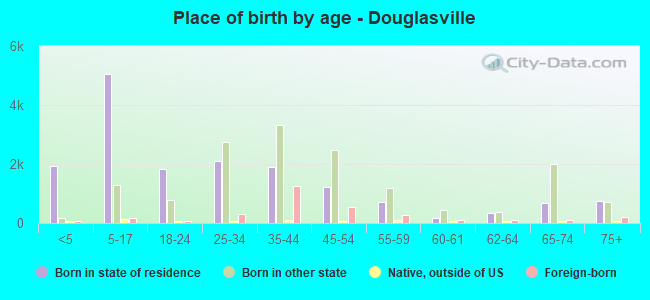
Place of birth - Born in state of residence (%)
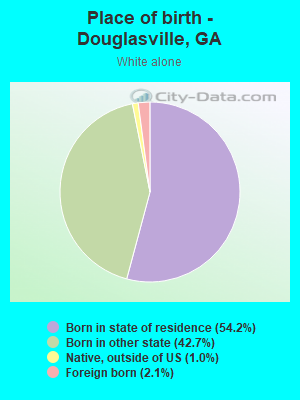
Place of birth - Born in state of residence (%) - White
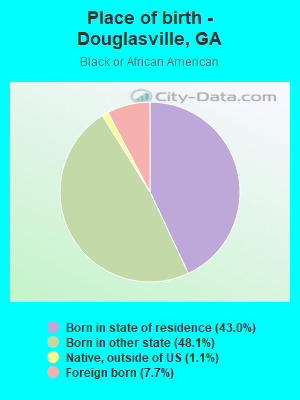
Place of birth - Born in state of residence (%) - Black or African American
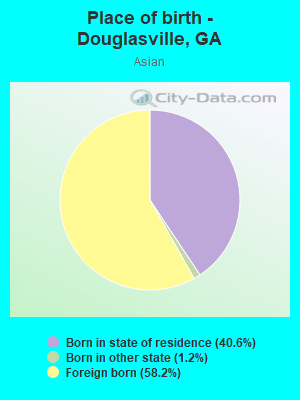
Place of birth - Born in state of residence (%) - Asian
Place of birth - Born in state of residence (%) - Hispanic or Latino
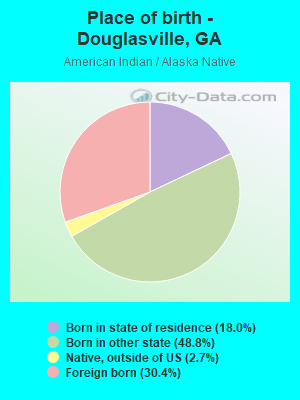
Place of birth - Born in state of residence (%) - American Indian and Alaska Native
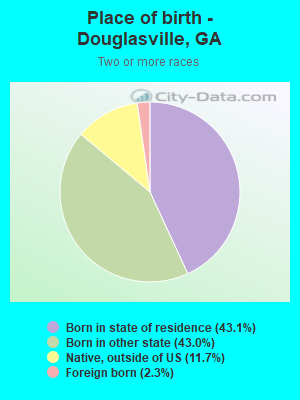
Place of birth - Born in state of residence (%) - Multirace
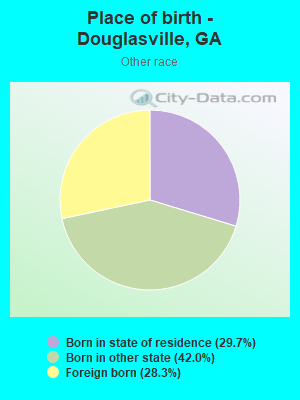
Place of birth - Born in state of residence (%) - Other Race
Place of birth - Born in other state (%)
Place of birth - Born in other state (%) - White
Place of birth - Born in other state (%) - Black or African American
Place of birth - Born in other state (%) - Asian
Place of birth - Born in other state (%) - Hispanic or Latino
Place of birth - Born in other state (%) - American Indian and Alaska Native
Place of birth - Born in other state (%) - Multirace
Place of birth - Born in other state (%) - Other Race
Place of birth - Native, outside of US (%)
Place of birth - Native, outside of US (%) - White
Place of birth - Native, outside of US (%) - Black or African American
Place of birth - Native, outside of US (%) - Asian
Place of birth - Native, outside of US (%) - Hispanic or Latino
Place of birth - Native, outside of US (%) - American Indian and Alaska Native
Place of birth - Native, outside of US (%) - Multirace
Place of birth - Native, outside of US (%) - Other Race
Place of birth - Foreign born (%)
Place of birth - Foreign born (%) - White
Place of birth - Foreign born (%) - Black or African American
Place of birth - Foreign born (%) - Asian
Place of birth - Foreign born (%) - Hispanic or Latino
Place of birth - Foreign born (%) - American Indian and Alaska Native
Place of birth - Foreign born (%) - Multirace
Place of birth - Foreign born (%) - Other Race
Residents speaking English at home (%)
Residents speaking English at home - Born in the United States (%)
Residents speaking English at home - Native, born elsewhere (%)
Residents speaking English at home - Foreign born (%)
Residents speaking Spanish at home (%)
Residents speaking Spanish at home - Born in the United States (%)
Residents speaking Spanish at home - Native, born elsewhere (%)
Residents speaking Spanish at home - Foreign born (%)
Residents speaking other language at home (%)
Residents speaking other language at home - Born in the United States (%)
Residents speaking other language at home - Native, born elsewhere (%)
Residents speaking other language at home - Foreign born (%)
Marital status - Never married (%)
Marital status - Now married (%)
Marital status - Separated (%)
Marital status - Widowed (%)
Marital status - Divorced (%)
Ancestries Reported - Arab (%)
Ancestries Reported - Czech (%)
Ancestries Reported - Danish (%)
Ancestries Reported - Dutch (%)
Ancestries Reported - English (%)
Ancestries Reported - French (%)
Ancestries Reported - French Canadian (%)
Ancestries Reported - German (%)
Ancestries Reported - Greek (%)
Ancestries Reported - Hungarian (%)
Ancestries Reported - Irish (%)
Ancestries Reported - Italian (%)
Ancestries Reported - Lithuanian (%)
Ancestries Reported - Norwegian (%)
Ancestries Reported - Polish (%)
Ancestries Reported - Portuguese (%)
Ancestries Reported - Russian (%)
Ancestries Reported - Scotch-Irish (%)
Ancestries Reported - Scottish (%)
Ancestries Reported - Slovak (%)
Ancestries Reported - Subsaharan African (%)
Ancestries Reported - Swedish (%)
Ancestries Reported - Swiss (%)
Ancestries Reported - Ukrainian (%)
Ancestries Reported - United States (%)
Ancestries Reported - Welsh (%)
Ancestries Reported - West Indian (%)
Ancestries Reported - Other (%)
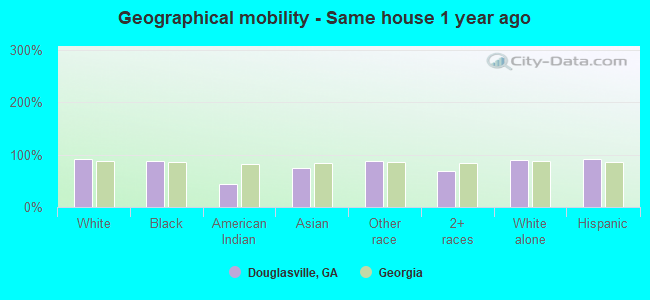
Geographical mobility - Same house 1 year ago (%)
Geographical mobility - Same house 1 year ago (%) - White
Geographical mobility - Same house 1 year ago (%) - Black or African American
Geographical mobility - Same house 1 year ago (%) - Asian
Geographical mobility - Same house 1 year ago (%) - Hispanic or Latino
Geographical mobility - Same house 1 year ago (%) - American Indian and Alaska Native
Geographical mobility - Same house 1 year ago (%) - Multirace
Geographical mobility - Same house 1 year ago (%) - Other Race
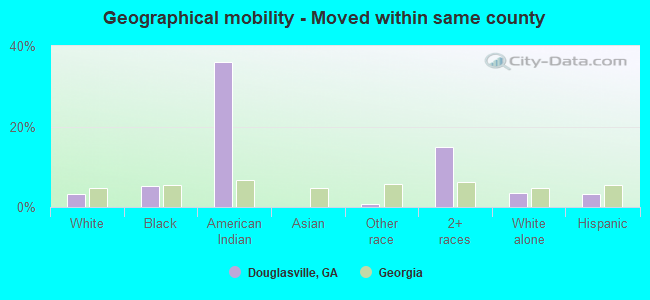
Geographical mobility - Moved within same county (%)
Geographical mobility - Moved within same county (%) - White
Geographical mobility - Moved within same county (%) - Black or African American
Geographical mobility - Moved within same county (%) - Asian
Geographical mobility - Moved within same county (%) - Hispanic or Latino
Geographical mobility - Moved within same county (%) - American Indian and Alaska Native
Geographical mobility - Moved within same county (%) - Multirace
Geographical mobility - Moved within same county (%) - Other Race
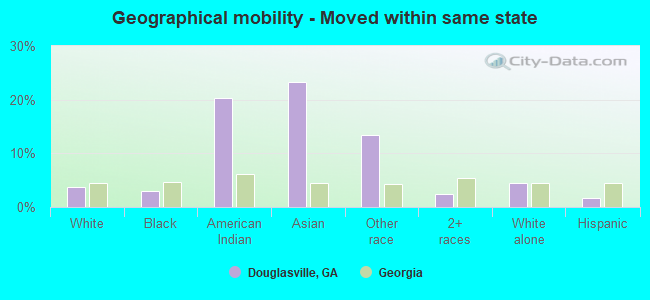
Geographical mobility - Moved from different county within same state (%)
Geographical mobility - Moved from different county within same state (%) - White
Geographical mobility - Moved from different county within same state (%) - Black or African American
Geographical mobility - Moved from different county within same state (%) - Asian
Geographical mobility - Moved from different county within same state (%) - Hispanic or Latino
Geographical mobility - Moved from different county within same state (%) - American Indian and Alaska Native
Geographical mobility - Moved from different county within same state (%) - Multirace
Geographical mobility - Moved from different county within same state (%) - Other Race
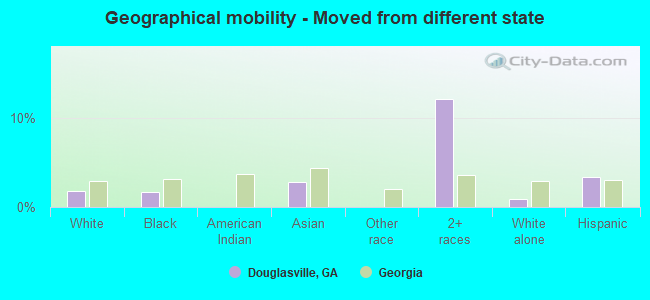
Geographical mobility - Moved from different state (%)
Geographical mobility - Moved from different state (%) - White
Geographical mobility - Moved from different state (%) - Black or African American
Geographical mobility - Moved from different state (%) - Asian
Geographical mobility - Moved from different state (%) - Hispanic or Latino
Geographical mobility - Moved from different state (%) - American Indian and Alaska Native
Geographical mobility - Moved from different state (%) - Multirace
Geographical mobility - Moved from different state (%) - Other Race
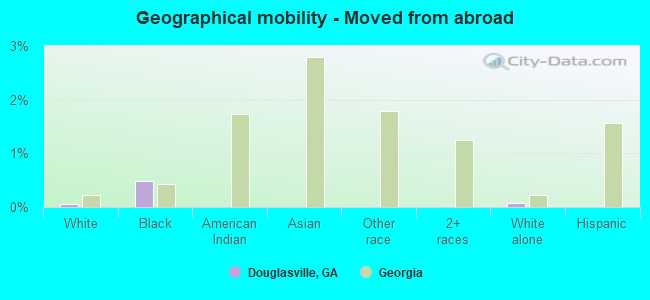
Geographical mobility - Moved from abroad (%)
Geographical mobility - Moved from abroad (%) - White
Geographical mobility - Moved from abroad (%) - Black or African American
Geographical mobility - Moved from abroad (%) - Asian
Geographical mobility - Moved from abroad (%) - Hispanic or Latino
Geographical mobility - Moved from abroad (%) - American Indian and Alaska Native
Geographical mobility - Moved from abroad (%) - Multirace
Geographical mobility - Moved from abroad (%) - Other Race
Place of birth for the foreign-born population - Ireland (%)
Place of birth for the foreign-born population - Denmark (%)
Place of birth for the foreign-born population - Norway (%)
Place of birth for the foreign-born population - Sweden (%)
Place of birth for the foreign-born population - United Kingdom (%)
Place of birth for the foreign-born population - England (%)
Place of birth for the foreign-born population - Scotland (%)
Place of birth for the foreign-born population - Other Northern Europe (%)
Place of birth for the foreign-born population - Austria (%)
Place of birth for the foreign-born population - Belgium (%)
Place of birth for the foreign-born population - France (%)
Place of birth for the foreign-born population - Germany (%)
Place of birth for the foreign-born population - Netherlands (%)
Place of birth for the foreign-born population - Switzerland (%)
Place of birth for the foreign-born population - Other Western Europe (%)
Place of birth for the foreign-born population - Greece (%)
Place of birth for the foreign-born population - Italy (%)
Place of birth for the foreign-born population - Portugal (%)
Place of birth for the foreign-born population - Spain (%)
Place of birth for the foreign-born population - Other Southern Europe (%)
Place of birth for the foreign-born population - Albania (%)
Place of birth for the foreign-born population - Belarus (%)
Place of birth for the foreign-born population - Bosnia and Herzegovina (%)
Place of birth for the foreign-born population - Bulgaria (%)
Place of birth for the foreign-born population - Croatia (%)
Place of birth for the foreign-born population - Czechoslovakia (%)
Place of birth for the foreign-born population - Hungary (%)
Place of birth for the foreign-born population - Latvia (%)
Place of birth for the foreign-born population - Lithuania (%)
Place of birth for the foreign-born population - North Macedonia (Macedonia) (%)
Place of birth for the foreign-born population - Moldova (%)
Place of birth for the foreign-born population - Poland (%)
Place of birth for the foreign-born population - Romania (%)
Place of birth for the foreign-born population - Russia (%)
Place of birth for the foreign-born population - Serbia (%)
Place of birth for the foreign-born population - Ukraine (%)
Place of birth for the foreign-born population - Other Eastern Europe (%)
Place of birth for the foreign-born population - China (%)
Place of birth for the foreign-born population - Hong Kong (%)
Place of birth for the foreign-born population - Taiwan (%)
Place of birth for the foreign-born population - Japan (%)
Place of birth for the foreign-born population - Korea (%)
Place of birth for the foreign-born population - Other Eastern Asia (%)
Place of birth for the foreign-born population - Afghanistan (%)
Place of birth for the foreign-born population - Bangladesh (%)
Place of birth for the foreign-born population - India (%)
Place of birth for the foreign-born population - Iran (%)
Place of birth for the foreign-born population - Kazakhstan (%)
Place of birth for the foreign-born population - Nepal (%)
Place of birth for the foreign-born population - Pakistan (%)
Place of birth for the foreign-born population - Sri Lanka (%)
Place of birth for the foreign-born population - Uzbekistan (%)
Place of birth for the foreign-born population - Other South Central Asia (%)
Place of birth for the foreign-born population - Burma (%)
Place of birth for the foreign-born population - Cambodia (%)
Place of birth for the foreign-born population - Indonesia (%)
Place of birth for the foreign-born population - Laos (%)
Place of birth for the foreign-born population - Malaysia (%)
Place of birth for the foreign-born population - Philippines (%)
Place of birth for the foreign-born population - Singapore (%)
Place of birth for the foreign-born population - Thailand (%)
Place of birth for the foreign-born population - Vietnam (%)
Place of birth for the foreign-born population - Other South Eastern Asia (%)
Place of birth for the foreign-born population - Armenia (%)
Place of birth for the foreign-born population - Iraq (%)
Place of birth for the foreign-born population - Israel (%)
Place of birth for the foreign-born population - Jordan (%)
Place of birth for the foreign-born population - Kuwait (%)
Place of birth for the foreign-born population - Lebanon (%)
Place of birth for the foreign-born population - Saudi Arabia (%)
Place of birth for the foreign-born population - Syria (%)
Place of birth for the foreign-born population - Turkey (%)
Place of birth for the foreign-born population - Yemen (%)
Place of birth for the foreign-born population - Other Western Asia (%)
Place of birth for the foreign-born population - Eritrea (%)
Place of birth for the foreign-born population - Ethiopia (%)
Place of birth for the foreign-born population - Kenya (%)
Place of birth for the foreign-born population - Somalia (%)
Place of birth for the foreign-born population - Uganda (%)
Place of birth for the foreign-born population - Zimbabwe (%)
Place of birth for the foreign-born population - Other Eastern Africa (%)
Place of birth for the foreign-born population - Cameroon (%)
Place of birth for the foreign-born population - Congo (%)
Place of birth for the foreign-born population - Democratic Republic of Congo (Zaire) (%)
Place of birth for the foreign-born population - Other Middle Africa (%)
Place of birth for the foreign-born population - Egypt (%)
Place of birth for the foreign-born population - Morocco (%)
Place of birth for the foreign-born population - Sudan (%)
Place of birth for the foreign-born population - Other Northern Africa (%)
Place of birth for the foreign-born population - South Africa (%)
Place of birth for the foreign-born population - Other Southern Africa (%)
Place of birth for the foreign-born population - Cabo Verde (%)
Place of birth for the foreign-born population - Ghana (%)
Place of birth for the foreign-born population - Liberia (%)
Place of birth for the foreign-born population - Nigeria (%)
Place of birth for the foreign-born population - Senegal (%)
Place of birth for the foreign-born population - Sierra Leone (%)
Place of birth for the foreign-born population - Other Western Africa (%)
Place of birth for the foreign-born population - Australia (%)
Place of birth for the foreign-born population - New Zealand (%)
Place of birth for the foreign-born population - Fiji (%)
Place of birth for the foreign-born population - Micronesia (%)
Place of birth for the foreign-born population - Bahamas (%)
Place of birth for the foreign-born population - Barbados (%)
Place of birth for the foreign-born population - Cuba (%)
Place of birth for the foreign-born population - Dominica (%)
Place of birth for the foreign-born population - Dominican Republic (%)
Place of birth for the foreign-born population - Grenada (%)
Place of birth for the foreign-born population - Haiti (%)
Place of birth for the foreign-born population - Jamaica (%)
Place of birth for the foreign-born population - St. Vincent and the Grenadines (%)
Place of birth for the foreign-born population - Trinidad and Tobago (%)
Place of birth for the foreign-born population - West Indies (%)
Place of birth for the foreign-born population - Other Caribbean (%)
Place of birth for the foreign-born population - Belize (%)
Place of birth for the foreign-born population - Costa Rica (%)
Place of birth for the foreign-born population - El Salvador (%)
Place of birth for the foreign-born population - Guatemala (%)
Place of birth for the foreign-born population - Honduras (%)
Place of birth for the foreign-born population - Mexico (%)
Place of birth for the foreign-born population - Nicaragua (%)
Place of birth for the foreign-born population - Panama (%)
Place of birth for the foreign-born population - Other Central America (%)
Place of birth for the foreign-born population - Argentina (%)
Place of birth for the foreign-born population - Bolivia (%)
Place of birth for the foreign-born population - Brazil (%)
Place of birth for the foreign-born population - Chile (%)
Place of birth for the foreign-born population - Colombia (%)
Place of birth for the foreign-born population - Ecuador (%)
Place of birth for the foreign-born population - Guyana (%)
Place of birth for the foreign-born population - Peru (%)
Place of birth for the foreign-born population - Uruguay (%)
Place of birth for the foreign-born population - Venezuela (%)
Place of birth for the foreign-born population - Other South America (%)
Place of birth for the foreign-born population - Canada (%)
Place of birth for the foreign-born population - Other Northern America (%)
Place of birth for the foreign-born population - Other (%)
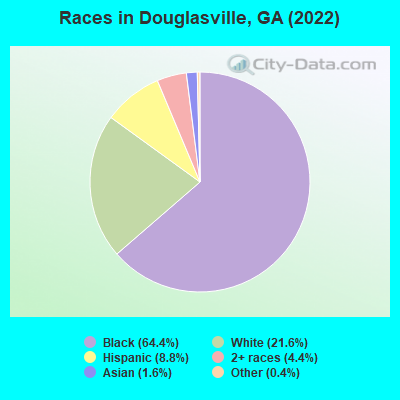
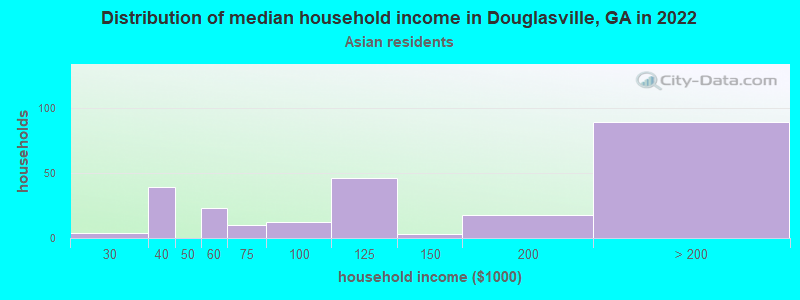
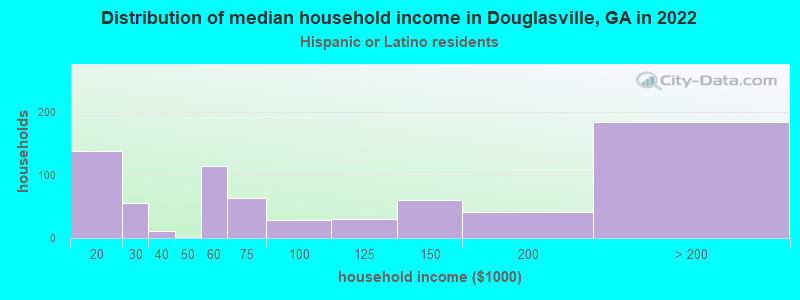
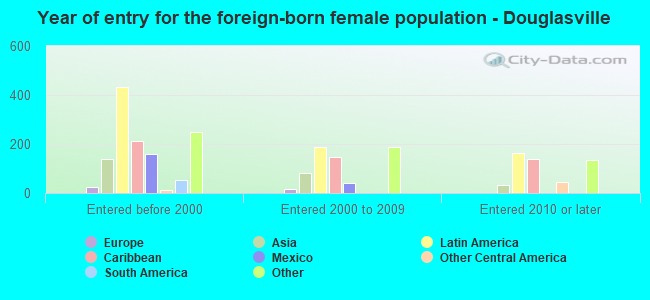
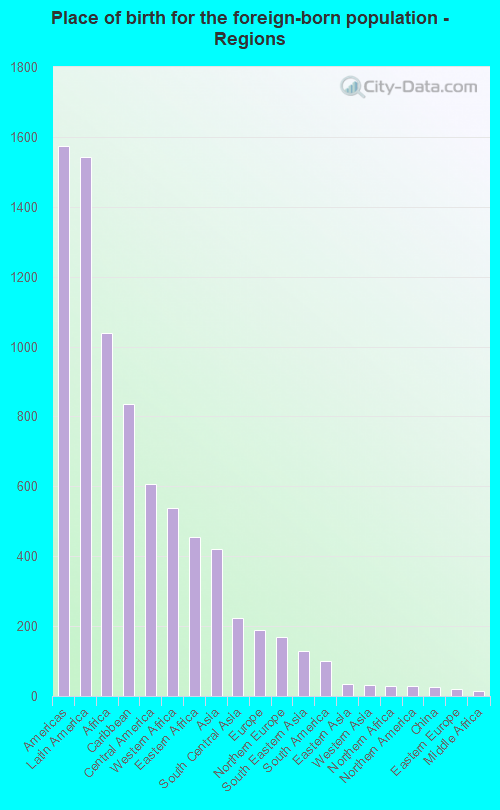
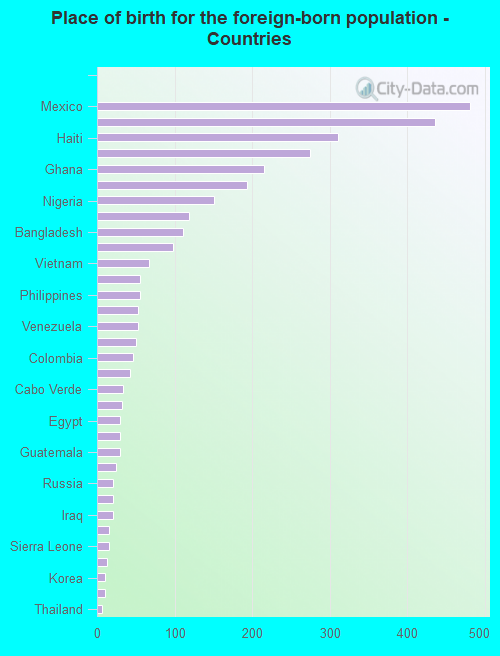
According to 2022 data, the most numerous races in Douglasville, GA are White alone (7,742 residents), Black alone (23,112 residents), and Hispanic (3,150 residents). 89.1% of Douglasville residents speak English at home. 9.0% of Douglasville, GA residents are foreign-born (4.2% born in Latin America, 2.8% born in Africa, 1.1% born in Asia), which is 11.3% less than the foreign-born rate of 10.0% across the entire state of Georgia.
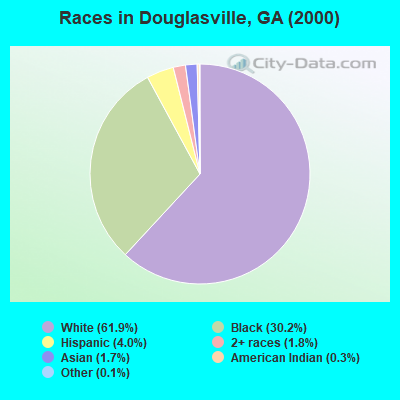
Race distribution in Douglasville
2000 2022
5,128,661 62.6% White alone 2,331,465 28.5% Black alone 435,227 5.3% Hispanic 171,513 2.1% Asian alone 87,364 1.1% Two or more races 17,670 0.2% American Indian alone 11,275 0.1% Other race alone 3,278 0.04% Native Hawaiian and Other
5,415,657 49.6% White alone 3,349,240 30.7% Black alone 1,132,604 10.4% Hispanic 479,156 4.4% Asian alone 462,923 4.2% Two or more races 54,416 0.5% Other race alone 11,923 0.1% American Indian alone 6,957 0.06% Native Hawaiian and Other
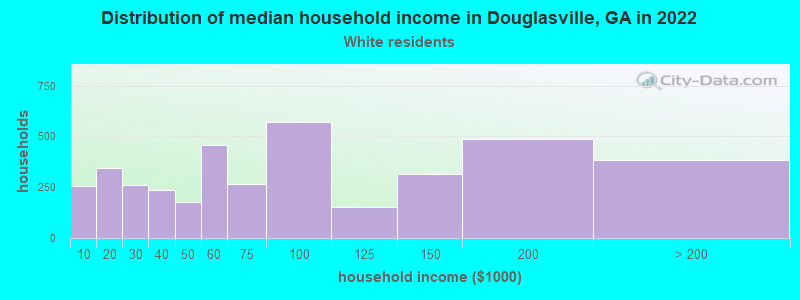
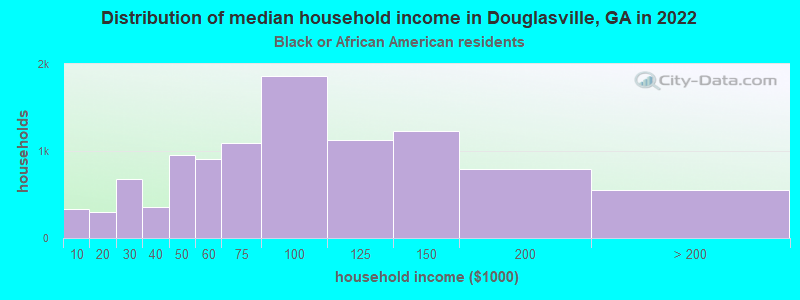
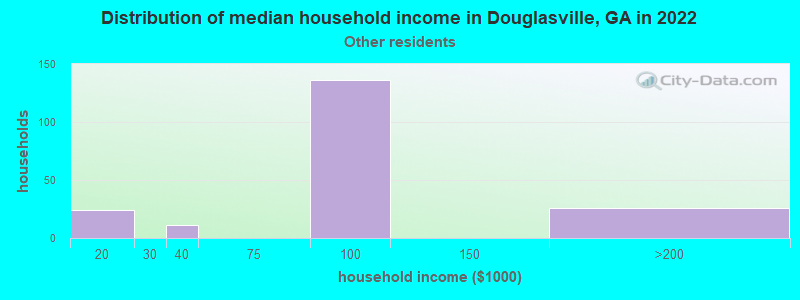
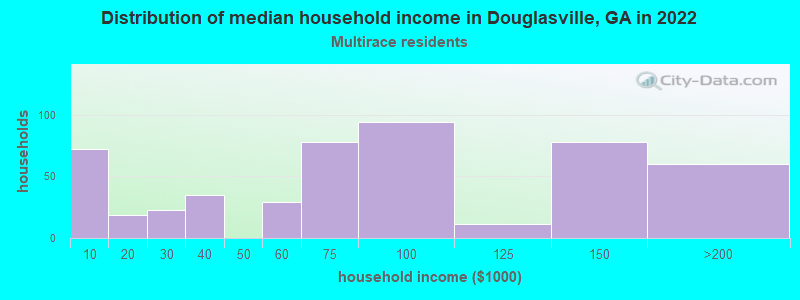
Income and house value in Douglasville Median household income in 2022 $81,297 White non-Hispanic householders$78,106 Black householders$90,885 Some other race householders$81,873 Two or more races householders$74,640 Hispanic or Latino race householdersMedian 2022 house value $399,302 White Non-Hispanic householders$308,042 Black or African American householders$202,454 American Indian or Alaska Native householders $541,954 Asian householders$454,120 Some other race householders$476,235 Two or more races householders$443,842 Hispanic or Latino householders
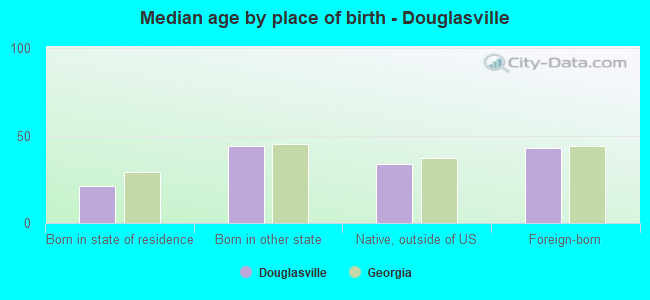
Median age by race in Douglasville
47.1 Median age for White residents42.3 53.0 37.8 Median age for Black or African American residents35.2 38.3 28.5 Median age for American Indian / Alaska Native residents45.2 -597,938,143.7 33.2 Median age for Asian residents46.0 36.7 -666,666,666.0 Median age for Native Hawaiian / Pacific Islander residents-666,666,666.0 -666,666,666.0 23.7 Median age for Other race residents23.0 19.6 16.0 Median age for Two or more races residents11.4 22.6 49.0 Median age for White alone residents42.3 52.9 18.2 Median age for Hispanic or Latino residents25.0 13.0
Owner/renter occupied households by race in Douglasville
House owners and renters - White residents 2,671 72.4% Owner occupied1,017 27.6% Renter occupiedHouse owners and renters - Black or African American residents 4,504 47.6% Owner occupied4,953 52.4% Renter occupiedHouse owners and renters - American Indian / Alaska Native residents 12 90.4% Owner occupied1 9.6% Renter occupiedHouse owners and renters - Asian residents 190 86.5% Owner occupied30 13.5% Renter occupiedHouse owners and renters - Other race residents 48 18.3% Owner occupied215 81.7% Renter occupiedHouse owners and renters - Two or more races residents 172 41.7% Owner occupied241 58.3% Renter occupiedHouse owners and renters - White alone residents 2,575 71.4% Owner occupied1,031 28.6% Renter occupiedHouse owners and renters - Hispanic or Latino residents 527 69.7% Owner occupied229 30.3% Renter occupied
Language usage in Douglasville
English speakers - Total 89.1% of residents of Douglasville speak English at home.
5.1% of residents speak Spanish at home 992 58.2% Speak English very well712 41.8% Speak English less than very well5.8% of residents speak other language at home 1,681 86.6% Speak English very well260 13.4% Speak English less than very well
English speakers - Born in the United States 97.4% of residents of Douglasville speak English at home.
2.0% of residents speak Spanish at home 271 89.7% Speak English very well31 10.3% Speak English less than very well1.1% of residents speak other language at home 164 100.0% Speak English very well
English speakers - Native, born elsewhere 32.9% of residents of Douglasville speak English at home.
35.4% of residents speak Spanish at home 46 20.2% Speak English very well182 79.8% Speak English less than very well
English speakers - Foreign-born 34.6% of residents of Douglasville speak English at home.
24.2% of residents speak Spanish at home 151 19.0% Speak English very well642 81.0% Speak English less than very well40.3% of residents speak other language at home 1,050 79.5% Speak English very well270 20.5% Speak English less than very well
White (Caucasian) - Speak only English Native:
96.2% (8,455)Foreign-born:
35.2% (175)
White (Caucasian) - Speak another language Native:
3.5% (309)Foreign-born:
65.7% (327)
Black or African American - Speak only English Native:
99.4% (20,242)Foreign-born:
44.9% (813)
Black or African American - Speak another language Native:
1.0% (209)Foreign-born:
55.1% (998)
American Indian / Alaska Native - Speak only English Native:
49.1% (17)Foreign-born:
96.6% (14)
Asian - Speak only English Native:
3.9% (8)Foreign-born:
24.2% (90)
Asian - Speak another language Native:
100.0% (196)Foreign-born:
82.4% (307)
Other race - Speak another language Native:
82.7% (368)Foreign-born:
100.0% (152)
Two or more races - Speak only English Native:
73.5% (1,440)Foreign-born:
31.3% (15)
Two or more races - Speak another language Native:
20.7% (406)Foreign-born:
52.0% (26)
White alone - Speak only English Native:
97.5% (7,155)Foreign-born:
85.4% (136)
White alone - Speak another language Native:
2.2% (164)Foreign-born:
62.4% (100)
Hispanic or Latino - Speak only English Native:
61.5% (1,235)Foreign-born:
8.0% (57)
Hispanic or Latino - Speak another language Native:
33.4% (671)Foreign-born:
95.3% (677)
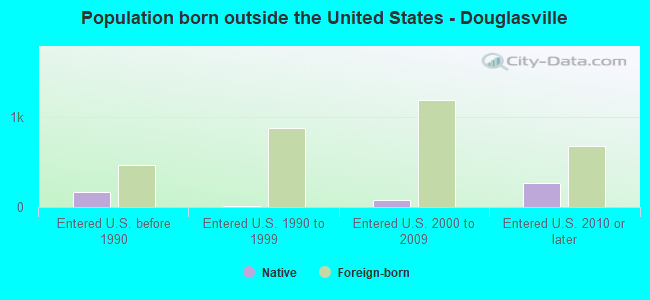
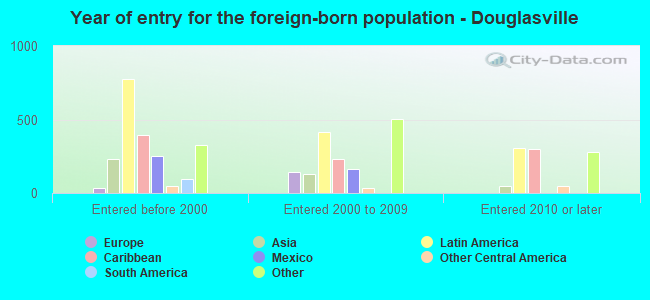
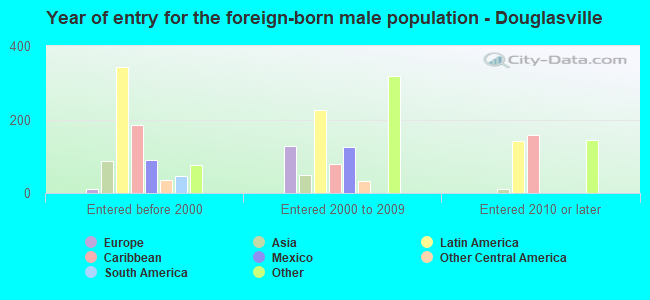
Foreign-born residents in Douglasville 3,225 residents are foreign born (4.2% Latin America , 2.8% Africa , 1.1% Asia ).
This city:
9.0%Georgia:
10.4%
Marital status for residents in Douglasville Marital status - White (Caucasian) population 15 years and over
Males 31.2% Never married53.2% Now married2.1% Separated2.5% Widowed10.9% DivorcedFemales 14.8% Never married55.7% Now married2.5% Separated11.0% Widowed16.0% DivorcedWomen who gave birth in the past 12 months Now married:
100.0% (79)Unmarried:
0.0% (0)
Women who did not give birth in the past 12 months Now married:
61.0% (820)Unmarried:
39.0% (524)
Marital status - Black or African American population 15 years and over
Males 41.3% Never married43.3% Now married4.8% Separated0.7% Widowed9.8% DivorcedFemales 40.8% Never married29.9% Now married1.8% Separated4.9% Widowed22.6% DivorcedWomen who gave birth in the past 12 months Now married:
58.0% (216)Unmarried:
42.0% (157)
Women who did not give birth in the past 12 months Now married:
27.3% (1,855)Unmarried:
72.7% (4,949)
Marital status - Asian population 15 years and over
Males 10.2% Never married79.6% Now married7.5% Separated0.0% Widowed2.7% DivorcedFemales 53.6% Never married38.7% Now married0.0% Separated1.9% Widowed5.9% DivorcedWomen who did not give birth in the past 12 months Now married:
29.2% (68)Unmarried:
70.8% (166)
Marital status - Other race population 15 years and over
Males 62.1% Never married29.1% Now married8.8% Separated0.0% Widowed0.0% DivorcedFemales 54.5% Never married38.4% Now married0.0% Separated0.0% Widowed7.1% DivorcedWomen who did not give birth in the past 12 months Now married:
41.3% (56)Unmarried:
58.7% (79)
Marital status - Two or more races population 15 years and over
Males 60.7% Never married28.9% Now married2.6% Separated0.0% Widowed7.7% DivorcedFemales 61.7% Never married21.6% Now married0.0% Separated10.8% Widowed5.8% DivorcedWomen who did not give birth in the past 12 months Now married:
19.7% (163)Unmarried:
80.3% (663)
Marital status - White alone, not Hispanic / Latino population 15 years and over
Males 32.9% Never married50.3% Now married1.4% Separated2.9% Widowed12.5% DivorcedFemales 16.2% Never married53.9% Now married1.4% Separated11.1% Widowed17.5% DivorcedWomen who gave birth in the past 12 months Now married:
100.0% (32)Unmarried:
0.0% (0)
Women who did not give birth in the past 12 months Now married:
58.2% (800)Unmarried:
41.8% (574)
Marital status - Hispanic or Latino population 15 years and over
Males 21.0% Never married56.3% Now married21.4% Separated0.1% Widowed1.3% DivorcedFemales 16.8% Never married66.1% Now married7.3% Separated5.5% Widowed4.3% DivorcedWomen who gave birth in the past 12 months Now married:
100.0% (72)Unmarried:
0.0% (0)
Women who did not give birth in the past 12 months Now married:
71.9% (338)Unmarried:
28.1% (132)
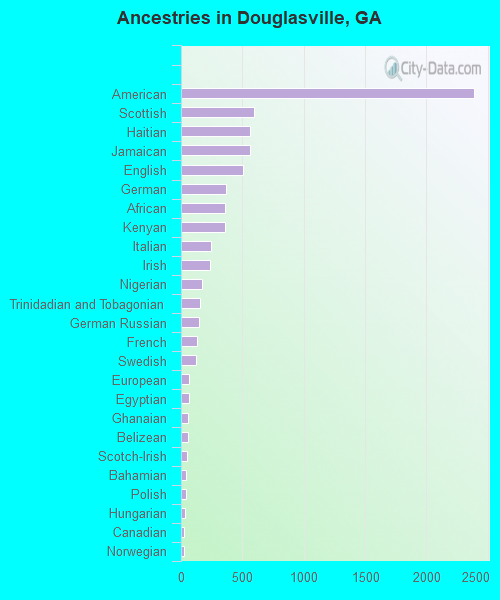
Ancestries in Douglasville
2,391 10.3% American598 2.6% Scottish565 2.4% Haitian563 2.4% Jamaican503 2.2% English364 1.6% German359 1.6% African357 1.5% Kenyan241 1.0% Italian234 1.0% Irish175 0.8% Nigerian157 0.7% Trinidadian and Tobagonian145 0.6% German Russian133 0.6% French122 0.5% Swedish68 0.3% European63 0.3% Egyptian61 0.3% Ghanaian60 0.3% Belizean46 0.2% Scotch-Irish44 0.2% Bahamian38 0.2% Polish30 0.1% Hungarian28 0.1% Canadian28 0.1% Norwegian27 0.1% Cape Verdean25 0.1% West Indian25 0.1% Eastern European23 0.10% British14 0.06% Russian11 0.05% French Canadian10 0.04% Slavic9 0.04% Sierra Leonean
Geographical mobility in Douglasville Same house 1 year ago 7,634 91.0% White (Caucasian)20,435 88.6% Black or African American23 43.0% American Indian / Alaska Native462 74.7% Asian425 87.8% Other race1,469 68.9% Two or more races6,897 90.1% White alone, not Hispanic / Latino2,691 91.3% Hispanic or LatinoMoved within same county 263 3.1% White / Caucasian1,223 5.3% Black or African American19 36.1% American Indian / Alaska Native4 0.8% Other race318 14.9% Two or more races273 3.6% White alone, not Hispanic / Latino93 3.2% Hispanic or LatinoMoved within same state 314 3.7% White / Caucasian672 2.9% Black or African American11 20.2% American Indian / Alaska Native144 23.3% Asian65 13.4% Other race52 2.5% Two or more races341 4.5% White alone, not Hispanic / Latino49 1.7% Hispanic or LatinoMoved from different state 151 1.8% White / Caucasian392 1.7% Black or African American18 2.8% Asian258 12.1% Two or more races73 0.9% White alone, not Hispanic / Latino100 3.4% Hispanic or LatinoMoved from abroad 5 0.1% White110 0.5% Black or African American6 0.1% White alone, not Hispanic / Latino
Children Nativity (place of birth) in Douglasville
Children under 6 years - Living with two parents Both parents native 748 100.0% NativeBoth parents foreign-born 170 100.0% NativeOne native, one foreign-born parent 186 100.0% NativeChildren under 6 years - Living with one parent Native parent 1,411 100.0% NativeForeign-born parent 188 100.0% NativeChildren 6 to 17 years - Living with two parents Both parents native 1,675 99.6% Native6 0.4% Foreign-bornBoth parents foreign-born 629 91.9% Native55 8.1% Foreign-bornOne native, one foreign-born parent 1,086 94.3% Native66 5.7% Foreign-bornChildren 6 to 17 years - Living with one parent Native parent 2,199 100.0% NativeForeign-born parent 102 50.3% Native100 49.7% Foreign-born
Grandparents responsible for own grandchildren in Douglasville
Grandparents (30 to 59 years) White / Caucasian 170 100.0% Not responsible for grandchildrenBlack or African American 128 36.1% Responsible for grandchildren226 63.9% Not responsible for grandchildrenWhite alone, not Hispanic / Latino 84 100.0% Not responsible for grandchildrenHispanic or Latino 106 100.0% Not responsible for grandchildrenGrandparents (60 years and over) White / Caucasian 3 14.2% Responsible for grandchildren16 85.8% Not responsible for grandchildrenBlack or African American 19 4.6% Responsible for grandchildren400 95.4% Not responsible for grandchildrenWhite alone, not Hispanic / Latino 3 26.7% Responsible for grandchildren7 73.3% Not responsible for grandchildren