Races in District 8, Bryantown, Maryland (MD) Detailed Stats
Ancestries, Foreign-born residents, place of birth
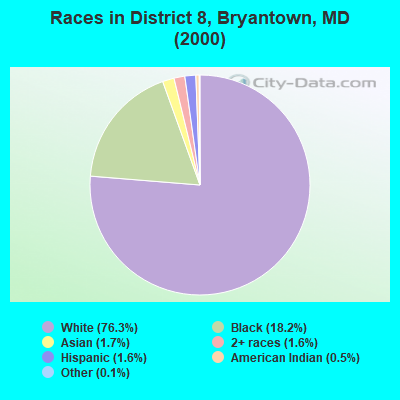
Race distribution in District 8, Bryantown

- 9,61176.3%White alone
- 2,29718.2%Black alone
- 2091.7%Asian alone
- 2011.6%Hispanic
- 2031.6%Two or more races
- 640.5%American Indian alone
- 130.1%Other race alone
- 50.04%Native Hawaiian and Other
Pacific Islander alone
2000
2022
-
- 3,286,54762.1%White alone
- 1,464,73527.7%Black alone
- 227,9164.3%Hispanic
- 209,7384.0%Asian alone
- 82,9461.6%Two or more races
- 13,3120.3%American Indian alone
- 9,3790.2%Other race alone
- 1,9130.04%Native Hawaiian and Other
Pacific Islander alone

-
- 2,906,49247.1%White alone
- 1,800,91429.2%Black alone
- 705,84211.4%Hispanic
- 401,8186.5%Asian alone
- 291,3174.7%Two or more races
- 46,9300.8%Other race alone
- 8,9300.1%American Indian alone
- 2,4170.04%Native Hawaiian and Other
Pacific Islander alone

Income and house value in District 8, Bryantown
- Median household income in 2022
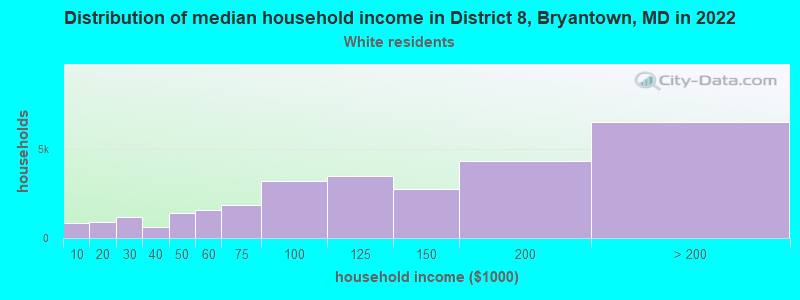
- $141,293White non-Hispanic householders
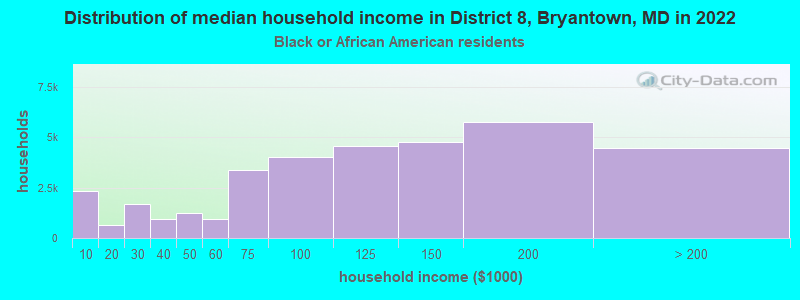
- $119,330Black householders
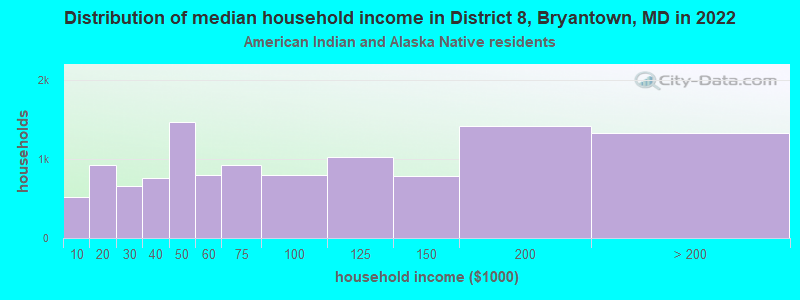
- $51,006American Indian and Alaska Native householders
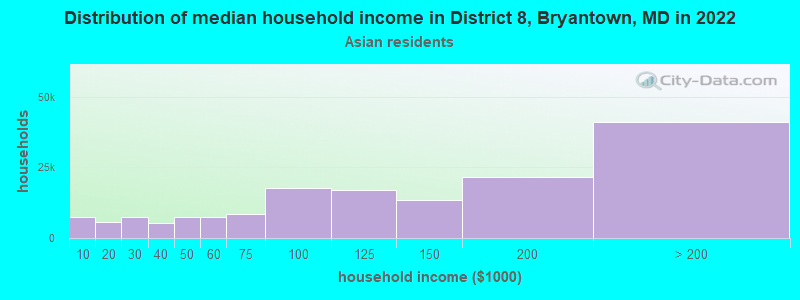
- over $200,000Asian householders
- $178,540Some other race householders
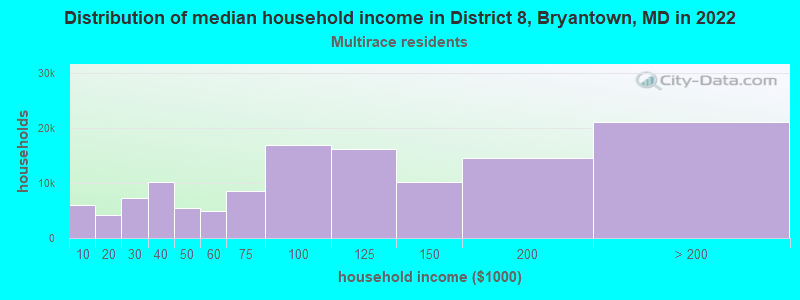
- over $200,000Two or more races householders
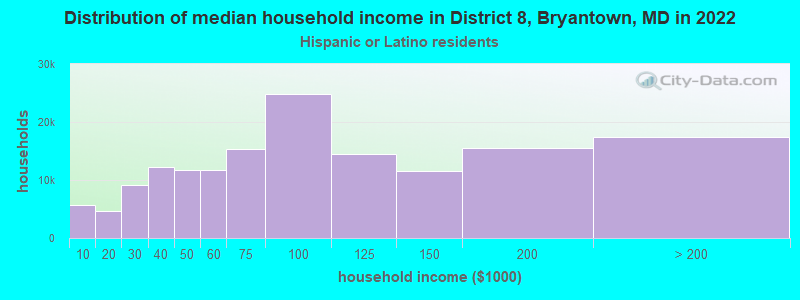
- over $200,000Hispanic or Latino race householders
- Median 2022 house value
- $424,745White Non-Hispanic householders
- $389,870Black or African American householders
- $410,691American Indian or Alaska Native householders
- $429,429Asian householders
- $544,985Some other race householders
- $339,900Two or more races householders
- $169,169Hispanic or Latino householders
Household income for White non-Hispanic householders
Household income for Black householders
Household income for American Indian and Alaska Native householders
Household income for Asian householders
Household income for Two or more races householders
Household income for Hispanic or Latino race householders
Zip code: 20601