Races in District 7, Cresaptown/Bel Air, Maryland (MD) Detailed Stats
Ancestries, Foreign-born residents, place of birth
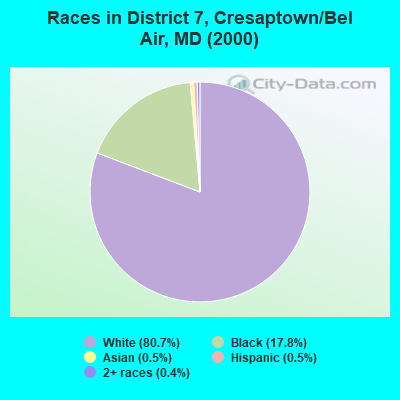
Race distribution in District 7, Cresaptown/Bel Air

- 5,53480.7%White alone
- 1,22317.8%Black alone
- 330.5%Hispanic
- 360.5%Asian alone
- 280.4%Two or more races
- 20.03%Other race alone
- 20.03%American Indian alone
2000
2022
-
- 3,286,54762.1%White alone
- 1,464,73527.7%Black alone
- 227,9164.3%Hispanic
- 209,7384.0%Asian alone
- 82,9461.6%Two or more races
- 13,3120.3%American Indian alone
- 9,3790.2%Other race alone
- 1,9130.04%Native Hawaiian and Other
Pacific Islander alone

-
- 2,906,49247.1%White alone
- 1,800,91429.2%Black alone
- 705,84211.4%Hispanic
- 401,8186.5%Asian alone
- 291,3174.7%Two or more races
- 46,9300.8%Other race alone
- 8,9300.1%American Indian alone
- 2,4170.04%Native Hawaiian and Other
Pacific Islander alone

Income and house value in District 7, Cresaptown/Bel Air
- Median household income in 2022
- $63,075White non-Hispanic householders
- $19,625Black householders
- over $200,000Asian householders
- $108,596Hispanic or Latino race householders
- Median 2022 house value
- $183,226White Non-Hispanic householders
- $235,231Asian householders
Household income for White non-Hispanic householders

Household income for Black householders

Household income for Asian householders

Household income for Hispanic or Latino race householders

Zip code: 21502