Races in District 3, Leonardtown, Maryland (MD) Detailed Stats
Ancestries, Foreign-born residents, place of birth
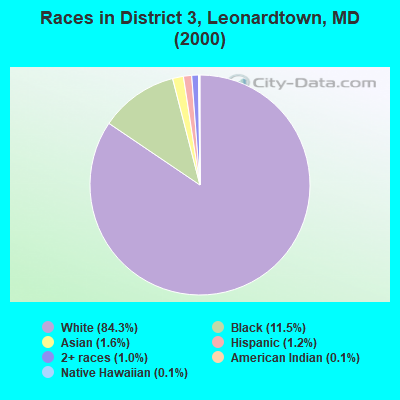
Race distribution in District 3, Leonardtown

- 9,09084.3%White alone
- 1,24311.5%Black alone
- 1761.6%Asian alone
- 1341.2%Hispanic
- 1061.0%Two or more races
- 150.1%American Indian alone
- 110.1%Native Hawaiian and Other
Pacific Islander alone - 100.09%Other race alone
2000
2022
-
- 3,286,54762.1%White alone
- 1,464,73527.7%Black alone
- 227,9164.3%Hispanic
- 209,7384.0%Asian alone
- 82,9461.6%Two or more races
- 13,3120.3%American Indian alone
- 9,3790.2%Other race alone
- 1,9130.04%Native Hawaiian and Other
Pacific Islander alone

-
- 2,906,49247.1%White alone
- 1,800,91429.2%Black alone
- 705,84211.4%Hispanic
- 401,8186.5%Asian alone
- 291,3174.7%Two or more races
- 46,9300.8%Other race alone
- 8,9300.1%American Indian alone
- 2,4170.04%Native Hawaiian and Other
Pacific Islander alone

Income and house value in District 3, Leonardtown
- Median household income in 2022
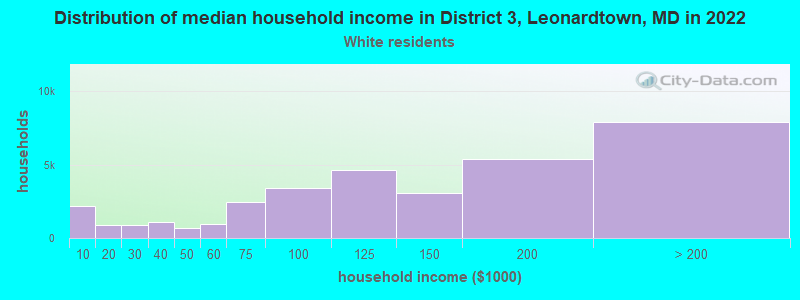
- $127,160White non-Hispanic householders
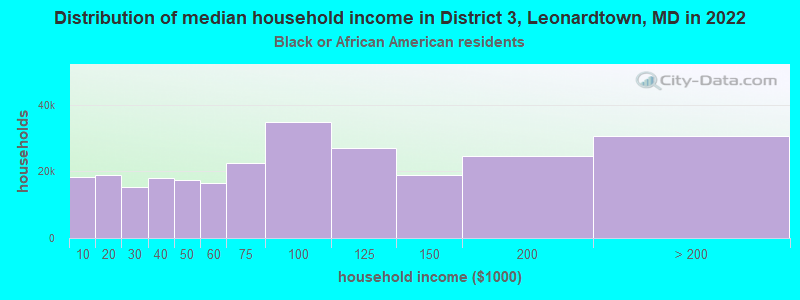
- $67,646Black householders
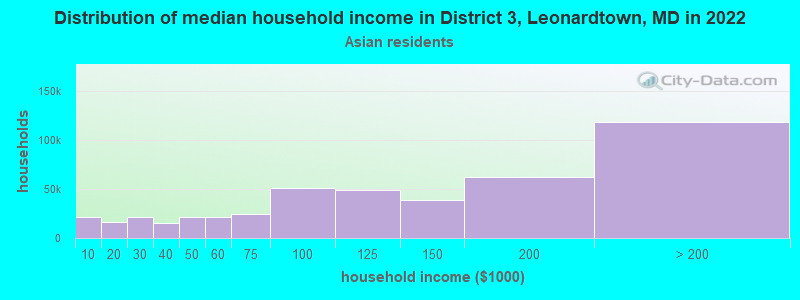
- over $200,000Asian householders
- $139,032Some other race householders
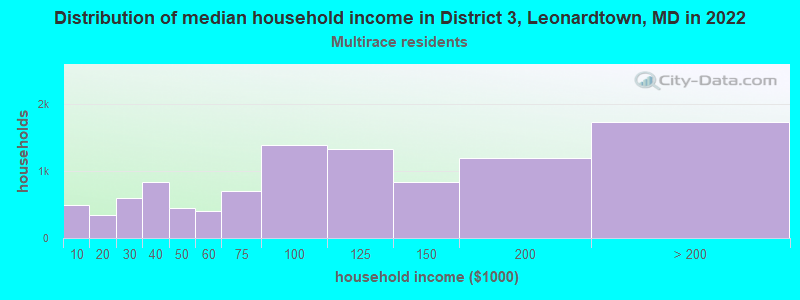
- $21,687Two or more races householders
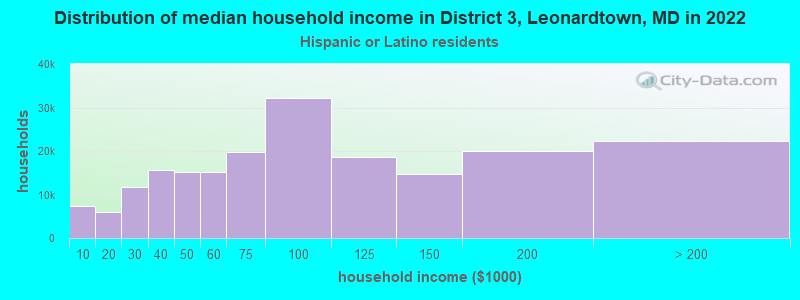
- $137,981Hispanic or Latino race householders
- Median 2022 house value
- $445,798White Non-Hispanic householders
- $276,262Black or African American householders
- over $1,000,000Asian householders
- $694,914Some other race householders
- $432,491Two or more races householders
- $717,004Hispanic or Latino householders
Household income for White non-Hispanic householders
Household income for Black householders
Household income for Asian householders
Household income for Two or more races householders
Household income for Hispanic or Latino race householders
Zip code: 20650