Races in District 17, Hagerstown, Maryland (MD) Detailed Stats
Ancestries, Foreign-born residents, place of birth
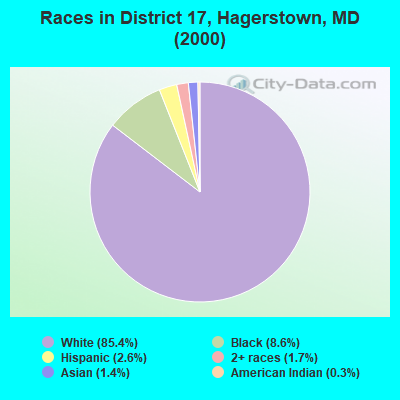
Race distribution in District 17, Hagerstown

- 5,98385.4%White alone
- 6028.6%Black alone
- 1842.6%Hispanic
- 1161.7%Two or more races
- 1001.4%Asian alone
- 180.3%American Indian alone
- 40.06%Other race alone
- 10.01%Native Hawaiian and Other
Pacific Islander alone
2000
2022
-
- 3,286,54762.1%White alone
- 1,464,73527.7%Black alone
- 227,9164.3%Hispanic
- 209,7384.0%Asian alone
- 82,9461.6%Two or more races
- 13,3120.3%American Indian alone
- 9,3790.2%Other race alone
- 1,9130.04%Native Hawaiian and Other
Pacific Islander alone

-
- 2,906,49247.1%White alone
- 1,800,91429.2%Black alone
- 705,84211.4%Hispanic
- 401,8186.5%Asian alone
- 291,3174.7%Two or more races
- 46,9300.8%Other race alone
- 8,9300.1%American Indian alone
- 2,4170.04%Native Hawaiian and Other
Pacific Islander alone

Income and house value in District 17, Hagerstown
- Median household income in 2022
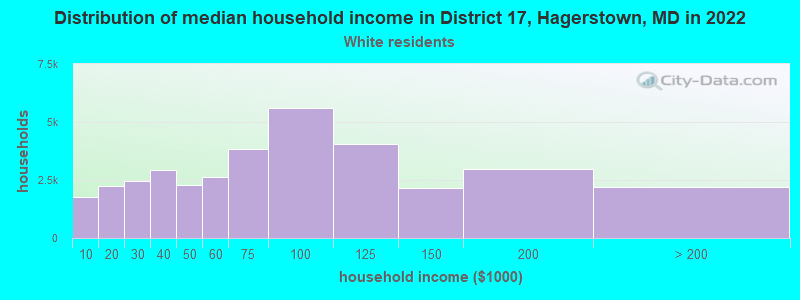
- $53,802White non-Hispanic householders
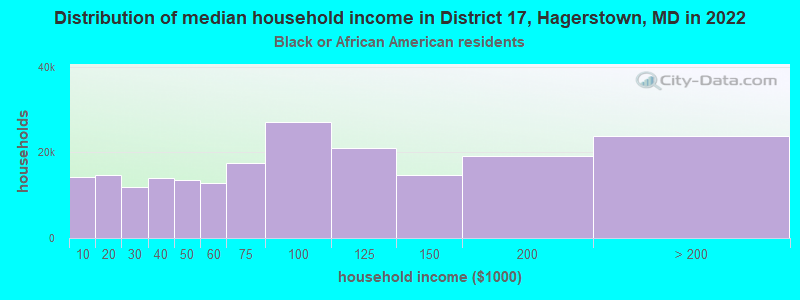
- $49,774Black householders
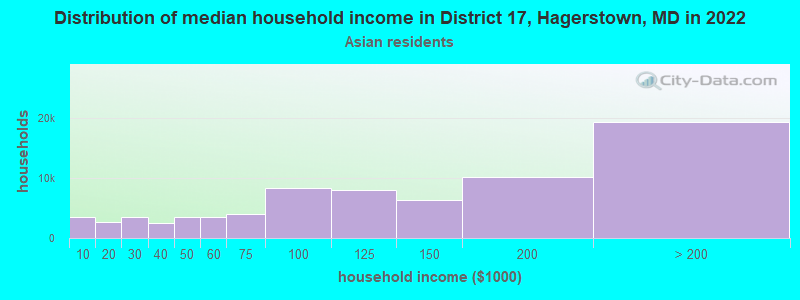
- $64,861Asian householders
- $77,591Some other race householders
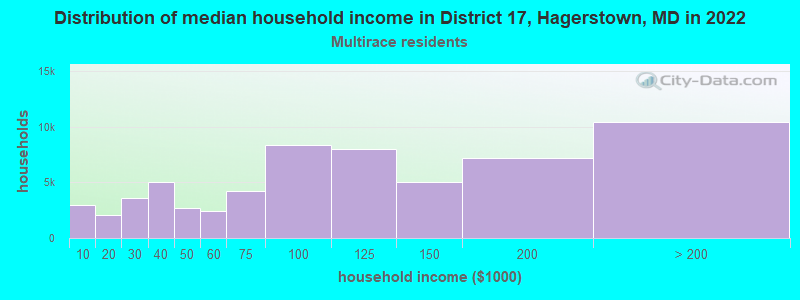
- $57,402Two or more races householders
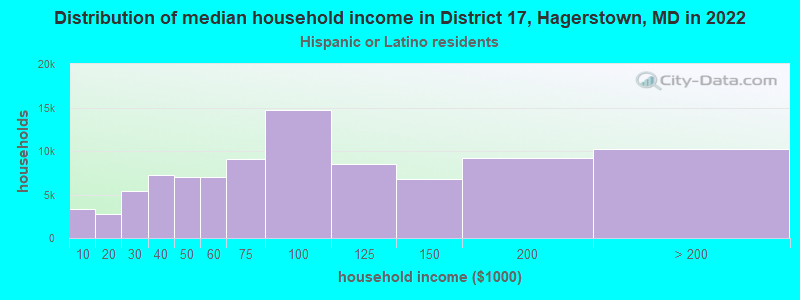
- $79,084Hispanic or Latino race householders
- Median 2022 house value
- $214,636White Non-Hispanic householders
- $421,776Black or African American householders
- $162,414American Indian or Alaska Native householders
- $137,427Asian householders
- $354,062Two or more races householders
- $237,374Hispanic or Latino householders
Household income for White non-Hispanic householders
Household income for Black householders
Household income for American Indian and Alaska Native householders

Household income for Asian householders
Household income for Two or more races householders
Household income for Hispanic or Latino race householders
Zip code: 21740