Races in Derby, Connecticut (CT) Detailed Stats
Data:
Races - White alone (%)
Races - White alone (% change since 2000)
Races - Black alone (%)
Races - Black alone (% change since 2000)
Races - American Indian alone (%)
Races - American Indian alone (% change since 2000)
Races - Asian alone (%)
Races - Asian alone (% change since 2000)
Races - Hispanic (%)
Races - Hispanic (% change since 2000)
Races - Native Hawaiian and Other Pacific Islander alone (%)
Races - Native Hawaiian and Other Pacific Islander alone (% change since 2000)
Races - Two or more races(%)
Races - Two or more races(% change since 2000)
Races - Other race alone (%)
Races - Other race alone (% change since 2000)
Racial diversity
Place of birth - Born in state of residence (%)
Place of birth - Born in state of residence (%) - White
Place of birth - Born in state of residence (%) - Black or African American
Place of birth - Born in state of residence (%) - Asian
Place of birth - Born in state of residence (%) - Hispanic or Latino
Place of birth - Born in state of residence (%) - American Indian and Alaska Native
Place of birth - Born in state of residence (%) - Multirace
Place of birth - Born in state of residence (%) - Other Race
Place of birth - Born in other state (%)
Place of birth - Born in other state (%) - White
Place of birth - Born in other state (%) - Black or African American
Place of birth - Born in other state (%) - Asian
Place of birth - Born in other state (%) - Hispanic or Latino
Place of birth - Born in other state (%) - American Indian and Alaska Native
Place of birth - Born in other state (%) - Multirace
Place of birth - Born in other state (%) - Other Race
Place of birth - Native, outside of US (%)
Place of birth - Native, outside of US (%) - White
Place of birth - Native, outside of US (%) - Black or African American
Place of birth - Native, outside of US (%) - Asian
Place of birth - Native, outside of US (%) - Hispanic or Latino
Place of birth - Native, outside of US (%) - American Indian and Alaska Native
Place of birth - Native, outside of US (%) - Multirace
Place of birth - Native, outside of US (%) - Other Race
Place of birth - Foreign born (%)
Place of birth - Foreign born (%) - White
Place of birth - Foreign born (%) - Black or African American
Place of birth - Foreign born (%) - Asian
Place of birth - Foreign born (%) - Hispanic or Latino
Place of birth - Foreign born (%) - American Indian and Alaska Native
Place of birth - Foreign born (%) - Multirace
Place of birth - Foreign born (%) - Other Race
Residents speaking English at home (%)
Residents speaking English at home - Born in the United States (%)
Residents speaking English at home - Native, born elsewhere (%)
Residents speaking English at home - Foreign born (%)
Residents speaking Spanish at home (%)
Residents speaking Spanish at home - Born in the United States (%)
Residents speaking Spanish at home - Native, born elsewhere (%)
Residents speaking Spanish at home - Foreign born (%)
Residents speaking other language at home (%)
Residents speaking other language at home - Born in the United States (%)
Residents speaking other language at home - Native, born elsewhere (%)
Residents speaking other language at home - Foreign born (%)
Marital status - Never married (%)
Marital status - Now married (%)
Marital status - Separated (%)
Marital status - Widowed (%)
Marital status - Divorced (%)
Ancestries Reported - Arab (%)
Ancestries Reported - Czech (%)
Ancestries Reported - Danish (%)
Ancestries Reported - Dutch (%)
Ancestries Reported - English (%)
Ancestries Reported - French (%)
Ancestries Reported - French Canadian (%)
Ancestries Reported - German (%)
Ancestries Reported - Greek (%)
Ancestries Reported - Hungarian (%)
Ancestries Reported - Irish (%)
Ancestries Reported - Italian (%)
Ancestries Reported - Lithuanian (%)
Ancestries Reported - Norwegian (%)
Ancestries Reported - Polish (%)
Ancestries Reported - Portuguese (%)
Ancestries Reported - Russian (%)
Ancestries Reported - Scotch-Irish (%)
Ancestries Reported - Scottish (%)
Ancestries Reported - Slovak (%)
Ancestries Reported - Subsaharan African (%)
Ancestries Reported - Swedish (%)
Ancestries Reported - Swiss (%)
Ancestries Reported - Ukrainian (%)
Ancestries Reported - United States (%)
Ancestries Reported - Welsh (%)
Ancestries Reported - West Indian (%)
Ancestries Reported - Other (%)
Geographical mobility - Same house 1 year ago (%)
Geographical mobility - Same house 1 year ago (%) - White
Geographical mobility - Same house 1 year ago (%) - Black or African American
Geographical mobility - Same house 1 year ago (%) - Asian
Geographical mobility - Same house 1 year ago (%) - Hispanic or Latino
Geographical mobility - Same house 1 year ago (%) - American Indian and Alaska Native
Geographical mobility - Same house 1 year ago (%) - Multirace
Geographical mobility - Same house 1 year ago (%) - Other Race
Geographical mobility - Moved within same county (%)
Geographical mobility - Moved within same county (%) - White
Geographical mobility - Moved within same county (%) - Black or African American
Geographical mobility - Moved within same county (%) - Asian
Geographical mobility - Moved within same county (%) - Hispanic or Latino
Geographical mobility - Moved within same county (%) - American Indian and Alaska Native
Geographical mobility - Moved within same county (%) - Multirace
Geographical mobility - Moved within same county (%) - Other Race
Geographical mobility - Moved from different county within same state (%)
Geographical mobility - Moved from different county within same state (%) - White
Geographical mobility - Moved from different county within same state (%) - Black or African American
Geographical mobility - Moved from different county within same state (%) - Asian
Geographical mobility - Moved from different county within same state (%) - Hispanic or Latino
Geographical mobility - Moved from different county within same state (%) - American Indian and Alaska Native
Geographical mobility - Moved from different county within same state (%) - Multirace
Geographical mobility - Moved from different county within same state (%) - Other Race
Geographical mobility - Moved from different state (%)
Geographical mobility - Moved from different state (%) - White
Geographical mobility - Moved from different state (%) - Black or African American
Geographical mobility - Moved from different state (%) - Asian
Geographical mobility - Moved from different state (%) - Hispanic or Latino
Geographical mobility - Moved from different state (%) - American Indian and Alaska Native
Geographical mobility - Moved from different state (%) - Multirace
Geographical mobility - Moved from different state (%) - Other Race
Geographical mobility - Moved from abroad (%)
Geographical mobility - Moved from abroad (%) - White
Geographical mobility - Moved from abroad (%) - Black or African American
Geographical mobility - Moved from abroad (%) - Asian
Geographical mobility - Moved from abroad (%) - Hispanic or Latino
Geographical mobility - Moved from abroad (%) - American Indian and Alaska Native
Geographical mobility - Moved from abroad (%) - Multirace
Geographical mobility - Moved from abroad (%) - Other Race
Place of birth for the foreign-born population - Ireland (%)
Place of birth for the foreign-born population - Denmark (%)
Place of birth for the foreign-born population - Norway (%)
Place of birth for the foreign-born population - Sweden (%)
Place of birth for the foreign-born population - United Kingdom (%)
Place of birth for the foreign-born population - England (%)
Place of birth for the foreign-born population - Scotland (%)
Place of birth for the foreign-born population - Other Northern Europe (%)
Place of birth for the foreign-born population - Austria (%)
Place of birth for the foreign-born population - Belgium (%)
Place of birth for the foreign-born population - France (%)
Place of birth for the foreign-born population - Germany (%)
Place of birth for the foreign-born population - Netherlands (%)
Place of birth for the foreign-born population - Switzerland (%)
Place of birth for the foreign-born population - Other Western Europe (%)
Place of birth for the foreign-born population - Greece (%)
Place of birth for the foreign-born population - Italy (%)
Place of birth for the foreign-born population - Portugal (%)
Place of birth for the foreign-born population - Spain (%)
Place of birth for the foreign-born population - Other Southern Europe (%)
Place of birth for the foreign-born population - Albania (%)
Place of birth for the foreign-born population - Belarus (%)
Place of birth for the foreign-born population - Bosnia and Herzegovina (%)
Place of birth for the foreign-born population - Bulgaria (%)
Place of birth for the foreign-born population - Croatia (%)
Place of birth for the foreign-born population - Czechoslovakia (%)
Place of birth for the foreign-born population - Hungary (%)
Place of birth for the foreign-born population - Latvia (%)
Place of birth for the foreign-born population - Lithuania (%)
Place of birth for the foreign-born population - North Macedonia (Macedonia) (%)
Place of birth for the foreign-born population - Moldova (%)
Place of birth for the foreign-born population - Poland (%)
Place of birth for the foreign-born population - Romania (%)
Place of birth for the foreign-born population - Russia (%)
Place of birth for the foreign-born population - Serbia (%)
Place of birth for the foreign-born population - Ukraine (%)
Place of birth for the foreign-born population - Other Eastern Europe (%)
Place of birth for the foreign-born population - China (%)
Place of birth for the foreign-born population - Hong Kong (%)
Place of birth for the foreign-born population - Taiwan (%)
Place of birth for the foreign-born population - Japan (%)
Place of birth for the foreign-born population - Korea (%)
Place of birth for the foreign-born population - Other Eastern Asia (%)
Place of birth for the foreign-born population - Afghanistan (%)
Place of birth for the foreign-born population - Bangladesh (%)
Place of birth for the foreign-born population - India (%)
Place of birth for the foreign-born population - Iran (%)
Place of birth for the foreign-born population - Kazakhstan (%)
Place of birth for the foreign-born population - Nepal (%)
Place of birth for the foreign-born population - Pakistan (%)
Place of birth for the foreign-born population - Sri Lanka (%)
Place of birth for the foreign-born population - Uzbekistan (%)
Place of birth for the foreign-born population - Other South Central Asia (%)
Place of birth for the foreign-born population - Burma (%)
Place of birth for the foreign-born population - Cambodia (%)
Place of birth for the foreign-born population - Indonesia (%)
Place of birth for the foreign-born population - Laos (%)
Place of birth for the foreign-born population - Malaysia (%)
Place of birth for the foreign-born population - Philippines (%)
Place of birth for the foreign-born population - Singapore (%)
Place of birth for the foreign-born population - Thailand (%)
Place of birth for the foreign-born population - Vietnam (%)
Place of birth for the foreign-born population - Other South Eastern Asia (%)
Place of birth for the foreign-born population - Armenia (%)
Place of birth for the foreign-born population - Iraq (%)
Place of birth for the foreign-born population - Israel (%)
Place of birth for the foreign-born population - Jordan (%)
Place of birth for the foreign-born population - Kuwait (%)
Place of birth for the foreign-born population - Lebanon (%)
Place of birth for the foreign-born population - Saudi Arabia (%)
Place of birth for the foreign-born population - Syria (%)
Place of birth for the foreign-born population - Turkey (%)
Place of birth for the foreign-born population - Yemen (%)
Place of birth for the foreign-born population - Other Western Asia (%)
Place of birth for the foreign-born population - Eritrea (%)
Place of birth for the foreign-born population - Ethiopia (%)
Place of birth for the foreign-born population - Kenya (%)
Place of birth for the foreign-born population - Somalia (%)
Place of birth for the foreign-born population - Uganda (%)
Place of birth for the foreign-born population - Zimbabwe (%)
Place of birth for the foreign-born population - Other Eastern Africa (%)
Place of birth for the foreign-born population - Cameroon (%)
Place of birth for the foreign-born population - Congo (%)
Place of birth for the foreign-born population - Democratic Republic of Congo (Zaire) (%)
Place of birth for the foreign-born population - Other Middle Africa (%)
Place of birth for the foreign-born population - Egypt (%)
Place of birth for the foreign-born population - Morocco (%)
Place of birth for the foreign-born population - Sudan (%)
Place of birth for the foreign-born population - Other Northern Africa (%)
Place of birth for the foreign-born population - South Africa (%)
Place of birth for the foreign-born population - Other Southern Africa (%)
Place of birth for the foreign-born population - Cabo Verde (%)
Place of birth for the foreign-born population - Ghana (%)
Place of birth for the foreign-born population - Liberia (%)
Place of birth for the foreign-born population - Nigeria (%)
Place of birth for the foreign-born population - Senegal (%)
Place of birth for the foreign-born population - Sierra Leone (%)
Place of birth for the foreign-born population - Other Western Africa (%)
Place of birth for the foreign-born population - Australia (%)
Place of birth for the foreign-born population - New Zealand (%)
Place of birth for the foreign-born population - Fiji (%)
Place of birth for the foreign-born population - Micronesia (%)
Place of birth for the foreign-born population - Bahamas (%)
Place of birth for the foreign-born population - Barbados (%)
Place of birth for the foreign-born population - Cuba (%)
Place of birth for the foreign-born population - Dominica (%)
Place of birth for the foreign-born population - Dominican Republic (%)
Place of birth for the foreign-born population - Grenada (%)
Place of birth for the foreign-born population - Haiti (%)
Place of birth for the foreign-born population - Jamaica (%)
Place of birth for the foreign-born population - St. Vincent and the Grenadines (%)
Place of birth for the foreign-born population - Trinidad and Tobago (%)
Place of birth for the foreign-born population - West Indies (%)
Place of birth for the foreign-born population - Other Caribbean (%)
Place of birth for the foreign-born population - Belize (%)
Place of birth for the foreign-born population - Costa Rica (%)
Place of birth for the foreign-born population - El Salvador (%)
Place of birth for the foreign-born population - Guatemala (%)
Place of birth for the foreign-born population - Honduras (%)
Place of birth for the foreign-born population - Mexico (%)
Place of birth for the foreign-born population - Nicaragua (%)
Place of birth for the foreign-born population - Panama (%)
Place of birth for the foreign-born population - Other Central America (%)
Place of birth for the foreign-born population - Argentina (%)
Place of birth for the foreign-born population - Bolivia (%)
Place of birth for the foreign-born population - Brazil (%)
Place of birth for the foreign-born population - Chile (%)
Place of birth for the foreign-born population - Colombia (%)
Place of birth for the foreign-born population - Ecuador (%)
Place of birth for the foreign-born population - Guyana (%)
Place of birth for the foreign-born population - Peru (%)
Place of birth for the foreign-born population - Uruguay (%)
Place of birth for the foreign-born population - Venezuela (%)
Place of birth for the foreign-born population - Other South America (%)
Place of birth for the foreign-born population - Canada (%)
Place of birth for the foreign-born population - Other Northern America (%)
Place of birth for the foreign-born population - Other (%)
Latest news about races in Derby, CT collected exclusively by city-data.com from local newspapers, TV, and radio stations
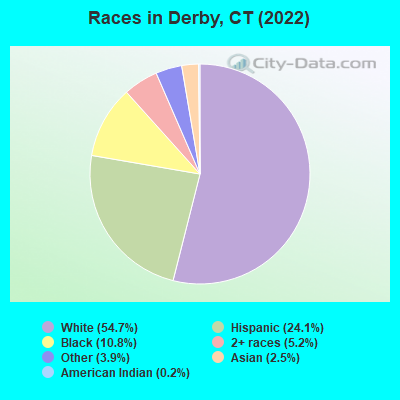
According to 2022 data, the most numerous races in Derby, CT are White alone (6,793 residents), Hispanic (2,995 residents), and Black alone (1,344 residents). 73.0% of Derby residents speak English at home. 14.5% of Derby, CT residents are foreign-born (8.0% born in Latin America, 3.7% born in Europe, 2.3% born in Asia), which is 3.2% less than the foreign-born rate of 15.0% across the entire state of Connecticut.
Race distribution in Derby
2000 2022
2,638,845 77.5% White alone 320,323 9.4% Hispanic 295,571 8.7% Black alone 81,564 2.4% Asian alone 52,896 1.6% Two or more races 8,141 0.2% Other race alone 7,267 0.2% American Indian alone 958 0.03% Native Hawaiian and Other
2,246,913 62.0% White alone 658,978 18.2% Hispanic 353,973 9.8% Black alone 172,929 4.8% Asian alone 159,631 4.4% Two or more races 29,761 0.8% Other race alone 3,428 0.09% American Indian alone 592 0.02% Native Hawaiian and Other
Income and house value in Derby Median household income in 2022 $73,376 White non-Hispanic householders$84,884 Black householders$80,943 Some other race householders$98,920 Two or more races householders$46,824 Hispanic or Latino race householdersMedian 2022 house value $243,785 White Non-Hispanic householders$160,252 Black or African American householders $336,101 Asian householders$291,287 Two or more races householders$201,660 Hispanic or Latino householders
Median age by race in Derby
52.6 Median age for White residents51.9 53.4 40.4 Median age for Black or African American residents47.9 36.9 -742,173,111.6 Median age for American Indian / Alaska Native residents-701,030,927.1 -704,477,611.2 61.5 Median age for Asian residents63.5 55.3 -641,269,840.6 Median age for Native Hawaiian / Pacific Islander residents-414,239,481.8 -691,588,784.4 40.3 Median age for Other race residents35.1 41.5 19.4 Median age for Two or more races residents16.4 33.7 54.0 Median age for White alone residents53.9 54.3 31.2 Median age for Hispanic or Latino residents27.4 32.8
Owner/renter occupied households by race in Derby
House owners and renters - White residents 2,760 67.1% Owner occupied1,351 32.9% Renter occupiedHouse owners and renters - Black or African American residents 329 48.4% Owner occupied352 51.6% Renter occupiedHouse owners and renters - American Indian / Alaska Native residents 20 100.0% Renter occupiedHouse owners and renters - Asian residents 64 47.2% Owner occupied72 52.8% Renter occupiedHouse owners and renters - Other race residents 304 68.5% Owner occupied140 31.5% Renter occupiedHouse owners and renters - Two or more races residents 341 82.8% Owner occupied71 17.2% Renter occupiedHouse owners and renters - White alone residents 2,339 62.7% Owner occupied1,394 37.3% Renter occupiedHouse owners and renters - Hispanic or Latino residents 785 75.8% Owner occupied251 24.2% Renter occupied
Language usage in Derby
English speakers - Total 73.0% of residents of Derby speak English at home.
16.6% of residents speak Spanish at home 1,290 64.4% Speak English very well712 35.6% Speak English less than very well10.5% of residents speak other language at home 838 66.6% Speak English very well421 33.4% Speak English less than very well
English speakers - Born in the United States 68.6% of residents of Derby speak English at home.
27.8% of residents speak Spanish at home 312 43.2% Speak English very well411 56.8% Speak English less than very well8.1% of residents speak other language at home 211 100.0% Speak English very well
English speakers - Native, born elsewhere 51.5% of residents of Derby speak English at home.
45.7% of residents speak Spanish at home 204 95.3% Speak English very well10 4.7% Speak English less than very well7.7% of residents speak other language at home 36 100.0% Speak English very well
English speakers - Foreign-born 15.4% of residents of Derby speak English at home.
41.5% of residents speak Spanish at home 423 56.6% Speak English very well325 43.4% Speak English less than very well43.5% of residents speak other language at home 384 49.0% Speak English very well400 51.0% Speak English less than very well
White (Caucasian) - Speak only English Native:
88.9% (6,182)Foreign-born:
16.7% (119)
White (Caucasian) - Speak another language Native:
9.7% (675)Foreign-born:
80.8% (577)
Black or African American - Speak only English Native:
80.3% (985)Foreign-born:
35.8% (129)
Black or African American - Speak another language Native:
21.1% (259)Foreign-born:
56.7% (204)
Asian - Speak only English Native:
32.4% (12)Foreign-born:
9.7% (27)
Asian - Speak another language Native:
66.5% (25)Foreign-born:
90.6% (252)
Other race - Speak another language Native:
31.6% (275)Foreign-born:
100.0% (149)
Two or more races - Speak another language Native:
26.0% (310)Foreign-born:
100.0% (171)
White alone - Speak only English Native:
95.7% (6,006)Foreign-born:
26.8% (124)
White alone - Speak another language Native:
4.3% (270)Foreign-born:
73.0% (336)
Hispanic or Latino - Speak another language Native:
53.1% (1,139)Foreign-born:
100.0% (657)
Foreign-born residents in Derby 1,806 residents are foreign born (8.0% Latin America , 3.7% Europe , 2.3% Asia ).
This city:
14.5%Connecticut:
15.0%
Marital status for residents in Derby Marital status - White (Caucasian) population 15 years and over
Males 34.6% Never married49.8% Now married0.0% Separated5.2% Widowed10.4% DivorcedFemales 24.1% Never married38.6% Now married3.8% Separated11.3% Widowed22.2% DivorcedWomen who gave birth in the past 12 months Now married:
72.5% (53)Unmarried:
27.5% (20)
Women who did not give birth in the past 12 months Now married:
47.5% (740)Unmarried:
52.5% (818)
Marital status - Black or African American population 15 years and over
Males 32.2% Never married37.4% Now married14.8% Separated0.0% Widowed15.6% DivorcedFemales 29.8% Never married51.4% Now married0.0% Separated9.3% Widowed9.5% DivorcedWomen who did not give birth in the past 12 months Now married:
55.4% (310)Unmarried:
44.6% (249)
Marital status - Asian population 15 years and over
Males 0.0% Never married100.0% Now married0.0% Separated0.0% Widowed0.0% DivorcedFemales 15.7% Never married57.6% Now married0.0% Separated26.8% Widowed0.0% DivorcedWomen who did not give birth in the past 12 months Now married:
63.5% (53)Unmarried:
36.5% (30)
Marital status - Other race population 15 years and over
Males 37.6% Never married62.4% Now married0.0% Separated0.0% Widowed0.0% DivorcedFemales 33.1% Never married54.1% Now married0.0% Separated0.0% Widowed12.8% DivorcedWomen who gave birth in the past 12 months Now married:
100.0% (98)Unmarried:
0.0% (0)
Women who did not give birth in the past 12 months Now married:
9.1% (28)Unmarried:
90.9% (282)
Marital status - Two or more races population 15 years and over
Males 54.7% Never married36.8% Now married0.0% Separated0.0% Widowed8.5% DivorcedFemales 49.5% Never married50.5% Now married0.0% Separated0.0% Widowed0.0% DivorcedWomen who did not give birth in the past 12 months Now married:
36.6% (185)Unmarried:
63.4% (321)
Marital status - White alone, not Hispanic / Latino population 15 years and over
Males 30.9% Never married51.1% Now married0.0% Separated6.0% Widowed12.0% DivorcedFemales 24.7% Never married40.2% Now married4.5% Separated11.8% Widowed18.7% DivorcedWomen who gave birth in the past 12 months Now married:
72.5% (56)Unmarried:
27.5% (21)
Women who did not give birth in the past 12 months Now married:
47.3% (643)Unmarried:
52.7% (717)
Marital status - Hispanic or Latino population 15 years and over
Males 59.2% Never married40.8% Now married0.0% Separated0.0% Widowed0.0% DivorcedFemales 35.6% Never married33.8% Now married0.0% Separated4.4% Widowed26.2% DivorcedWomen who gave birth in the past 12 months Now married:
100.0% (16)Unmarried:
0.0% (0)
Women who did not give birth in the past 12 months Now married:
36.1% (311)Unmarried:
63.9% (550)
Ancestries in Derby
1,221 20.1% Italian424 7.0% Irish379 6.2% English350 5.8% Polish196 3.2% American174 2.9% Jamaican169 2.8% Scottish147 2.4% Albanian140 2.3% German134 2.2% Ukrainian56 0.9% Brazilian53 0.9% French Canadian48 0.8% Greek48 0.8% Haitian38 0.6% Macedonian24 0.4% Hungarian21 0.3% Romanian18 0.3% Portuguese15 0.2% Canadian14 0.2% Lithuanian13 0.2% Iranian11 0.2% Slovak7 0.1% European7 0.1% Russian7 0.1% U.S. Virgin Islander
Geographical mobility in Derby Same house 1 year ago 7,157 91.7% White (Caucasian)1,565 93.1% Black or African American52 94.8% American Indian / Alaska Native265 85.3% Asian1,052 100.0% Other race1,400 97.0% Two or more races6,099 90.4% White alone, not Hispanic / Latino2,992 100.0% Hispanic or LatinoMoved within same county 333 4.3% White / Caucasian11 0.7% Black or African American10 3.2% Asian16 1.1% Two or more races352 5.2% White alone, not Hispanic / Latino11 0.4% Hispanic or LatinoMoved within same state 97 1.2% White / Caucasian46 2.8% Black or African American101 1.5% White alone, not Hispanic / LatinoMoved from different state 101 1.3% White / Caucasian61 3.6% Black or African American40 2.8% Two or more races103 1.5% White alone, not Hispanic / Latino13 0.4% Hispanic or LatinoMoved from abroad 63 0.8% White38 12.3% Asian39 0.6% White alone, not Hispanic / Latino27 0.9% Hispanic or Latino
Children Nativity (place of birth) in Derby
Children under 6 years - Living with two parents Both parents native 231 100.0% NativeBoth parents foreign-born 63 100.0% NativeOne native, one foreign-born parent 40 100.0% NativeChildren under 6 years - Living with one parent Native parent 140 100.0% NativeChildren 6 to 17 years - Living with two parents Both parents native 391 100.0% NativeBoth parents foreign-born 74 80.0% Native18 20.0% Foreign-bornOne native, one foreign-born parent 220 100.0% NativeChildren 6 to 17 years - Living with one parent Native parent 703 100.0% Native
Grandparents responsible for own grandchildren in Derby
Grandparents (30 to 59 years) White / Caucasian 54 100.0% Responsible for grandchildrenWhite alone, not Hispanic / Latino 61 100.0% Responsible for grandchildren
Grandparents (60 years and over) White / Caucasian 87 100.0% Not responsible for grandchildrenWhite alone, not Hispanic / Latino 59 100.0% Not responsible for grandchildren