Races in Deltona, Florida (FL) Detailed Stats
Data:
Races - White alone (%)
Races - White alone (% change since 2000)
Races - Black alone (%)
Races - Black alone (% change since 2000)
Races - American Indian alone (%)
Races - American Indian alone (% change since 2000)
Races - Asian alone (%)
Races - Asian alone (% change since 2000)
Races - Hispanic (%)
Races - Hispanic (% change since 2000)
Races - Native Hawaiian and Other Pacific Islander alone (%)
Races - Native Hawaiian and Other Pacific Islander alone (% change since 2000)
Races - Two or more races(%)
Races - Two or more races(% change since 2000)
Races - Other race alone (%)
Races - Other race alone (% change since 2000)
Racial diversity
Place of birth - Born in state of residence (%)
Place of birth - Born in state of residence (%) - White
Place of birth - Born in state of residence (%) - Black or African American
Place of birth - Born in state of residence (%) - Asian
Place of birth - Born in state of residence (%) - Hispanic or Latino
Place of birth - Born in state of residence (%) - American Indian and Alaska Native
Place of birth - Born in state of residence (%) - Multirace
Place of birth - Born in state of residence (%) - Other Race
Place of birth - Born in other state (%)
Place of birth - Born in other state (%) - White
Place of birth - Born in other state (%) - Black or African American
Place of birth - Born in other state (%) - Asian
Place of birth - Born in other state (%) - Hispanic or Latino
Place of birth - Born in other state (%) - American Indian and Alaska Native
Place of birth - Born in other state (%) - Multirace
Place of birth - Born in other state (%) - Other Race
Place of birth - Native, outside of US (%)
Place of birth - Native, outside of US (%) - White
Place of birth - Native, outside of US (%) - Black or African American
Place of birth - Native, outside of US (%) - Asian
Place of birth - Native, outside of US (%) - Hispanic or Latino
Place of birth - Native, outside of US (%) - American Indian and Alaska Native
Place of birth - Native, outside of US (%) - Multirace
Place of birth - Native, outside of US (%) - Other Race
Place of birth - Foreign born (%)
Place of birth - Foreign born (%) - White
Place of birth - Foreign born (%) - Black or African American
Place of birth - Foreign born (%) - Asian
Place of birth - Foreign born (%) - Hispanic or Latino
Place of birth - Foreign born (%) - American Indian and Alaska Native
Place of birth - Foreign born (%) - Multirace
Place of birth - Foreign born (%) - Other Race
Residents speaking English at home (%)
Residents speaking English at home - Born in the United States (%)
Residents speaking English at home - Native, born elsewhere (%)
Residents speaking English at home - Foreign born (%)
Residents speaking Spanish at home (%)
Residents speaking Spanish at home - Born in the United States (%)
Residents speaking Spanish at home - Native, born elsewhere (%)
Residents speaking Spanish at home - Foreign born (%)
Residents speaking other language at home (%)
Residents speaking other language at home - Born in the United States (%)
Residents speaking other language at home - Native, born elsewhere (%)
Residents speaking other language at home - Foreign born (%)
Marital status - Never married (%)
Marital status - Now married (%)
Marital status - Separated (%)
Marital status - Widowed (%)
Marital status - Divorced (%)
Ancestries Reported - Arab (%)
Ancestries Reported - Czech (%)
Ancestries Reported - Danish (%)
Ancestries Reported - Dutch (%)
Ancestries Reported - English (%)
Ancestries Reported - French (%)
Ancestries Reported - French Canadian (%)
Ancestries Reported - German (%)
Ancestries Reported - Greek (%)
Ancestries Reported - Hungarian (%)
Ancestries Reported - Irish (%)
Ancestries Reported - Italian (%)
Ancestries Reported - Lithuanian (%)
Ancestries Reported - Norwegian (%)
Ancestries Reported - Polish (%)
Ancestries Reported - Portuguese (%)
Ancestries Reported - Russian (%)
Ancestries Reported - Scotch-Irish (%)
Ancestries Reported - Scottish (%)
Ancestries Reported - Slovak (%)
Ancestries Reported - Subsaharan African (%)
Ancestries Reported - Swedish (%)
Ancestries Reported - Swiss (%)
Ancestries Reported - Ukrainian (%)
Ancestries Reported - United States (%)
Ancestries Reported - Welsh (%)
Ancestries Reported - West Indian (%)
Ancestries Reported - Other (%)
Geographical mobility - Same house 1 year ago (%)
Geographical mobility - Same house 1 year ago (%) - White
Geographical mobility - Same house 1 year ago (%) - Black or African American
Geographical mobility - Same house 1 year ago (%) - Asian
Geographical mobility - Same house 1 year ago (%) - Hispanic or Latino
Geographical mobility - Same house 1 year ago (%) - American Indian and Alaska Native
Geographical mobility - Same house 1 year ago (%) - Multirace
Geographical mobility - Same house 1 year ago (%) - Other Race
Geographical mobility - Moved within same county (%)
Geographical mobility - Moved within same county (%) - White
Geographical mobility - Moved within same county (%) - Black or African American
Geographical mobility - Moved within same county (%) - Asian
Geographical mobility - Moved within same county (%) - Hispanic or Latino
Geographical mobility - Moved within same county (%) - American Indian and Alaska Native
Geographical mobility - Moved within same county (%) - Multirace
Geographical mobility - Moved within same county (%) - Other Race
Geographical mobility - Moved from different county within same state (%)
Geographical mobility - Moved from different county within same state (%) - White
Geographical mobility - Moved from different county within same state (%) - Black or African American
Geographical mobility - Moved from different county within same state (%) - Asian
Geographical mobility - Moved from different county within same state (%) - Hispanic or Latino
Geographical mobility - Moved from different county within same state (%) - American Indian and Alaska Native
Geographical mobility - Moved from different county within same state (%) - Multirace
Geographical mobility - Moved from different county within same state (%) - Other Race
Geographical mobility - Moved from different state (%)
Geographical mobility - Moved from different state (%) - White
Geographical mobility - Moved from different state (%) - Black or African American
Geographical mobility - Moved from different state (%) - Asian
Geographical mobility - Moved from different state (%) - Hispanic or Latino
Geographical mobility - Moved from different state (%) - American Indian and Alaska Native
Geographical mobility - Moved from different state (%) - Multirace
Geographical mobility - Moved from different state (%) - Other Race
Geographical mobility - Moved from abroad (%)
Geographical mobility - Moved from abroad (%) - White
Geographical mobility - Moved from abroad (%) - Black or African American
Geographical mobility - Moved from abroad (%) - Asian
Geographical mobility - Moved from abroad (%) - Hispanic or Latino
Geographical mobility - Moved from abroad (%) - American Indian and Alaska Native
Geographical mobility - Moved from abroad (%) - Multirace
Geographical mobility - Moved from abroad (%) - Other Race
Place of birth for the foreign-born population - Ireland (%)
Place of birth for the foreign-born population - Denmark (%)
Place of birth for the foreign-born population - Norway (%)
Place of birth for the foreign-born population - Sweden (%)
Place of birth for the foreign-born population - United Kingdom (%)
Place of birth for the foreign-born population - England (%)
Place of birth for the foreign-born population - Scotland (%)
Place of birth for the foreign-born population - Other Northern Europe (%)
Place of birth for the foreign-born population - Austria (%)
Place of birth for the foreign-born population - Belgium (%)
Place of birth for the foreign-born population - France (%)
Place of birth for the foreign-born population - Germany (%)
Place of birth for the foreign-born population - Netherlands (%)
Place of birth for the foreign-born population - Switzerland (%)
Place of birth for the foreign-born population - Other Western Europe (%)
Place of birth for the foreign-born population - Greece (%)
Place of birth for the foreign-born population - Italy (%)
Place of birth for the foreign-born population - Portugal (%)
Place of birth for the foreign-born population - Spain (%)
Place of birth for the foreign-born population - Other Southern Europe (%)
Place of birth for the foreign-born population - Albania (%)
Place of birth for the foreign-born population - Belarus (%)
Place of birth for the foreign-born population - Bosnia and Herzegovina (%)
Place of birth for the foreign-born population - Bulgaria (%)
Place of birth for the foreign-born population - Croatia (%)
Place of birth for the foreign-born population - Czechoslovakia (%)
Place of birth for the foreign-born population - Hungary (%)
Place of birth for the foreign-born population - Latvia (%)
Place of birth for the foreign-born population - Lithuania (%)
Place of birth for the foreign-born population - North Macedonia (Macedonia) (%)
Place of birth for the foreign-born population - Moldova (%)
Place of birth for the foreign-born population - Poland (%)
Place of birth for the foreign-born population - Romania (%)
Place of birth for the foreign-born population - Russia (%)
Place of birth for the foreign-born population - Serbia (%)
Place of birth for the foreign-born population - Ukraine (%)
Place of birth for the foreign-born population - Other Eastern Europe (%)
Place of birth for the foreign-born population - China (%)
Place of birth for the foreign-born population - Hong Kong (%)
Place of birth for the foreign-born population - Taiwan (%)
Place of birth for the foreign-born population - Japan (%)
Place of birth for the foreign-born population - Korea (%)
Place of birth for the foreign-born population - Other Eastern Asia (%)
Place of birth for the foreign-born population - Afghanistan (%)
Place of birth for the foreign-born population - Bangladesh (%)
Place of birth for the foreign-born population - India (%)
Place of birth for the foreign-born population - Iran (%)
Place of birth for the foreign-born population - Kazakhstan (%)
Place of birth for the foreign-born population - Nepal (%)
Place of birth for the foreign-born population - Pakistan (%)
Place of birth for the foreign-born population - Sri Lanka (%)
Place of birth for the foreign-born population - Uzbekistan (%)
Place of birth for the foreign-born population - Other South Central Asia (%)
Place of birth for the foreign-born population - Burma (%)
Place of birth for the foreign-born population - Cambodia (%)
Place of birth for the foreign-born population - Indonesia (%)
Place of birth for the foreign-born population - Laos (%)
Place of birth for the foreign-born population - Malaysia (%)
Place of birth for the foreign-born population - Philippines (%)
Place of birth for the foreign-born population - Singapore (%)
Place of birth for the foreign-born population - Thailand (%)
Place of birth for the foreign-born population - Vietnam (%)
Place of birth for the foreign-born population - Other South Eastern Asia (%)
Place of birth for the foreign-born population - Armenia (%)
Place of birth for the foreign-born population - Iraq (%)
Place of birth for the foreign-born population - Israel (%)
Place of birth for the foreign-born population - Jordan (%)
Place of birth for the foreign-born population - Kuwait (%)
Place of birth for the foreign-born population - Lebanon (%)
Place of birth for the foreign-born population - Saudi Arabia (%)
Place of birth for the foreign-born population - Syria (%)
Place of birth for the foreign-born population - Turkey (%)
Place of birth for the foreign-born population - Yemen (%)
Place of birth for the foreign-born population - Other Western Asia (%)
Place of birth for the foreign-born population - Eritrea (%)
Place of birth for the foreign-born population - Ethiopia (%)
Place of birth for the foreign-born population - Kenya (%)
Place of birth for the foreign-born population - Somalia (%)
Place of birth for the foreign-born population - Uganda (%)
Place of birth for the foreign-born population - Zimbabwe (%)
Place of birth for the foreign-born population - Other Eastern Africa (%)
Place of birth for the foreign-born population - Cameroon (%)
Place of birth for the foreign-born population - Congo (%)
Place of birth for the foreign-born population - Democratic Republic of Congo (Zaire) (%)
Place of birth for the foreign-born population - Other Middle Africa (%)
Place of birth for the foreign-born population - Egypt (%)
Place of birth for the foreign-born population - Morocco (%)
Place of birth for the foreign-born population - Sudan (%)
Place of birth for the foreign-born population - Other Northern Africa (%)
Place of birth for the foreign-born population - South Africa (%)
Place of birth for the foreign-born population - Other Southern Africa (%)
Place of birth for the foreign-born population - Cabo Verde (%)
Place of birth for the foreign-born population - Ghana (%)
Place of birth for the foreign-born population - Liberia (%)
Place of birth for the foreign-born population - Nigeria (%)
Place of birth for the foreign-born population - Senegal (%)
Place of birth for the foreign-born population - Sierra Leone (%)
Place of birth for the foreign-born population - Other Western Africa (%)
Place of birth for the foreign-born population - Australia (%)
Place of birth for the foreign-born population - New Zealand (%)
Place of birth for the foreign-born population - Fiji (%)
Place of birth for the foreign-born population - Micronesia (%)
Place of birth for the foreign-born population - Bahamas (%)
Place of birth for the foreign-born population - Barbados (%)
Place of birth for the foreign-born population - Cuba (%)
Place of birth for the foreign-born population - Dominica (%)
Place of birth for the foreign-born population - Dominican Republic (%)
Place of birth for the foreign-born population - Grenada (%)
Place of birth for the foreign-born population - Haiti (%)
Place of birth for the foreign-born population - Jamaica (%)
Place of birth for the foreign-born population - St. Vincent and the Grenadines (%)
Place of birth for the foreign-born population - Trinidad and Tobago (%)
Place of birth for the foreign-born population - West Indies (%)
Place of birth for the foreign-born population - Other Caribbean (%)
Place of birth for the foreign-born population - Belize (%)
Place of birth for the foreign-born population - Costa Rica (%)
Place of birth for the foreign-born population - El Salvador (%)
Place of birth for the foreign-born population - Guatemala (%)
Place of birth for the foreign-born population - Honduras (%)
Place of birth for the foreign-born population - Mexico (%)
Place of birth for the foreign-born population - Nicaragua (%)
Place of birth for the foreign-born population - Panama (%)
Place of birth for the foreign-born population - Other Central America (%)
Place of birth for the foreign-born population - Argentina (%)
Place of birth for the foreign-born population - Bolivia (%)
Place of birth for the foreign-born population - Brazil (%)
Place of birth for the foreign-born population - Chile (%)
Place of birth for the foreign-born population - Colombia (%)
Place of birth for the foreign-born population - Ecuador (%)
Place of birth for the foreign-born population - Guyana (%)
Place of birth for the foreign-born population - Peru (%)
Place of birth for the foreign-born population - Uruguay (%)
Place of birth for the foreign-born population - Venezuela (%)
Place of birth for the foreign-born population - Other South America (%)
Place of birth for the foreign-born population - Canada (%)
Place of birth for the foreign-born population - Other Northern America (%)
Place of birth for the foreign-born population - Other (%)
Latest news about races in Deltona, FL collected exclusively by city-data.com from local newspapers, TV, and radio stations
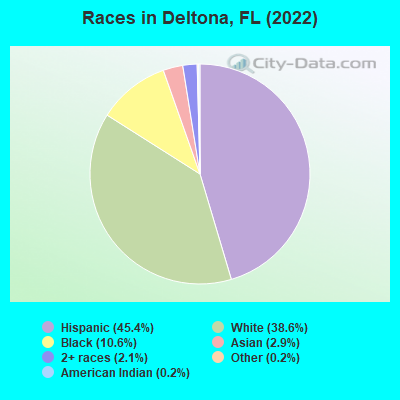
According to 2022 data, the most numerous races in Deltona, FL are White alone (37,511 residents), Hispanic (44,187 residents), and Black alone (10,341 residents). 67.9% of Deltona residents speak English at home. 11.5% of Deltona, FL residents are foreign-born (8.4% born in Latin America), which is 81.9% less than the foreign-born rate of 21.0% across the entire state of Florida.
Race distribution in Deltona
2000 2022
10,458,509 65.4% White alone 2,682,715 16.8% Hispanic 2,264,268 14.2% Black alone 261,693 1.6% Asian alone 236,954 1.5% Two or more races 42,358 0.3% American Indian alone 28,994 0.2% Other race alone 6,887 0.04% Native Hawaiian and Other
11,309,403 50.8% White alone 6,025,039 27.1% Hispanic 3,241,015 14.6% Black alone 861,630 3.9% Two or more races 623,692 2.8% Asian alone 152,054 0.7% Other race alone 22,504 0.1% American Indian alone 9,486 0.04% Native Hawaiian and Other
Income and house value in Deltona Median household income in 2022 $73,475 White non-Hispanic householders$86,265 Black householders$85,950 Asian householders$65,996 Some other race householders$85,356 Two or more races householders$71,630 Hispanic or Latino race householdersMedian 2022 house value $287,590 White Non-Hispanic householders$304,154 Black or African American householders$328,120 American Indian or Alaska Native householders $292,524 Asian householders$286,885 Some other race householders$304,507 Two or more races householders$295,343 Hispanic or Latino householders
Median age by race in Deltona
43.5 Median age for White residents42.7 44.2 34.1 Median age for Black or African American residents34.1 34.2 37.6 Median age for American Indian / Alaska Native residents34.3 36.0 40.2 Median age for Asian residents40.5 39.7 -666,666,666.0 Median age for Native Hawaiian / Pacific Islander residents-666,666,666.0 -666,666,666.0 33.6 Median age for Other race residents31.5 34.3 37.0 Median age for Two or more races residents35.5 49.2 46.0 Median age for White alone residents45.8 46.1 34.6 Median age for Hispanic or Latino residents31.9 37.4
Owner/renter occupied households by race in Deltona
House owners and renters - White residents 14,499 82.0% Owner occupied3,180 18.0% Renter occupiedHouse owners and renters - Black or African American residents 3,113 83.6% Owner occupied610 16.4% Renter occupiedHouse owners and renters - American Indian / Alaska Native residents 65 77.1% Owner occupied19 22.9% Renter occupiedHouse owners and renters - Asian residents 675 88.8% Owner occupied85 11.2% Renter occupiedHouse owners and renters - Native Hawaiian / Pacific Islander residents 12 100.0% Renter occupiedHouse owners and renters - Other race residents 6,272 82.3% Owner occupied1,350 17.7% Renter occupiedHouse owners and renters - Two or more races residents 2,760 93.9% Owner occupied178 6.1% Renter occupiedHouse owners and renters - White alone residents 12,755 83.4% Owner occupied2,532 16.6% Renter occupiedHouse owners and renters - Hispanic or Latino residents 10,684 83.4% Owner occupied2,127 16.6% Renter occupied
Language usage in Deltona
English speakers - Total 67.9% of residents of Deltona speak English at home.
28.1% of residents speak Spanish at home 19,839 76.5% Speak English very well6,109 23.5% Speak English less than very well4.0% of residents speak other language at home 2,079 57.0% Speak English very well1,568 43.0% Speak English less than very well
English speakers - Born in the United States 77.8% of residents of Deltona speak English at home.
20.5% of residents speak Spanish at home 7,659 88.1% Speak English very well1,033 11.9% Speak English less than very well1.8% of residents speak other language at home 609 80.3% Speak English very well149 19.7% Speak English less than very well
English speakers - Native, born elsewhere 16.8% of residents of Deltona speak English at home.
79.7% of residents speak Spanish at home 5,810 71.7% Speak English very well2,297 28.3% Speak English less than very well3.5% of residents speak other language at home 248 70.7% Speak English very well103 29.3% Speak English less than very well
English speakers - Foreign-born 24.5% of residents of Deltona speak English at home.
51.9% of residents speak Spanish at home 3,465 66.1% Speak English very well1,780 33.9% Speak English less than very well23.6% of residents speak other language at home 1,072 44.9% Speak English very well1,316 55.1% Speak English less than very well
White (Caucasian) - Speak only English Native:
92.7% (38,708)Foreign-born:
38.3% (764)
White (Caucasian) - Speak another language Native:
7.3% (3,051)Foreign-born:
61.7% (1,230)
Black or African American - Speak only English Native:
85.3% (8,021)Foreign-born:
56.0% (742)
Black or African American - Speak another language Native:
14.7% (1,379)Foreign-born:
44.0% (582)
American Indian / Alaska Native - Speak another language Native:
17.8% (48)Foreign-born:
100.0% (63)
Asian - Speak only English Native:
40.3% (362)Foreign-born:
7.7% (127)
Asian - Speak another language Native:
59.7% (536)Foreign-born:
92.3% (1,513)
Other race - Speak only English Native:
37.4% (7,893)Foreign-born:
7.4% (268)
Other race - Speak another language Native:
62.6% (13,233)Foreign-born:
92.6% (3,368)
Two or more races - Speak only English Native:
56.0% (4,787)Foreign-born:
38.1% (578)
Two or more races - Speak another language Native:
44.0% (3,763)Foreign-born:
61.9% (940)
White alone - Speak only English Native:
98.3% (34,204)Foreign-born:
69.8% (764)
White alone - Speak another language Native:
1.7% (588)Foreign-born:
30.2% (331)
Hispanic or Latino - Speak only English Native:
44.4% (15,891)Foreign-born:
14.4% (876)
Hispanic or Latino - Speak another language Native:
55.6% (19,935)Foreign-born:
85.6% (5,207)
Foreign-born residents in Deltona 11,297 residents are foreign born (8.4% Latin America ).
This city:
11.5%Florida:
21.1%
Marital status for residents in Deltona Marital status - White (Caucasian) population 15 years and over
Males 34.9% Never married45.0% Now married2.8% Separated4.0% Widowed13.3% DivorcedFemales 24.1% Never married48.0% Now married3.5% Separated7.1% Widowed17.3% DivorcedWomen who gave birth in the past 12 months Now married:
100.0% (549)Unmarried:
0.0% (0)
Women who did not give birth in the past 12 months Now married:
42.3% (3,990)Unmarried:
57.7% (5,433)
Marital status - Black or African American population 15 years and over
Males 45.1% Never married49.4% Now married2.0% Separated0.6% Widowed2.9% DivorcedFemales 31.2% Never married36.6% Now married0.0% Separated4.2% Widowed27.9% DivorcedWomen who gave birth in the past 12 months Now married:
43.6% (106)Unmarried:
56.4% (137)
Women who did not give birth in the past 12 months Now married:
32.9% (851)Unmarried:
67.1% (1,739)
Marital status - American Indian / Alaska Native population 15 years and over
Males 37.5% Never married62.5% Now married0.0% Separated0.0% Widowed0.0% DivorcedFemales 32.4% Never married38.9% Now married0.0% Separated28.7% Widowed0.0% DivorcedWomen who did not give birth in the past 12 months Now married:
25.5% (20)Unmarried:
74.5% (57)
Marital status - Asian population 15 years and over
Males 37.1% Never married45.2% Now married2.6% Separated2.1% Widowed13.0% DivorcedFemales 13.2% Never married66.2% Now married0.0% Separated3.0% Widowed17.6% DivorcedWomen who gave birth in the past 12 months Now married:
100.0% (70)Unmarried:
0.0% (0)
Women who did not give birth in the past 12 months Now married:
59.2% (289)Unmarried:
40.8% (199)
Marital status - Other race population 15 years and over
Males 44.8% Never married47.0% Now married0.0% Separated0.4% Widowed7.7% DivorcedFemales 33.5% Never married45.3% Now married4.7% Separated10.6% Widowed5.8% DivorcedWomen who gave birth in the past 12 months Now married:
45.6% (62)Unmarried:
54.4% (74)
Women who did not give birth in the past 12 months Now married:
42.7% (2,486)Unmarried:
57.3% (3,333)
Marital status - Two or more races population 15 years and over
Males 30.7% Never married57.5% Now married4.6% Separated3.4% Widowed3.8% DivorcedFemales 28.5% Never married57.8% Now married1.1% Separated6.5% Widowed6.1% DivorcedWomen who gave birth in the past 12 months Now married:
100.0% (70)Unmarried:
0.0% (0)
Women who did not give birth in the past 12 months Now married:
45.7% (1,059)Unmarried:
54.3% (1,258)
Marital status - White alone, not Hispanic / Latino population 15 years and over
Males 30.6% Never married46.0% Now married3.3% Separated4.7% Widowed15.4% DivorcedFemales 20.7% Never married49.7% Now married3.6% Separated6.9% Widowed19.1% DivorcedWomen who gave birth in the past 12 months Now married:
100.0% (549)Unmarried:
0.0% (0)
Women who did not give birth in the past 12 months Now married:
42.1% (2,931)Unmarried:
57.9% (4,025)
Marital status - Hispanic or Latino population 15 years and over
Males 43.7% Never married49.2% Now married1.6% Separated1.0% Widowed4.6% DivorcedFemales 33.6% Never married47.3% Now married3.7% Separated8.9% Widowed6.4% DivorcedWomen who gave birth in the past 12 months Now married:
76.0% (189)Unmarried:
24.0% (60)
Women who did not give birth in the past 12 months Now married:
44.5% (4,520)Unmarried:
55.5% (5,628)
Ancestries in Deltona
1,619 2.9% Irish1,615 2.9% German1,596 2.9% American1,572 2.8% Italian1,160 2.1% English876 1.6% Jamaican663 1.2% European560 1.0% Polish284 0.5% Haitian267 0.5% Ukrainian217 0.4% Scottish206 0.4% French139 0.3% African127 0.2% Canadian127 0.2% Norwegian124 0.2% French Canadian123 0.2% Hungarian120 0.2% British101 0.2% Dutch88 0.2% Czech84 0.2% Trinidadian and Tobagonian73 0.1% Scotch-Irish71 0.1% Romanian71 0.1% Swedish50 0.09% Ghanaian47 0.08% Russian43 0.08% Portuguese42 0.08% Lebanese40 0.07% West Indian36 0.06% Belizean32 0.06% Eastern European32 0.06% Guyanese30 0.05% Nigerian29 0.05% Iranian27 0.05% Croatian27 0.05% Luxembourger23 0.04% Latvian22 0.04% Brazilian19 0.03% Greek19 0.03% Lithuanian17 0.03% Icelander13 0.02% Palestinian11 0.02% Moroccan9 0.02% Finnish8 0.01% Welsh7 0.01% Serbian6 0.01% Slovak4 0.01% Pennsylvania German
Geographical mobility in Deltona Same house 1 year ago 42,636 94.4% White (Caucasian)11,018 97.3% Black or African American373 100.0% American Indian / Alaska Native2,052 100.0% Asian6 36.7% Native Hawaiian / Pacific Islander21,952 92.0% Other race9,837 91.2% Two or more races34,938 93.9% White alone, not Hispanic / Latino37,593 93.3% Hispanic or LatinoMoved within same county 744 1.6% White / Caucasian322 2.8% Black or African American33 1.6% Asian503 2.1% Other race425 3.9% Two or more races744 2.0% White alone, not Hispanic / Latino768 1.9% Hispanic or LatinoMoved within same state 706 1.6% White / Caucasian289 2.6% Black or African American10 0.5% Asian774 3.2% Other race466 4.3% Two or more races626 1.7% White alone, not Hispanic / Latino1,380 3.4% Hispanic or LatinoMoved from different state 827 1.8% White / Caucasian39 0.3% Black or African American57 2.8% Asian17 100.0% Native Hawaiian / Pacific Islander105 0.4% Other race57 0.5% Two or more races685 1.8% White alone, not Hispanic / Latino518 1.3% Hispanic or LatinoMoved from abroad 229 0.5% White78 0.7% Black or African American231 1.0% Other race229 0.6% White alone, not Hispanic / Latino437 1.1% Hispanic or Latino
Children Nativity (place of birth) in Deltona
Children under 6 years - Living with two parents Both parents native 3,569 100.0% NativeBoth parents foreign-born 230 100.0% NativeOne native, one foreign-born parent 568 100.0% NativeChildren under 6 years - Living with one parent Native parent 2,428 100.0% NativeForeign-born parent 79 100.0% NativeChildren 6 to 17 years - Living with two parents Both parents native 5,753 99.5% Native26 0.5% Foreign-bornBoth parents foreign-born 541 82.0% Native118 18.0% Foreign-bornOne native, one foreign-born parent 1,340 100.0% NativeChildren 6 to 17 years - Living with one parent Native parent 7,106 100.0% NativeForeign-born parent 432 52.1% Native396 47.9% Foreign-born
Grandparents responsible for own grandchildren in Deltona
Grandparents (30 to 59 years) White / Caucasian 150 21.5% Responsible for grandchildren545 78.5% Not responsible for grandchildrenBlack or African American 27 34.2% Responsible for grandchildren52 65.8% Not responsible for grandchildrenOther race 249 54.5% Responsible for grandchildren208 45.5% Not responsible for grandchildrenTwo or more races 138 41.2% Responsible for grandchildren198 58.8% Not responsible for grandchildrenWhite alone, not Hispanic / Latino 154 22.0% Responsible for grandchildren546 78.0% Not responsible for grandchildrenHispanic or Latino 104 21.1% Responsible for grandchildren391 78.9% Not responsible for grandchildrenGrandparents (60 years and over) White / Caucasian 153 18.0% Responsible for grandchildren698 82.0% Not responsible for grandchildrenBlack or African American 17 18.4% Responsible for grandchildren76 81.6% Not responsible for grandchildrenOther race 533 60.3% Responsible for grandchildren351 39.7% Not responsible for grandchildrenTwo or more races 111 67.4% Responsible for grandchildren54 32.6% Not responsible for grandchildrenWhite alone, not Hispanic / Latino 136 19.7% Responsible for grandchildren554 80.3% Not responsible for grandchildrenHispanic or Latino 558 50.1% Responsible for grandchildren556 49.9% Not responsible for grandchildren