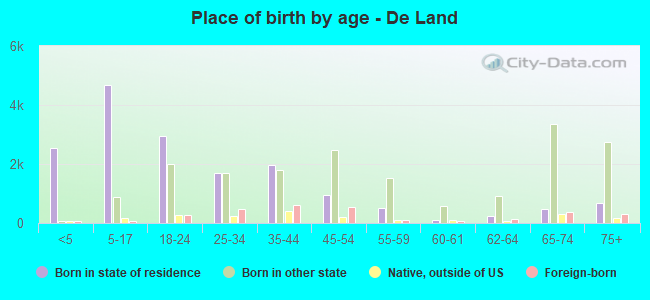
Races in De Land, Florida (FL) Detailed Stats
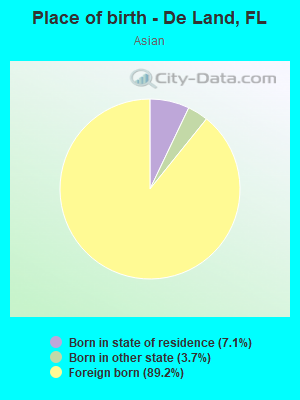
According to 2022 data, the most numerous races in De Land, FL are White alone (23,912 residents), Hispanic (8,307 residents), and Black alone (5,333 residents). 85.4% of De Land residents speak English at home. 7.9% of De Land, FL residents are foreign-born (4.1% born in Latin America, 1.7% born in Europe, 1.4% born in Asia), which is 164.7% less than the foreign-born rate of 21.0% across the entire state of Florida.
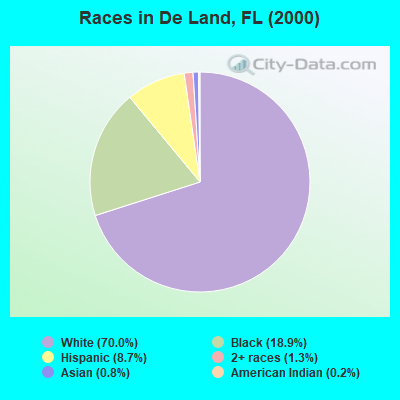
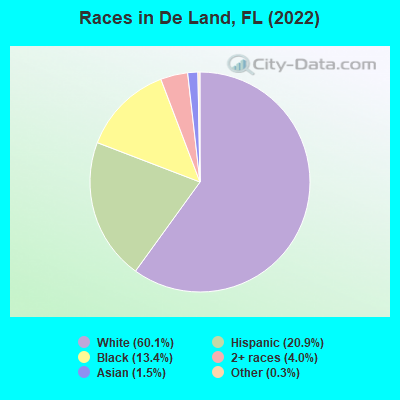
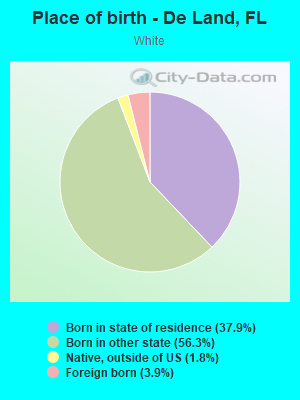
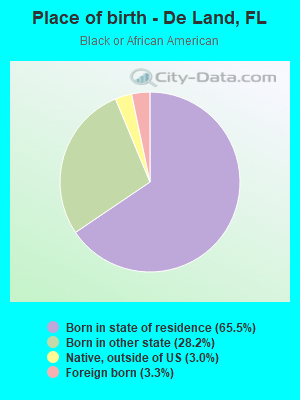
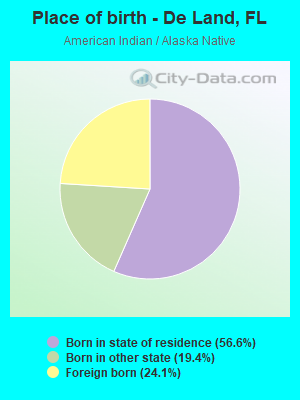
Race distribution in De Land
2000 2022
10,458,509 65.4% White alone 2,682,715 16.8% Hispanic 2,264,268 14.2% Black alone 261,693 1.6% Asian alone 236,954 1.5% Two or more races 42,358 0.3% American Indian alone 28,994 0.2% Other race alone 6,887 0.04% Native Hawaiian and Other
11,309,403 50.8% White alone 6,025,039 27.1% Hispanic 3,241,015 14.6% Black alone 861,630 3.9% Two or more races 623,692 2.8% Asian alone 152,054 0.7% Other race alone 22,504 0.1% American Indian alone 9,486 0.04% Native Hawaiian and Other
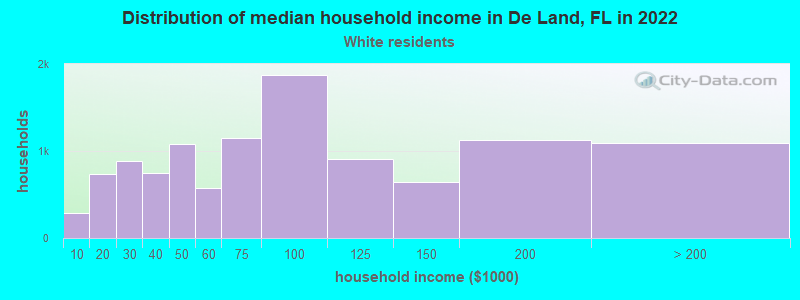
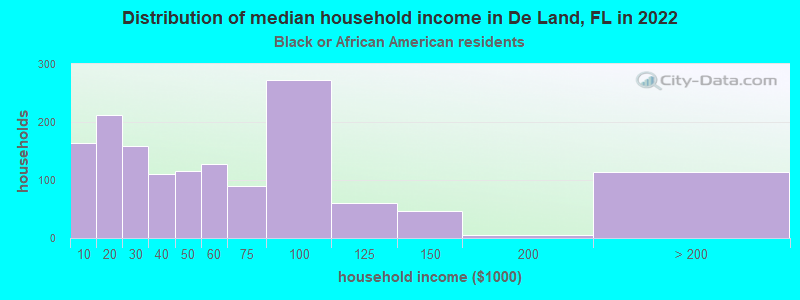
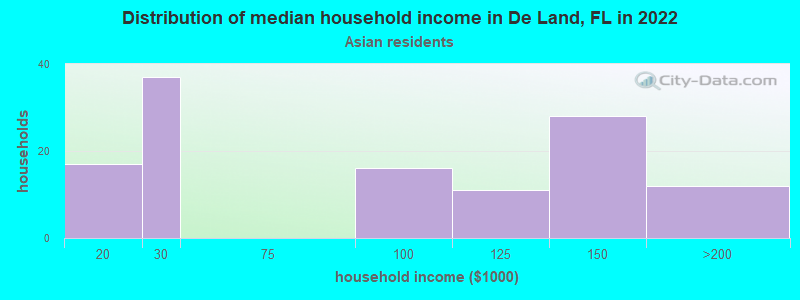
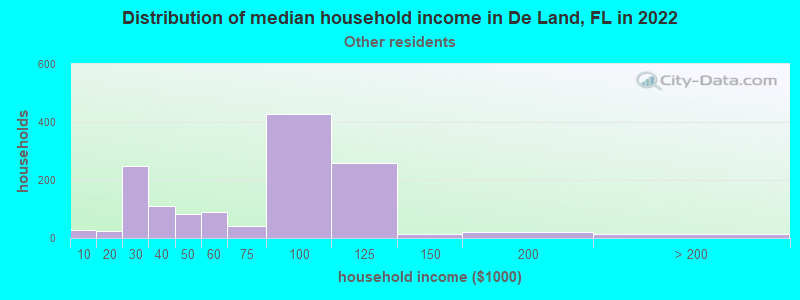
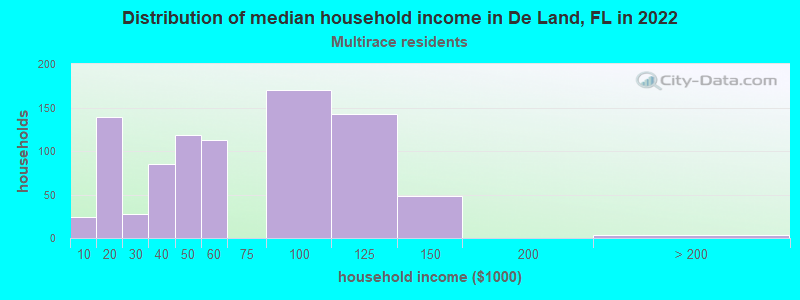
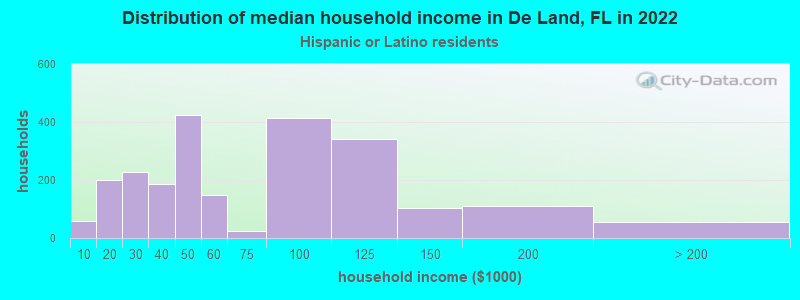
Income and house value in De Land Median household income in 2022 $77,524 White non-Hispanic householders$50,059 Black householders$84,853 Some other race householders$61,627 Two or more races householders$51,579 Hispanic or Latino race householdersMedian 2022 house value $378,562 White Non-Hispanic householders$297,010 Black or African American householders$566,333 American Indian or Alaska Native householders $377,555 Asian householders$375,038 Some other race householders$276,874 Two or more races householders$323,187 Hispanic or Latino householders
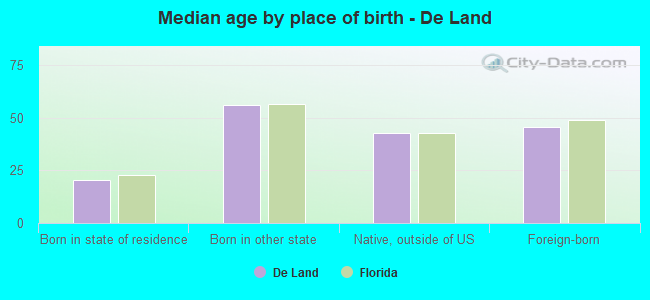
Median age by race in De Land
44.1 Median age for White residents42.6 45.9 32.8 Median age for Black or African American residents28.8 36.0 30.2 Median age for American Indian / Alaska Native residents16.1 -459,143,968.4 34.6 Median age for Asian residents30.4 39.8 -668,922,729.2 Median age for Native Hawaiian / Pacific Islander residents-668,922,729.2 -443,298,968.6 32.4 Median age for Other race residents35.5 28.1 20.0 Median age for Two or more races residents18.1 22.7 46.9 Median age for White alone residents45.3 48.5 29.1 Median age for Hispanic or Latino residents27.7 28.8
Owner/renter occupied households by race in De Land
House owners and renters - White residents 7,374 67.3% Owner occupied3,576 32.7% Renter occupiedHouse owners and renters - Black or African American residents 501 32.0% Owner occupied1,065 68.0% Renter occupiedHouse owners and renters - Asian residents 101 77.0% Owner occupied30 23.0% Renter occupiedHouse owners and renters - Other race residents 721 60.3% Owner occupied475 39.7% Renter occupiedHouse owners and renters - Two or more races residents 460 58.0% Owner occupied332 42.0% Renter occupiedHouse owners and renters - White alone residents 7,116 68.3% Owner occupied3,297 31.7% Renter occupiedHouse owners and renters - Hispanic or Latino residents 1,256 56.6% Owner occupied963 43.4% Renter occupied
Language usage in De Land
English speakers - Total 85.4% of residents of De Land speak English at home.
11.9% of residents speak Spanish at home 3,210 72.6% Speak English very well1,214 27.4% Speak English less than very well2.8% of residents speak other language at home 854 82.4% Speak English very well182 17.6% Speak English less than very well
English speakers - Born in the United States 92.8% of residents of De Land speak English at home.
6.7% of residents speak Spanish at home 1,089 90.4% Speak English very well116 9.6% Speak English less than very well0.6% of residents speak other language at home 102 100.0% Speak English very well
English speakers - Native, born elsewhere 20.9% of residents of De Land speak English at home.
79.8% of residents speak Spanish at home 1,099 68.8% Speak English very well499 31.2% Speak English less than very well1.2% of residents speak other language at home 25 100.0% Speak English less than very well
English speakers - Foreign-born 36.9% of residents of De Land speak English at home.
33.4% of residents speak Spanish at home 581 59.5% Speak English very well395 40.5% Speak English less than very well29.7% of residents speak other language at home 693 79.8% Speak English very well175 20.2% Speak English less than very well
White (Caucasian) - Speak only English Native:
95.8% (22,595)Foreign-born:
71.1% (723)
White (Caucasian) - Speak another language Native:
3.7% (862)Foreign-born:
38.0% (387)
Black or African American - Speak only English Native:
98.3% (4,906)Foreign-born:
48.9% (86)
Black or African American - Speak another language Native:
0.8% (39)Foreign-born:
46.7% (83)
American Indian / Alaska Native - Speak another language Native:
44.1% (12)Foreign-born:
100.0% (15)
Asian - Speak only English Native:
94.9% (41)Foreign-born:
19.1% (103)
Other race - Speak only English Native:
37.9% (954)Foreign-born:
20.3% (162)
Other race - Speak another language Native:
61.3% (1,545)Foreign-born:
81.1% (648)
Two or more races - Speak only English Native:
65.3% (2,130)Foreign-born:
12.2% (56)
Two or more races - Speak another language Native:
36.1% (1,177)Foreign-born:
89.7% (414)
White alone - Speak only English Native:
98.8% (21,500)Foreign-born:
75.9% (732)
White alone - Speak another language Native:
1.3% (276)Foreign-born:
30.1% (290)
Hispanic or Latino - Speak only English Native:
49.0% (3,089)Foreign-born:
12.1% (138)
Hispanic or Latino - Speak another language Native:
51.6% (3,252)Foreign-born:
88.1% (1,005)
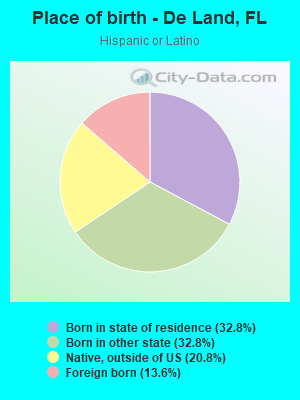
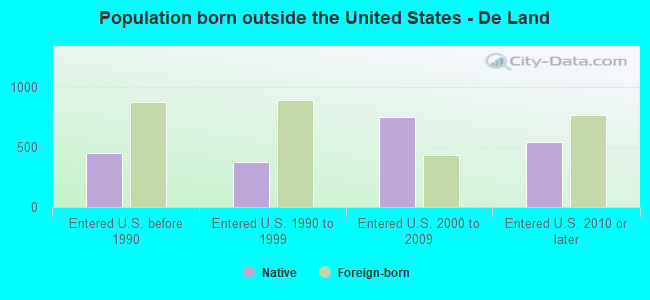
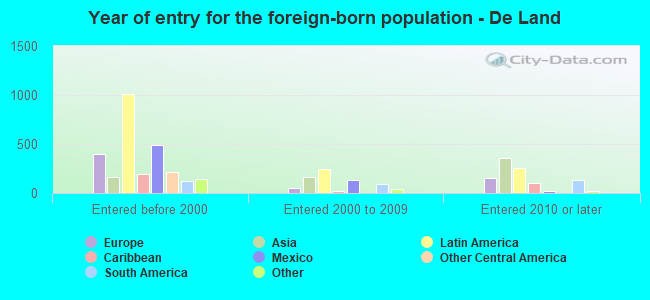
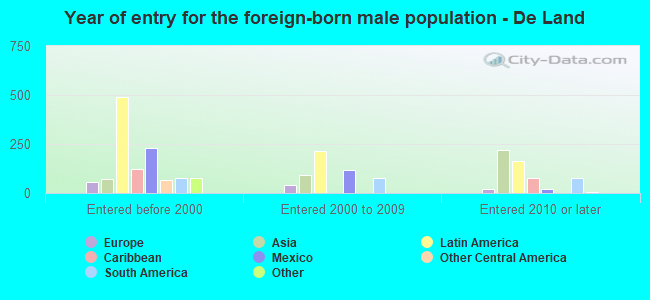
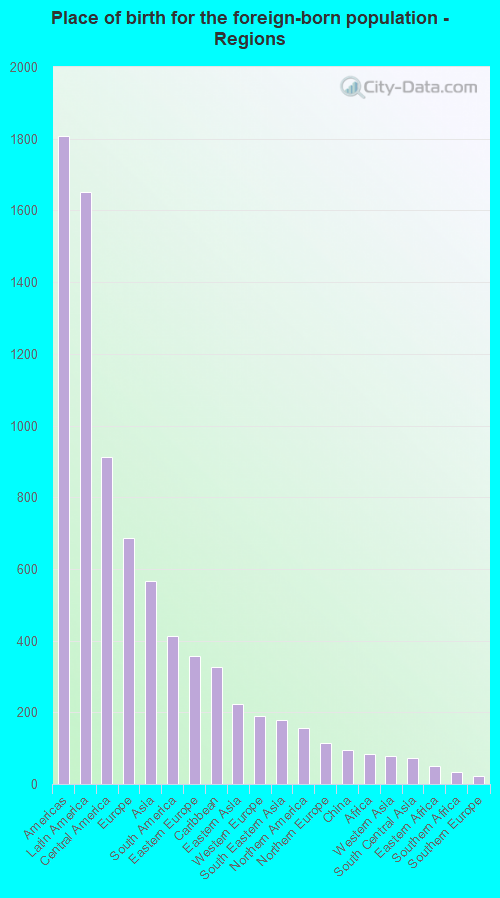
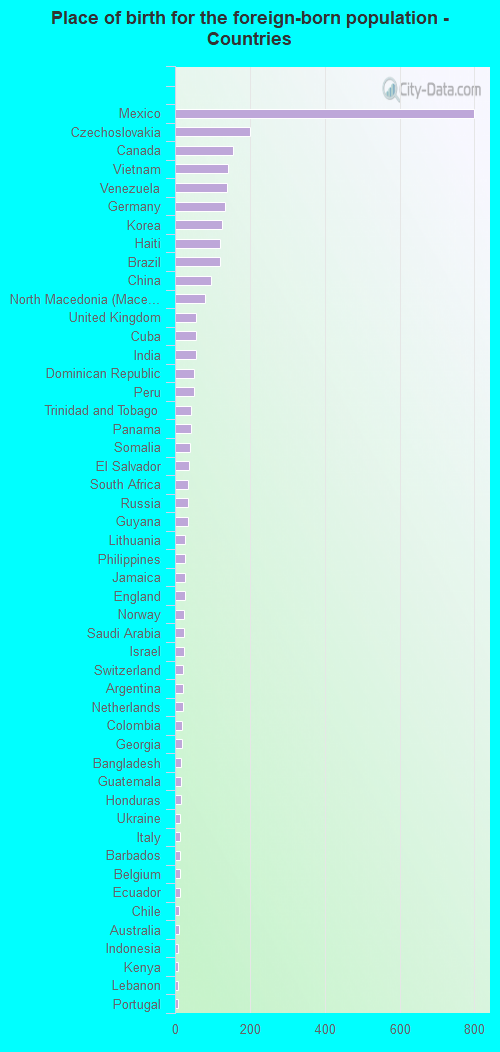
Foreign-born residents in De Land 3,158 residents are foreign born (4.1% Latin America , 1.7% Europe , 1.4% Asia ).
This city:
7.9%Florida:
21.1%
Marital status for residents in De Land Marital status - White (Caucasian) population 15 years and over
Males 33.8% Never married53.2% Now married1.1% Separated3.5% Widowed8.4% DivorcedFemales 25.1% Never married45.5% Now married1.8% Separated13.8% Widowed13.8% DivorcedWomen who gave birth in the past 12 months Now married:
94.7% (155)Unmarried:
5.3% (9)
Women who did not give birth in the past 12 months Now married:
43.1% (2,443)Unmarried:
56.9% (3,220)
Marital status - Black or African American population 15 years and over
Males 68.8% Never married17.9% Now married1.8% Separated0.7% Widowed10.8% DivorcedFemales 44.9% Never married16.3% Now married3.0% Separated19.8% Widowed16.1% DivorcedWomen who did not give birth in the past 12 months Now married:
20.8% (386)Unmarried:
79.2% (1,469)
Marital status - American Indian / Alaska Native population 15 years and over
Males 0.0% Never married100.0% Now married0.0% Separated0.0% Widowed0.0% DivorcedFemales 0.0% Never married100.0% Now married0.0% Separated0.0% Widowed0.0% DivorcedMarital status - Asian population 15 years and over
Males 54.3% Never married41.2% Now married0.0% Separated4.5% Widowed0.0% DivorcedFemales 20.3% Never married79.3% Now married0.0% Separated0.4% Widowed0.0% DivorcedWomen who did not give birth in the past 12 months Now married:
71.6% (141)Unmarried:
28.4% (56)
Marital status - Other race population 15 years and over
Males 24.4% Never married72.5% Now married0.0% Separated0.0% Widowed3.0% DivorcedFemales 35.2% Never married45.0% Now married0.0% Separated6.7% Widowed13.2% DivorcedWomen who gave birth in the past 12 months Now married:
73.3% (66)Unmarried:
26.7% (24)
Women who did not give birth in the past 12 months Now married:
45.8% (629)Unmarried:
54.2% (745)
Marital status - Two or more races population 15 years and over
Males 44.7% Never married45.3% Now married0.2% Separated0.0% Widowed9.8% DivorcedFemales 47.6% Never married31.9% Now married2.4% Separated5.1% Widowed13.1% DivorcedWomen who gave birth in the past 12 months Now married:
0.0% (0)Unmarried:
100.0% (166)
Women who did not give birth in the past 12 months Now married:
35.1% (278)Unmarried:
64.9% (513)
Marital status - White alone, not Hispanic / Latino population 15 years and over
Males 32.2% Never married54.3% Now married1.1% Separated3.8% Widowed8.7% DivorcedFemales 23.9% Never married46.5% Now married1.3% Separated14.5% Widowed13.9% DivorcedWomen who gave birth in the past 12 months Now married:
91.0% (93)Unmarried:
9.0% (9)
Women who did not give birth in the past 12 months Now married:
43.9% (2,241)Unmarried:
56.1% (2,869)
Marital status - Hispanic or Latino population 15 years and over
Males 38.1% Never married56.9% Now married0.8% Separated0.0% Widowed4.3% DivorcedFemales 32.4% Never married43.4% Now married3.6% Separated6.4% Widowed14.2% DivorcedWomen who gave birth in the past 12 months Now married:
87.6% (127)Unmarried:
12.4% (18)
Women who did not give birth in the past 12 months Now married:
45.4% (1,033)Unmarried:
54.6% (1,243)
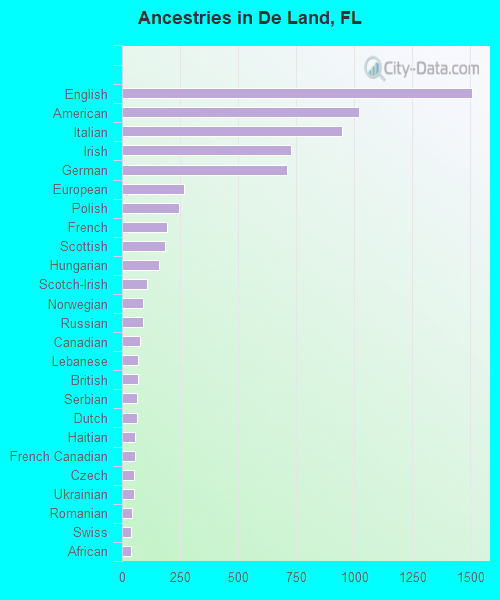
Ancestries in De Land
1,506 6.6% English1,020 4.5% American950 4.2% Italian727 3.2% Irish709 3.1% German269 1.2% European244 1.1% Polish192 0.8% French187 0.8% Scottish158 0.7% Hungarian107 0.5% Scotch-Irish92 0.4% Norwegian90 0.4% Russian78 0.3% Canadian70 0.3% Lebanese67 0.3% British64 0.3% Serbian63 0.3% Dutch56 0.2% Haitian54 0.2% French Canadian50 0.2% Czech50 0.2% Ukrainian45 0.2% Romanian40 0.2% Swiss39 0.2% African33 0.1% Scandinavian33 0.1% Swedish32 0.1% Portuguese30 0.1% Greek29 0.1% Brazilian29 0.1% Eastern European29 0.1% Slovak25 0.1% Trinidadian and Tobagonian24 0.1% Welsh23 0.1% Danish16 0.07% Barbadian15 0.07% Guyanese11 0.05% Palestinian10 0.04% Finnish9 0.04% Lithuanian9 0.04% West Indian8 0.04% Croatian7 0.03% Somali7 0.03% Austrian3 0.01% Albanian
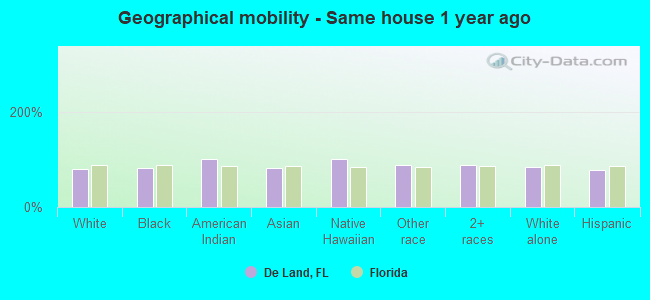
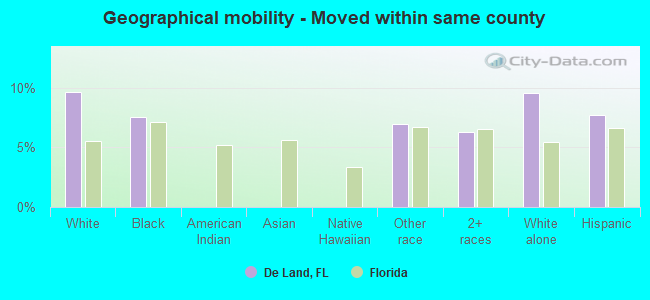
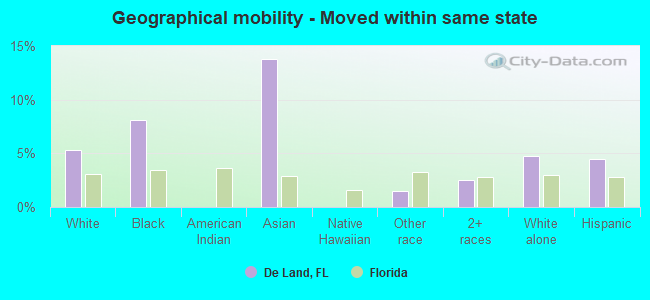
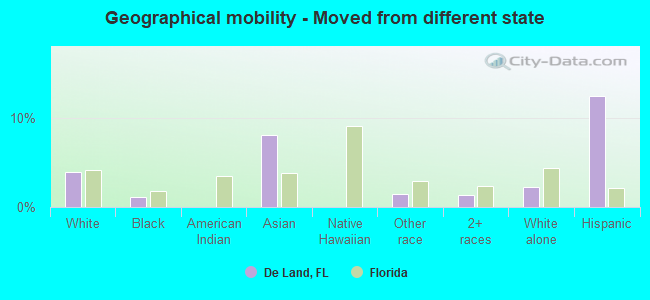
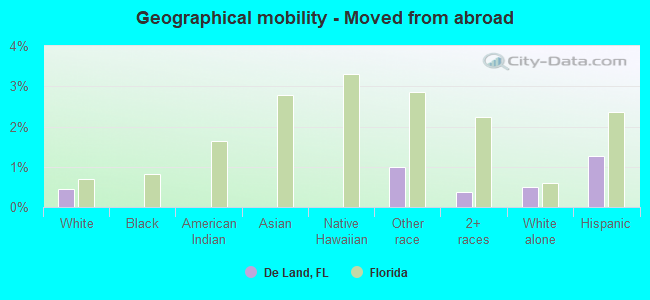
Geographical mobility in De Land Same house 1 year ago 20,659 80.4% White (Caucasian)4,270 80.8% Black or African American54 100.0% American Indian / Alaska Native501 81.8% Asian2 100.0% Native Hawaiian / Pacific Islander3,036 88.8% Other race4,018 87.3% Two or more races19,657 82.8% White alone, not Hispanic / Latino6,394 78.1% Hispanic or LatinoMoved within same county 2,473 9.6% White / Caucasian400 7.6% Black or African American237 6.9% Other race288 6.3% Two or more races2,274 9.6% White alone, not Hispanic / Latino634 7.7% Hispanic or LatinoMoved within same state 1,357 5.3% White / Caucasian429 8.1% Black or African American84 13.8% Asian51 1.5% Other race115 2.5% Two or more races1,129 4.8% White alone, not Hispanic / Latino369 4.5% Hispanic or LatinoMoved from different state 1,017 4.0% White / Caucasian59 1.1% Black or African American49 8.0% Asian51 1.5% Other race64 1.4% Two or more races521 2.2% White alone, not Hispanic / Latino1,018 12.4% Hispanic or LatinoMoved from abroad 116 0.5% White34 1.0% Other race18 0.4% Two or more races117 0.5% White alone, not Hispanic / Latino104 1.3% Hispanic or Latino
Children Nativity (place of birth) in De Land
Children under 6 years - Living with two parents Both parents native 1,654 100.0% NativeBoth parents foreign-born 37 100.0% NativeOne native, one foreign-born parent 696 100.0% NativeChildren under 6 years - Living with one parent Native parent 664 100.0% NativeChildren 6 to 17 years - Living with two parents Both parents native 2,005 100.0% NativeBoth parents foreign-born 53 52.0% Native49 48.0% Foreign-bornOne native, one foreign-born parent 760 97.8% Native17 2.2% Foreign-bornChildren 6 to 17 years - Living with one parent Native parent 2,444 100.0% NativeForeign-born parent 43 50.6% Native42 49.4% Foreign-born
Grandparents responsible for own grandchildren in De Land
Grandparents (30 to 59 years) White / Caucasian 8 4.0% Responsible for grandchildren184 96.0% Not responsible for grandchildrenBlack or African American 9 33.7% Responsible for grandchildren17 66.3% Not responsible for grandchildrenOther race 31 100.0% Not responsible for grandchildrenTwo or more races 38 100.0% Not responsible for grandchildrenWhite alone, not Hispanic / Latino 8 5.7% Responsible for grandchildren132 94.3% Not responsible for grandchildrenHispanic or Latino 131 100.0% Not responsible for grandchildrenGrandparents (60 years and over) White / Caucasian 7 6.6% Responsible for grandchildren94 93.4% Not responsible for grandchildrenBlack or African American 82 100.0% Not responsible for grandchildrenTwo or more races 34 53.7% Responsible for grandchildren29 46.3% Not responsible for grandchildrenWhite alone, not Hispanic / Latino 7 6.7% Responsible for grandchildren91 93.3% Not responsible for grandchildrenHispanic or Latino 21 100.0% Not responsible for grandchildren