Races in Dayton, Nevada (NV) Detailed Stats
Data:
Races - White alone (%)
Races - White alone (% change since 2000)
Races - Black alone (%)
Races - Black alone (% change since 2000)
Races - American Indian alone (%)
Races - American Indian alone (% change since 2000)
Races - Asian alone (%)
Races - Asian alone (% change since 2000)
Races - Hispanic (%)
Races - Hispanic (% change since 2000)
Races - Native Hawaiian and Other Pacific Islander alone (%)
Races - Native Hawaiian and Other Pacific Islander alone (% change since 2000)
Races - Two or more races(%)
Races - Two or more races(% change since 2000)
Races - Other race alone (%)
Races - Other race alone (% change since 2000)
Racial diversity
Place of birth - Born in state of residence (%)
Place of birth - Born in state of residence (%) - White
Place of birth - Born in state of residence (%) - Black or African American
Place of birth - Born in state of residence (%) - Asian
Place of birth - Born in state of residence (%) - Hispanic or Latino
Place of birth - Born in state of residence (%) - American Indian and Alaska Native
Place of birth - Born in state of residence (%) - Multirace
Place of birth - Born in state of residence (%) - Other Race
Place of birth - Born in other state (%)
Place of birth - Born in other state (%) - White
Place of birth - Born in other state (%) - Black or African American
Place of birth - Born in other state (%) - Asian
Place of birth - Born in other state (%) - Hispanic or Latino
Place of birth - Born in other state (%) - American Indian and Alaska Native
Place of birth - Born in other state (%) - Multirace
Place of birth - Born in other state (%) - Other Race
Place of birth - Native, outside of US (%)
Place of birth - Native, outside of US (%) - White
Place of birth - Native, outside of US (%) - Black or African American
Place of birth - Native, outside of US (%) - Asian
Place of birth - Native, outside of US (%) - Hispanic or Latino
Place of birth - Native, outside of US (%) - American Indian and Alaska Native
Place of birth - Native, outside of US (%) - Multirace
Place of birth - Native, outside of US (%) - Other Race
Place of birth - Foreign born (%)
Place of birth - Foreign born (%) - White
Place of birth - Foreign born (%) - Black or African American
Place of birth - Foreign born (%) - Asian
Place of birth - Foreign born (%) - Hispanic or Latino
Place of birth - Foreign born (%) - American Indian and Alaska Native
Place of birth - Foreign born (%) - Multirace
Place of birth - Foreign born (%) - Other Race
Residents speaking English at home (%)
Residents speaking English at home - Born in the United States (%)
Residents speaking English at home - Native, born elsewhere (%)
Residents speaking English at home - Foreign born (%)
Residents speaking Spanish at home (%)
Residents speaking Spanish at home - Born in the United States (%)
Residents speaking Spanish at home - Native, born elsewhere (%)
Residents speaking Spanish at home - Foreign born (%)
Residents speaking other language at home (%)
Residents speaking other language at home - Born in the United States (%)
Residents speaking other language at home - Native, born elsewhere (%)
Residents speaking other language at home - Foreign born (%)
Marital status - Never married (%)
Marital status - Now married (%)
Marital status - Separated (%)
Marital status - Widowed (%)
Marital status - Divorced (%)
Ancestries Reported - Arab (%)
Ancestries Reported - Czech (%)
Ancestries Reported - Danish (%)
Ancestries Reported - Dutch (%)
Ancestries Reported - English (%)
Ancestries Reported - French (%)
Ancestries Reported - French Canadian (%)
Ancestries Reported - German (%)
Ancestries Reported - Greek (%)
Ancestries Reported - Hungarian (%)
Ancestries Reported - Irish (%)
Ancestries Reported - Italian (%)
Ancestries Reported - Lithuanian (%)
Ancestries Reported - Norwegian (%)
Ancestries Reported - Polish (%)
Ancestries Reported - Portuguese (%)
Ancestries Reported - Russian (%)
Ancestries Reported - Scotch-Irish (%)
Ancestries Reported - Scottish (%)
Ancestries Reported - Slovak (%)
Ancestries Reported - Subsaharan African (%)
Ancestries Reported - Swedish (%)
Ancestries Reported - Swiss (%)
Ancestries Reported - Ukrainian (%)
Ancestries Reported - United States (%)
Ancestries Reported - Welsh (%)
Ancestries Reported - West Indian (%)
Ancestries Reported - Other (%)
Geographical mobility - Same house 1 year ago (%)
Geographical mobility - Same house 1 year ago (%) - White
Geographical mobility - Same house 1 year ago (%) - Black or African American
Geographical mobility - Same house 1 year ago (%) - Asian
Geographical mobility - Same house 1 year ago (%) - Hispanic or Latino
Geographical mobility - Same house 1 year ago (%) - American Indian and Alaska Native
Geographical mobility - Same house 1 year ago (%) - Multirace
Geographical mobility - Same house 1 year ago (%) - Other Race
Geographical mobility - Moved within same county (%)
Geographical mobility - Moved within same county (%) - White
Geographical mobility - Moved within same county (%) - Black or African American
Geographical mobility - Moved within same county (%) - Asian
Geographical mobility - Moved within same county (%) - Hispanic or Latino
Geographical mobility - Moved within same county (%) - American Indian and Alaska Native
Geographical mobility - Moved within same county (%) - Multirace
Geographical mobility - Moved within same county (%) - Other Race
Geographical mobility - Moved from different county within same state (%)
Geographical mobility - Moved from different county within same state (%) - White
Geographical mobility - Moved from different county within same state (%) - Black or African American
Geographical mobility - Moved from different county within same state (%) - Asian
Geographical mobility - Moved from different county within same state (%) - Hispanic or Latino
Geographical mobility - Moved from different county within same state (%) - American Indian and Alaska Native
Geographical mobility - Moved from different county within same state (%) - Multirace
Geographical mobility - Moved from different county within same state (%) - Other Race
Geographical mobility - Moved from different state (%)
Geographical mobility - Moved from different state (%) - White
Geographical mobility - Moved from different state (%) - Black or African American
Geographical mobility - Moved from different state (%) - Asian
Geographical mobility - Moved from different state (%) - Hispanic or Latino
Geographical mobility - Moved from different state (%) - American Indian and Alaska Native
Geographical mobility - Moved from different state (%) - Multirace
Geographical mobility - Moved from different state (%) - Other Race
Geographical mobility - Moved from abroad (%)
Geographical mobility - Moved from abroad (%) - White
Geographical mobility - Moved from abroad (%) - Black or African American
Geographical mobility - Moved from abroad (%) - Asian
Geographical mobility - Moved from abroad (%) - Hispanic or Latino
Geographical mobility - Moved from abroad (%) - American Indian and Alaska Native
Geographical mobility - Moved from abroad (%) - Multirace
Geographical mobility - Moved from abroad (%) - Other Race
Place of birth for the foreign-born population - Ireland (%)
Place of birth for the foreign-born population - Denmark (%)
Place of birth for the foreign-born population - Norway (%)
Place of birth for the foreign-born population - Sweden (%)
Place of birth for the foreign-born population - United Kingdom (%)
Place of birth for the foreign-born population - England (%)
Place of birth for the foreign-born population - Scotland (%)
Place of birth for the foreign-born population - Other Northern Europe (%)
Place of birth for the foreign-born population - Austria (%)
Place of birth for the foreign-born population - Belgium (%)
Place of birth for the foreign-born population - France (%)
Place of birth for the foreign-born population - Germany (%)
Place of birth for the foreign-born population - Netherlands (%)
Place of birth for the foreign-born population - Switzerland (%)
Place of birth for the foreign-born population - Other Western Europe (%)
Place of birth for the foreign-born population - Greece (%)
Place of birth for the foreign-born population - Italy (%)
Place of birth for the foreign-born population - Portugal (%)
Place of birth for the foreign-born population - Spain (%)
Place of birth for the foreign-born population - Other Southern Europe (%)
Place of birth for the foreign-born population - Albania (%)
Place of birth for the foreign-born population - Belarus (%)
Place of birth for the foreign-born population - Bosnia and Herzegovina (%)
Place of birth for the foreign-born population - Bulgaria (%)
Place of birth for the foreign-born population - Croatia (%)
Place of birth for the foreign-born population - Czechoslovakia (%)
Place of birth for the foreign-born population - Hungary (%)
Place of birth for the foreign-born population - Latvia (%)
Place of birth for the foreign-born population - Lithuania (%)
Place of birth for the foreign-born population - North Macedonia (Macedonia) (%)
Place of birth for the foreign-born population - Moldova (%)
Place of birth for the foreign-born population - Poland (%)
Place of birth for the foreign-born population - Romania (%)
Place of birth for the foreign-born population - Russia (%)
Place of birth for the foreign-born population - Serbia (%)
Place of birth for the foreign-born population - Ukraine (%)
Place of birth for the foreign-born population - Other Eastern Europe (%)
Place of birth for the foreign-born population - China (%)
Place of birth for the foreign-born population - Hong Kong (%)
Place of birth for the foreign-born population - Taiwan (%)
Place of birth for the foreign-born population - Japan (%)
Place of birth for the foreign-born population - Korea (%)
Place of birth for the foreign-born population - Other Eastern Asia (%)
Place of birth for the foreign-born population - Afghanistan (%)
Place of birth for the foreign-born population - Bangladesh (%)
Place of birth for the foreign-born population - India (%)
Place of birth for the foreign-born population - Iran (%)
Place of birth for the foreign-born population - Kazakhstan (%)
Place of birth for the foreign-born population - Nepal (%)
Place of birth for the foreign-born population - Pakistan (%)
Place of birth for the foreign-born population - Sri Lanka (%)
Place of birth for the foreign-born population - Uzbekistan (%)
Place of birth for the foreign-born population - Other South Central Asia (%)
Place of birth for the foreign-born population - Burma (%)
Place of birth for the foreign-born population - Cambodia (%)
Place of birth for the foreign-born population - Indonesia (%)
Place of birth for the foreign-born population - Laos (%)
Place of birth for the foreign-born population - Malaysia (%)
Place of birth for the foreign-born population - Philippines (%)
Place of birth for the foreign-born population - Singapore (%)
Place of birth for the foreign-born population - Thailand (%)
Place of birth for the foreign-born population - Vietnam (%)
Place of birth for the foreign-born population - Other South Eastern Asia (%)
Place of birth for the foreign-born population - Armenia (%)
Place of birth for the foreign-born population - Iraq (%)
Place of birth for the foreign-born population - Israel (%)
Place of birth for the foreign-born population - Jordan (%)
Place of birth for the foreign-born population - Kuwait (%)
Place of birth for the foreign-born population - Lebanon (%)
Place of birth for the foreign-born population - Saudi Arabia (%)
Place of birth for the foreign-born population - Syria (%)
Place of birth for the foreign-born population - Turkey (%)
Place of birth for the foreign-born population - Yemen (%)
Place of birth for the foreign-born population - Other Western Asia (%)
Place of birth for the foreign-born population - Eritrea (%)
Place of birth for the foreign-born population - Ethiopia (%)
Place of birth for the foreign-born population - Kenya (%)
Place of birth for the foreign-born population - Somalia (%)
Place of birth for the foreign-born population - Uganda (%)
Place of birth for the foreign-born population - Zimbabwe (%)
Place of birth for the foreign-born population - Other Eastern Africa (%)
Place of birth for the foreign-born population - Cameroon (%)
Place of birth for the foreign-born population - Congo (%)
Place of birth for the foreign-born population - Democratic Republic of Congo (Zaire) (%)
Place of birth for the foreign-born population - Other Middle Africa (%)
Place of birth for the foreign-born population - Egypt (%)
Place of birth for the foreign-born population - Morocco (%)
Place of birth for the foreign-born population - Sudan (%)
Place of birth for the foreign-born population - Other Northern Africa (%)
Place of birth for the foreign-born population - South Africa (%)
Place of birth for the foreign-born population - Other Southern Africa (%)
Place of birth for the foreign-born population - Cabo Verde (%)
Place of birth for the foreign-born population - Ghana (%)
Place of birth for the foreign-born population - Liberia (%)
Place of birth for the foreign-born population - Nigeria (%)
Place of birth for the foreign-born population - Senegal (%)
Place of birth for the foreign-born population - Sierra Leone (%)
Place of birth for the foreign-born population - Other Western Africa (%)
Place of birth for the foreign-born population - Australia (%)
Place of birth for the foreign-born population - New Zealand (%)
Place of birth for the foreign-born population - Fiji (%)
Place of birth for the foreign-born population - Micronesia (%)
Place of birth for the foreign-born population - Bahamas (%)
Place of birth for the foreign-born population - Barbados (%)
Place of birth for the foreign-born population - Cuba (%)
Place of birth for the foreign-born population - Dominica (%)
Place of birth for the foreign-born population - Dominican Republic (%)
Place of birth for the foreign-born population - Grenada (%)
Place of birth for the foreign-born population - Haiti (%)
Place of birth for the foreign-born population - Jamaica (%)
Place of birth for the foreign-born population - St. Vincent and the Grenadines (%)
Place of birth for the foreign-born population - Trinidad and Tobago (%)
Place of birth for the foreign-born population - West Indies (%)
Place of birth for the foreign-born population - Other Caribbean (%)
Place of birth for the foreign-born population - Belize (%)
Place of birth for the foreign-born population - Costa Rica (%)
Place of birth for the foreign-born population - El Salvador (%)
Place of birth for the foreign-born population - Guatemala (%)
Place of birth for the foreign-born population - Honduras (%)
Place of birth for the foreign-born population - Mexico (%)
Place of birth for the foreign-born population - Nicaragua (%)
Place of birth for the foreign-born population - Panama (%)
Place of birth for the foreign-born population - Other Central America (%)
Place of birth for the foreign-born population - Argentina (%)
Place of birth for the foreign-born population - Bolivia (%)
Place of birth for the foreign-born population - Brazil (%)
Place of birth for the foreign-born population - Chile (%)
Place of birth for the foreign-born population - Colombia (%)
Place of birth for the foreign-born population - Ecuador (%)
Place of birth for the foreign-born population - Guyana (%)
Place of birth for the foreign-born population - Peru (%)
Place of birth for the foreign-born population - Uruguay (%)
Place of birth for the foreign-born population - Venezuela (%)
Place of birth for the foreign-born population - Other South America (%)
Place of birth for the foreign-born population - Canada (%)
Place of birth for the foreign-born population - Other Northern America (%)
Place of birth for the foreign-born population - Other (%)
Latest news about races in Dayton, NV collected exclusively by city-data.com from local newspapers, TV, and radio stations
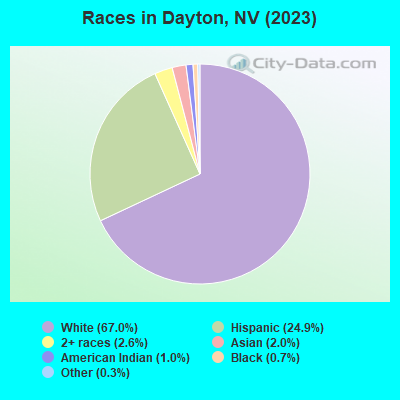
According to 2022 data, the most numerous races in Dayton, NV are White alone (10,380 residents), Hispanic (3,973 residents), and Black alone (17 residents). 82.8% of Dayton residents speak English at home. 8.9% of Dayton, NV residents are foreign-born (6.6% born in Latin America, 1.5% born in Asia), which is 101.1% less than the foreign-born rate of 18.0% across the entire state of Nevada.
Race distribution in Dayton
2000 2022
1,303,001 65.2% White alone 393,970 19.7% Hispanic 131,509 6.6% Black alone 88,593 4.4% Asian alone 49,231 2.5% Two or more races 21,397 1.1% American Indian alone 7,769 0.4% Native Hawaiian and Other 2,787 0.1% Other race alone
1,410,145 44.4% White alone 961,357 30.3% Hispanic 286,471 9.0% Black alone 281,149 8.8% Asian alone 182,151 5.7% Two or more races 20,102 0.6% Native Hawaiian and Other 18,781 0.6% Other race alone 17,616 0.6% American Indian alone
Income and house value in Dayton Median household income in 2022 $82,427 White non-Hispanic householders$53,609 Asian householders$123,658 Some other race householders$107,021 Two or more races householders$108,805 Hispanic or Latino race householdersMedian 2022 house value $438,067 White Non-Hispanic householders$479,572 Black or African American householders $307,623 Asian householders$392,377 Some other race householders$392,377 Two or more races householders$398,306 Hispanic or Latino householders
Median age by race in Dayton
50.0 Median age for White residents48.2 52.5 -676,557,862.8 Median age for Black or African American residents-676,798,378.2 -676,356,588.5 49.2 Median age for American Indian / Alaska Native residents52.4 37.0 44.7 Median age for Asian residents44.4 44.5 -690,618,761.8 Median age for Native Hawaiian / Pacific Islander residents-648,090,814.6 -725,146,198.1 35.0 Median age for Other race residents34.9 33.6 24.4 Median age for Two or more races residents19.7 27.0 50.6 Median age for White alone residents47.9 51.5 30.3 Median age for Hispanic or Latino residents30.0 32.5
Owner/renter occupied households by race in Dayton
House owners and renters - White residents 3,478 78.9% Owner occupied930 21.1% Renter occupiedHouse owners and renters - Black or African American residents 18 100.0% Owner occupiedHouse owners and renters - American Indian / Alaska Native residents 51 79.0% Owner occupied14 21.0% Renter occupiedHouse owners and renters - Asian residents 33 34.3% Owner occupied64 65.7% Renter occupiedHouse owners and renters - Other race residents 519 95.3% Owner occupied25 4.7% Renter occupiedHouse owners and renters - Two or more races residents 580 94.1% Owner occupied36 5.9% Renter occupiedHouse owners and renters - White alone residents 3,425 78.2% Owner occupied953 21.8% Renter occupiedHouse owners and renters - Hispanic or Latino residents 991 93.1% Owner occupied74 6.9% Renter occupied
Language usage in Dayton
English speakers - Total 82.8% of residents of Dayton speak English at home.
14.2% of residents speak Spanish at home 1,593 76.9% Speak English very well479 23.1% Speak English less than very well3.1% of residents speak other language at home 396 88.8% Speak English very well50 11.2% Speak English less than very well
English speakers - Born in the United States 94.3% of residents of Dayton speak English at home.
4.7% of residents speak Spanish at home 379 88.3% Speak English very well50 11.7% Speak English less than very well1.0% of residents speak other language at home 85 95.5% Speak English very well4 4.5% Speak English less than very well
English speakers - Native, born elsewhere 57.4% of residents of Dayton speak English at home.
22.6% of residents speak Spanish at home 15 25.0% Speak English very well45 75.0% Speak English less than very well19.6% of residents speak other language at home 52 100.0% Speak English very well
English speakers - Foreign-born 6.6% of residents of Dayton speak English at home.
75.4% of residents speak Spanish at home 691 64.9% Speak English very well374 35.1% Speak English less than very well19.5% of residents speak other language at home 230 83.6% Speak English very well45 16.4% Speak English less than very well
White (Caucasian) - Speak only English Native:
99.9% (9,752)Foreign-born:
22.5% (45)
White (Caucasian) - Speak another language Native:
2.0% (200)Foreign-born:
72.8% (145)
Asian - Speak only English Native:
59.9% (87)Foreign-born:
22.4% (45)
Asian - Speak another language Native:
38.7% (56)Foreign-born:
77.9% (158)
Other race - Speak another language Native:
56.0% (376)Foreign-born:
100.0% (823)
Two or more races - Speak another language Native:
33.3% (658)Foreign-born:
100.0% (187)
White alone - Speak only English Native:
99.1% (9,535)Foreign-born:
34.5% (49)
White alone - Speak another language Native:
0.9% (89)Foreign-born:
65.8% (94)
Hispanic or Latino - Speak another language Native:
40.6% (999)Foreign-born:
100.0% (1,074)
Foreign-born residents in Dayton 1,412 residents are foreign born (6.6% Latin America , 1.5% Asia ).
This city:
8.9%Nevada:
19.1%
Marital status for residents in Dayton Marital status - White (Caucasian) population 15 years and over
Males 26.7% Never married54.0% Now married1.8% Separated4.7% Widowed12.8% DivorcedFemales 14.0% Never married57.1% Now married1.7% Separated12.6% Widowed14.6% DivorcedWomen who gave birth in the past 12 months Now married:
50.6% (35)Unmarried:
49.4% (34)
Women who did not give birth in the past 12 months Now married:
64.3% (1,118)Unmarried:
35.7% (620)
Marital status - American Indian / Alaska Native population 15 years and over
Males 18.0% Never married62.0% Now married12.0% Separated0.0% Widowed8.0% DivorcedFemales 50.5% Never married34.7% Now married0.0% Separated0.0% Widowed14.9% DivorcedWomen who did not give birth in the past 12 months Now married:
40.7% (42)Unmarried:
59.3% (61)
Marital status - Asian population 15 years and over
Males 10.8% Never married89.2% Now married0.0% Separated0.0% Widowed0.0% DivorcedFemales 8.5% Never married67.0% Now married0.0% Separated0.0% Widowed24.4% DivorcedWomen who did not give birth in the past 12 months Now married:
58.6% (57)Unmarried:
41.4% (41)
Marital status - Other race population 15 years and over
Males 47.2% Never married52.8% Now married0.0% Separated0.0% Widowed0.0% DivorcedFemales 21.1% Never married57.7% Now married0.0% Separated6.2% Widowed15.1% DivorcedWomen who gave birth in the past 12 months Now married:
63.7% (70)Unmarried:
36.3% (40)
Women who did not give birth in the past 12 months Now married:
46.9% (121)Unmarried:
53.1% (137)
Marital status - Two or more races population 15 years and over
Males 22.2% Never married61.4% Now married0.0% Separated2.2% Widowed14.1% DivorcedFemales 30.8% Never married59.2% Now married0.0% Separated4.9% Widowed5.1% DivorcedWomen who gave birth in the past 12 months Now married:
100.0% (14)Unmarried:
0.0% (0)
Women who did not give birth in the past 12 months Now married:
53.3% (308)Unmarried:
46.7% (270)
Marital status - White alone, not Hispanic / Latino population 15 years and over
Males 27.1% Never married53.7% Now married1.9% Separated4.9% Widowed12.5% DivorcedFemales 13.8% Never married58.2% Now married1.3% Separated12.6% Widowed14.1% DivorcedWomen who gave birth in the past 12 months Now married:
43.5% (29)Unmarried:
56.5% (38)
Women who did not give birth in the past 12 months Now married:
64.9% (1,115)Unmarried:
35.1% (604)
Marital status - Hispanic or Latino population 15 years and over
Males 36.0% Never married55.2% Now married0.0% Separated0.5% Widowed8.3% DivorcedFemales 24.2% Never married55.3% Now married1.6% Separated6.7% Widowed12.1% DivorcedWomen who gave birth in the past 12 months Now married:
69.7% (89)Unmarried:
30.3% (39)
Women who did not give birth in the past 12 months Now married:
52.1% (431)Unmarried:
47.9% (396)
Ancestries in Dayton
854 12.1% English752 10.7% German658 9.3% Irish487 6.9% American342 4.9% Italian216 3.1% European150 2.1% Norwegian87 1.2% Russian83 1.2% Scottish72 1.0% Polish63 0.9% Scandinavian54 0.8% Danish48 0.7% Finnish43 0.6% Scotch-Irish33 0.5% Portuguese29 0.4% French20 0.3% Iranian17 0.2% Basque15 0.2% Swedish14 0.2% Czech14 0.2% Hungarian14 0.2% Lithuanian13 0.2% British13 0.2% Dutch12 0.2% Canadian10 0.1% Lebanese10 0.1% Greek10 0.1% Welsh9 0.1% Eastern European9 0.1% French Canadian7 0.10% Arab
Geographical mobility in Dayton Same house 1 year ago 9,169 89.0% White (Caucasian)18 100.0% Black or African American311 100.0% American Indian / Alaska Native256 64.7% Asian10 100.0% Native Hawaiian / Pacific Islander1,565 100.0% Other race2,264 89.9% Two or more races9,304 90.1% White alone, not Hispanic / Latino3,513 92.5% Hispanic or LatinoMoved within same county 322 3.1% White / Caucasian175 6.9% Two or more races165 1.6% White alone, not Hispanic / Latino282 7.4% Hispanic or LatinoMoved within same state 465 4.5% White / Caucasian23 5.8% Asian10 0.4% Two or more races481 4.7% White alone, not Hispanic / LatinoMoved from different state 460 4.5% White / Caucasian103 25.9% Asian74 2.9% Two or more races469 4.5% White alone, not Hispanic / Latino41 1.1% Hispanic or LatinoMoved from abroad 11 0.1% White10 2.5% Asian14 0.1% White alone, not Hispanic / Latino
Children Nativity (place of birth) in Dayton
Children under 6 years - Living with two parents Both parents native 723 100.0% NativeOne native, one foreign-born parent 146 100.0% NativeChildren under 6 years - Living with one parent Native parent 329 100.0% NativeForeign-born parent 16 100.0% NativeChildren 6 to 17 years - Living with two parents Both parents native 1,010 100.0% NativeBoth parents foreign-born 136 100.0% NativeOne native, one foreign-born parent 151 100.0% NativeChildren 6 to 17 years - Living with one parent Native parent 664 100.0% NativeForeign-born parent 15 50.0% Native15 50.0% Foreign-born
Grandparents responsible for own grandchildren in Dayton
Grandparents (30 to 59 years) White / Caucasian 74 40.5% Responsible for grandchildren109 59.5% Not responsible for grandchildrenOther race 149 100.0% Not responsible for grandchildrenTwo or more races 46 100.0% Not responsible for grandchildrenWhite alone, not Hispanic / Latino 101 45.5% Responsible for grandchildren121 54.5% Not responsible for grandchildrenHispanic or Latino 194 100.0% Not responsible for grandchildrenGrandparents (60 years and over) White / Caucasian 99 38.8% Responsible for grandchildren156 61.2% Not responsible for grandchildrenWhite alone, not Hispanic / Latino 113 40.9% Responsible for grandchildren163 59.1% Not responsible for grandchildrenHispanic or Latino 15 100.0% Not responsible for grandchildren