Races in Danville, Virginia (VA) Detailed Stats
Data:
Races - White alone (%)
Races - White alone (% change since 2000)
Races - Black alone (%)
Races - Black alone (% change since 2000)
Races - American Indian alone (%)
Races - American Indian alone (% change since 2000)
Races - Asian alone (%)
Races - Asian alone (% change since 2000)
Races - Hispanic (%)
Races - Hispanic (% change since 2000)
Races - Native Hawaiian and Other Pacific Islander alone (%)
Races - Native Hawaiian and Other Pacific Islander alone (% change since 2000)
Races - Two or more races(%)
Races - Two or more races(% change since 2000)
Races - Other race alone (%)
Races - Other race alone (% change since 2000)
Racial diversity
Place of birth - Born in state of residence (%)
Place of birth - Born in state of residence (%) - White
Place of birth - Born in state of residence (%) - Black or African American
Place of birth - Born in state of residence (%) - Asian
Place of birth - Born in state of residence (%) - Hispanic or Latino
Place of birth - Born in state of residence (%) - American Indian and Alaska Native
Place of birth - Born in state of residence (%) - Multirace
Place of birth - Born in state of residence (%) - Other Race
Place of birth - Born in other state (%)
Place of birth - Born in other state (%) - White
Place of birth - Born in other state (%) - Black or African American
Place of birth - Born in other state (%) - Asian
Place of birth - Born in other state (%) - Hispanic or Latino
Place of birth - Born in other state (%) - American Indian and Alaska Native
Place of birth - Born in other state (%) - Multirace
Place of birth - Born in other state (%) - Other Race
Place of birth - Native, outside of US (%)
Place of birth - Native, outside of US (%) - White
Place of birth - Native, outside of US (%) - Black or African American
Place of birth - Native, outside of US (%) - Asian
Place of birth - Native, outside of US (%) - Hispanic or Latino
Place of birth - Native, outside of US (%) - American Indian and Alaska Native
Place of birth - Native, outside of US (%) - Multirace
Place of birth - Native, outside of US (%) - Other Race
Place of birth - Foreign born (%)
Place of birth - Foreign born (%) - White
Place of birth - Foreign born (%) - Black or African American
Place of birth - Foreign born (%) - Asian
Place of birth - Foreign born (%) - Hispanic or Latino
Place of birth - Foreign born (%) - American Indian and Alaska Native
Place of birth - Foreign born (%) - Multirace
Place of birth - Foreign born (%) - Other Race
Residents speaking English at home (%)
Residents speaking English at home - Born in the United States (%)
Residents speaking English at home - Native, born elsewhere (%)
Residents speaking English at home - Foreign born (%)
Residents speaking Spanish at home (%)
Residents speaking Spanish at home - Born in the United States (%)
Residents speaking Spanish at home - Native, born elsewhere (%)
Residents speaking Spanish at home - Foreign born (%)
Residents speaking other language at home (%)
Residents speaking other language at home - Born in the United States (%)
Residents speaking other language at home - Native, born elsewhere (%)
Residents speaking other language at home - Foreign born (%)
Marital status - Never married (%)
Marital status - Now married (%)
Marital status - Separated (%)
Marital status - Widowed (%)
Marital status - Divorced (%)
Ancestries Reported - Arab (%)
Ancestries Reported - Czech (%)
Ancestries Reported - Danish (%)
Ancestries Reported - Dutch (%)
Ancestries Reported - English (%)
Ancestries Reported - French (%)
Ancestries Reported - French Canadian (%)
Ancestries Reported - German (%)
Ancestries Reported - Greek (%)
Ancestries Reported - Hungarian (%)
Ancestries Reported - Irish (%)
Ancestries Reported - Italian (%)
Ancestries Reported - Lithuanian (%)
Ancestries Reported - Norwegian (%)
Ancestries Reported - Polish (%)
Ancestries Reported - Portuguese (%)
Ancestries Reported - Russian (%)
Ancestries Reported - Scotch-Irish (%)
Ancestries Reported - Scottish (%)
Ancestries Reported - Slovak (%)
Ancestries Reported - Subsaharan African (%)
Ancestries Reported - Swedish (%)
Ancestries Reported - Swiss (%)
Ancestries Reported - Ukrainian (%)
Ancestries Reported - United States (%)
Ancestries Reported - Welsh (%)
Ancestries Reported - West Indian (%)
Ancestries Reported - Other (%)
Geographical mobility - Same house 1 year ago (%)
Geographical mobility - Same house 1 year ago (%) - White
Geographical mobility - Same house 1 year ago (%) - Black or African American
Geographical mobility - Same house 1 year ago (%) - Asian
Geographical mobility - Same house 1 year ago (%) - Hispanic or Latino
Geographical mobility - Same house 1 year ago (%) - American Indian and Alaska Native
Geographical mobility - Same house 1 year ago (%) - Multirace
Geographical mobility - Same house 1 year ago (%) - Other Race
Geographical mobility - Moved within same county (%)
Geographical mobility - Moved within same county (%) - White
Geographical mobility - Moved within same county (%) - Black or African American
Geographical mobility - Moved within same county (%) - Asian
Geographical mobility - Moved within same county (%) - Hispanic or Latino
Geographical mobility - Moved within same county (%) - American Indian and Alaska Native
Geographical mobility - Moved within same county (%) - Multirace
Geographical mobility - Moved within same county (%) - Other Race
Geographical mobility - Moved from different county within same state (%)
Geographical mobility - Moved from different county within same state (%) - White
Geographical mobility - Moved from different county within same state (%) - Black or African American
Geographical mobility - Moved from different county within same state (%) - Asian
Geographical mobility - Moved from different county within same state (%) - Hispanic or Latino
Geographical mobility - Moved from different county within same state (%) - American Indian and Alaska Native
Geographical mobility - Moved from different county within same state (%) - Multirace
Geographical mobility - Moved from different county within same state (%) - Other Race
Geographical mobility - Moved from different state (%)
Geographical mobility - Moved from different state (%) - White
Geographical mobility - Moved from different state (%) - Black or African American
Geographical mobility - Moved from different state (%) - Asian
Geographical mobility - Moved from different state (%) - Hispanic or Latino
Geographical mobility - Moved from different state (%) - American Indian and Alaska Native
Geographical mobility - Moved from different state (%) - Multirace
Geographical mobility - Moved from different state (%) - Other Race
Geographical mobility - Moved from abroad (%)
Geographical mobility - Moved from abroad (%) - White
Geographical mobility - Moved from abroad (%) - Black or African American
Geographical mobility - Moved from abroad (%) - Asian
Geographical mobility - Moved from abroad (%) - Hispanic or Latino
Geographical mobility - Moved from abroad (%) - American Indian and Alaska Native
Geographical mobility - Moved from abroad (%) - Multirace
Geographical mobility - Moved from abroad (%) - Other Race
Place of birth for the foreign-born population - Ireland (%)
Place of birth for the foreign-born population - Denmark (%)
Place of birth for the foreign-born population - Norway (%)
Place of birth for the foreign-born population - Sweden (%)
Place of birth for the foreign-born population - United Kingdom (%)
Place of birth for the foreign-born population - England (%)
Place of birth for the foreign-born population - Scotland (%)
Place of birth for the foreign-born population - Other Northern Europe (%)
Place of birth for the foreign-born population - Austria (%)
Place of birth for the foreign-born population - Belgium (%)
Place of birth for the foreign-born population - France (%)
Place of birth for the foreign-born population - Germany (%)
Place of birth for the foreign-born population - Netherlands (%)
Place of birth for the foreign-born population - Switzerland (%)
Place of birth for the foreign-born population - Other Western Europe (%)
Place of birth for the foreign-born population - Greece (%)
Place of birth for the foreign-born population - Italy (%)
Place of birth for the foreign-born population - Portugal (%)
Place of birth for the foreign-born population - Spain (%)
Place of birth for the foreign-born population - Other Southern Europe (%)
Place of birth for the foreign-born population - Albania (%)
Place of birth for the foreign-born population - Belarus (%)
Place of birth for the foreign-born population - Bosnia and Herzegovina (%)
Place of birth for the foreign-born population - Bulgaria (%)
Place of birth for the foreign-born population - Croatia (%)
Place of birth for the foreign-born population - Czechoslovakia (%)
Place of birth for the foreign-born population - Hungary (%)
Place of birth for the foreign-born population - Latvia (%)
Place of birth for the foreign-born population - Lithuania (%)
Place of birth for the foreign-born population - North Macedonia (Macedonia) (%)
Place of birth for the foreign-born population - Moldova (%)
Place of birth for the foreign-born population - Poland (%)
Place of birth for the foreign-born population - Romania (%)
Place of birth for the foreign-born population - Russia (%)
Place of birth for the foreign-born population - Serbia (%)
Place of birth for the foreign-born population - Ukraine (%)
Place of birth for the foreign-born population - Other Eastern Europe (%)
Place of birth for the foreign-born population - China (%)
Place of birth for the foreign-born population - Hong Kong (%)
Place of birth for the foreign-born population - Taiwan (%)
Place of birth for the foreign-born population - Japan (%)
Place of birth for the foreign-born population - Korea (%)
Place of birth for the foreign-born population - Other Eastern Asia (%)
Place of birth for the foreign-born population - Afghanistan (%)
Place of birth for the foreign-born population - Bangladesh (%)
Place of birth for the foreign-born population - India (%)
Place of birth for the foreign-born population - Iran (%)
Place of birth for the foreign-born population - Kazakhstan (%)
Place of birth for the foreign-born population - Nepal (%)
Place of birth for the foreign-born population - Pakistan (%)
Place of birth for the foreign-born population - Sri Lanka (%)
Place of birth for the foreign-born population - Uzbekistan (%)
Place of birth for the foreign-born population - Other South Central Asia (%)
Place of birth for the foreign-born population - Burma (%)
Place of birth for the foreign-born population - Cambodia (%)
Place of birth for the foreign-born population - Indonesia (%)
Place of birth for the foreign-born population - Laos (%)
Place of birth for the foreign-born population - Malaysia (%)
Place of birth for the foreign-born population - Philippines (%)
Place of birth for the foreign-born population - Singapore (%)
Place of birth for the foreign-born population - Thailand (%)
Place of birth for the foreign-born population - Vietnam (%)
Place of birth for the foreign-born population - Other South Eastern Asia (%)
Place of birth for the foreign-born population - Armenia (%)
Place of birth for the foreign-born population - Iraq (%)
Place of birth for the foreign-born population - Israel (%)
Place of birth for the foreign-born population - Jordan (%)
Place of birth for the foreign-born population - Kuwait (%)
Place of birth for the foreign-born population - Lebanon (%)
Place of birth for the foreign-born population - Saudi Arabia (%)
Place of birth for the foreign-born population - Syria (%)
Place of birth for the foreign-born population - Turkey (%)
Place of birth for the foreign-born population - Yemen (%)
Place of birth for the foreign-born population - Other Western Asia (%)
Place of birth for the foreign-born population - Eritrea (%)
Place of birth for the foreign-born population - Ethiopia (%)
Place of birth for the foreign-born population - Kenya (%)
Place of birth for the foreign-born population - Somalia (%)
Place of birth for the foreign-born population - Uganda (%)
Place of birth for the foreign-born population - Zimbabwe (%)
Place of birth for the foreign-born population - Other Eastern Africa (%)
Place of birth for the foreign-born population - Cameroon (%)
Place of birth for the foreign-born population - Congo (%)
Place of birth for the foreign-born population - Democratic Republic of Congo (Zaire) (%)
Place of birth for the foreign-born population - Other Middle Africa (%)
Place of birth for the foreign-born population - Egypt (%)
Place of birth for the foreign-born population - Morocco (%)
Place of birth for the foreign-born population - Sudan (%)
Place of birth for the foreign-born population - Other Northern Africa (%)
Place of birth for the foreign-born population - South Africa (%)
Place of birth for the foreign-born population - Other Southern Africa (%)
Place of birth for the foreign-born population - Cabo Verde (%)
Place of birth for the foreign-born population - Ghana (%)
Place of birth for the foreign-born population - Liberia (%)
Place of birth for the foreign-born population - Nigeria (%)
Place of birth for the foreign-born population - Senegal (%)
Place of birth for the foreign-born population - Sierra Leone (%)
Place of birth for the foreign-born population - Other Western Africa (%)
Place of birth for the foreign-born population - Australia (%)
Place of birth for the foreign-born population - New Zealand (%)
Place of birth for the foreign-born population - Fiji (%)
Place of birth for the foreign-born population - Micronesia (%)
Place of birth for the foreign-born population - Bahamas (%)
Place of birth for the foreign-born population - Barbados (%)
Place of birth for the foreign-born population - Cuba (%)
Place of birth for the foreign-born population - Dominica (%)
Place of birth for the foreign-born population - Dominican Republic (%)
Place of birth for the foreign-born population - Grenada (%)
Place of birth for the foreign-born population - Haiti (%)
Place of birth for the foreign-born population - Jamaica (%)
Place of birth for the foreign-born population - St. Vincent and the Grenadines (%)
Place of birth for the foreign-born population - Trinidad and Tobago (%)
Place of birth for the foreign-born population - West Indies (%)
Place of birth for the foreign-born population - Other Caribbean (%)
Place of birth for the foreign-born population - Belize (%)
Place of birth for the foreign-born population - Costa Rica (%)
Place of birth for the foreign-born population - El Salvador (%)
Place of birth for the foreign-born population - Guatemala (%)
Place of birth for the foreign-born population - Honduras (%)
Place of birth for the foreign-born population - Mexico (%)
Place of birth for the foreign-born population - Nicaragua (%)
Place of birth for the foreign-born population - Panama (%)
Place of birth for the foreign-born population - Other Central America (%)
Place of birth for the foreign-born population - Argentina (%)
Place of birth for the foreign-born population - Bolivia (%)
Place of birth for the foreign-born population - Brazil (%)
Place of birth for the foreign-born population - Chile (%)
Place of birth for the foreign-born population - Colombia (%)
Place of birth for the foreign-born population - Ecuador (%)
Place of birth for the foreign-born population - Guyana (%)
Place of birth for the foreign-born population - Peru (%)
Place of birth for the foreign-born population - Uruguay (%)
Place of birth for the foreign-born population - Venezuela (%)
Place of birth for the foreign-born population - Other South America (%)
Place of birth for the foreign-born population - Canada (%)
Place of birth for the foreign-born population - Other Northern America (%)
Place of birth for the foreign-born population - Other (%)
Latest news about races in Danville, VA collected exclusively by city-data.com from local newspapers, TV, and radio stations
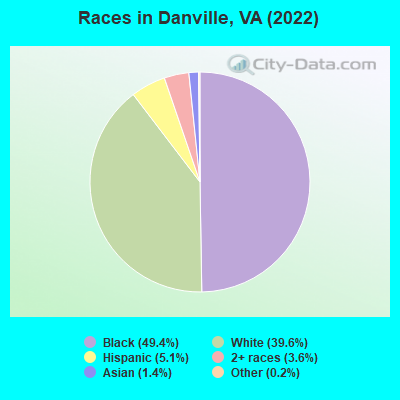
According to 2022 data, the most numerous races in Danville, VA are White alone (16,953 residents), Black alone (21,126 residents), and Hispanic (2,187 residents). 94.1% of Danville residents speak English at home. 3.6% of Danville, VA residents are foreign-born (2.1% born in Latin America, 1.1% born in Asia), which is 231.1% less than the foreign-born rate of 12.0% across the entire state of Virginia.
Race distribution in Danville
2000 2022
4,965,637 70.2% White alone 1,376,378 19.4% Black alone 329,540 4.7% Hispanic 259,277 3.7% Asian alone 114,022 1.6% Two or more races 18,596 0.3% American Indian alone 11,685 0.2% Other race alone 3,380 0.05% Native Hawaiian and Other
5,095,130 58.7% White alone 1,594,785 18.4% Black alone 905,750 10.4% Hispanic 602,881 6.9% Asian alone 406,047 4.7% Two or more races 60,419 0.7% Other race alone 11,738 0.1% American Indian alone 6,869 0.08% Native Hawaiian and Other
Income and house value in Danville Median household income in 2022 $45,637 White non-Hispanic householders$35,782 Black householders$101,880 Asian householders$55,535 Some other race householders$43,574 Two or more races householders$39,628 Hispanic or Latino race householdersMedian 2022 house value $119,839 White Non-Hispanic householders$96,721 Black or African American householders$108,516 American Indian or Alaska Native householders $239,836 Asian householders$149,406 Some other race householders$137,611 Two or more races householders$145,474 Hispanic or Latino householders
Median age by race in Danville
51.5 Median age for White residents46.8 56.0 37.2 Median age for Black or African American residents33.6 40.9 46.9 Median age for American Indian / Alaska Native residents31.3 -687,861,271.0 41.2 Median age for Asian residents47.2 33.2 -611,955,419.9 Median age for Native Hawaiian / Pacific Islander residents-541,531,822.5 -714,150,046.8 37.1 Median age for Other race residents42.3 24.6 28.2 Median age for Two or more races residents25.5 31.9 51.9 Median age for White alone residents48.0 56.3 25.0 Median age for Hispanic or Latino residents24.5 26.4
Owner/renter occupied households by race in Danville
House owners and renters - White residents 5,463 64.7% Owner occupied2,979 35.3% Renter occupiedHouse owners and renters - Black or African American residents 3,629 39.2% Owner occupied5,629 60.8% Renter occupiedHouse owners and renters - American Indian / Alaska Native residents 6 32.9% Owner occupied11 67.1% Renter occupiedHouse owners and renters - Asian residents 93 55.2% Owner occupied75 44.8% Renter occupiedHouse owners and renters - Other race residents 65 45.3% Owner occupied79 54.7% Renter occupiedHouse owners and renters - Two or more races residents 396 35.8% Owner occupied709 64.2% Renter occupiedHouse owners and renters - White alone residents 5,444 64.6% Owner occupied2,985 35.4% Renter occupiedHouse owners and renters - Hispanic or Latino residents 328 47.0% Owner occupied370 53.0% Renter occupied
Language usage in Danville
English speakers - Total 94.1% of residents of Danville speak English at home.
3.8% of residents speak Spanish at home 885 58.0% Speak English very well641 42.0% Speak English less than very well1.8% of residents speak other language at home 441 61.9% Speak English very well272 38.1% Speak English less than very well
English speakers - Born in the United States 94.9% of residents of Danville speak English at home.
4.6% of residents speak Spanish at home 485 100.0% Speak English very well0.4% of residents speak other language at home 41 100.0% Speak English very well
English speakers - Native, born elsewhere 31.0% of residents of Danville speak English at home.
53.7% of residents speak Spanish at home 100 86.2% Speak English very well16 13.8% Speak English less than very well24.5% of residents speak other language at home 7 13.2% Speak English very well46 86.8% Speak English less than very well
English speakers - Foreign-born 16.7% of residents of Danville speak English at home.
49.6% of residents speak Spanish at home 181 23.6% Speak English very well587 76.4% Speak English less than very well32.1% of residents speak other language at home 296 59.6% Speak English very well201 40.4% Speak English less than very well
White (Caucasian) - Speak only English Native:
99.8% (16,311)Foreign-born:
19.1% (44)
White (Caucasian) - Speak another language Native:
0.9% (139)Foreign-born:
78.6% (182)
Black or African American - Speak only English Native:
98.9% (19,385)Foreign-born:
54.6% (62)
Black or African American - Speak another language Native:
0.9% (179)Foreign-born:
40.4% (46)
Asian - Speak only English Native:
39.3% (50)Foreign-born:
15.3% (73)
Asian - Speak another language Native:
63.0% (81)Foreign-born:
84.8% (403)
Other race - Speak another language Native:
58.7% (137)Foreign-born:
98.4% (181)
Two or more races - Speak only English Native:
74.3% (1,643)Foreign-born:
14.3% (100)
Two or more races - Speak another language Native:
26.5% (586)Foreign-born:
85.5% (598)
White alone - Speak only English Native:
99.6% (16,195)Foreign-born:
44.9% (47)
White alone - Speak another language Native:
0.5% (75)Foreign-born:
53.9% (57)
Hispanic or Latino - Speak only English Native:
46.2% (530)Foreign-born:
8.8% (76)
Hispanic or Latino - Speak another language Native:
53.6% (615)Foreign-born:
91.3% (781)
Foreign-born residents in Danville 1,551 residents are foreign born (2.1% Latin America , 1.1% Asia ).
This city:
3.6%Virginia:
12.6%
Marital status for residents in Danville Marital status - White (Caucasian) population 15 years and over
Males 35.6% Never married44.8% Now married1.8% Separated6.1% Widowed11.7% DivorcedFemales 20.4% Never married40.3% Now married3.3% Separated16.5% Widowed19.6% DivorcedWomen who gave birth in the past 12 months Now married:
55.9% (58)Unmarried:
44.1% (46)
Women who did not give birth in the past 12 months Now married:
39.2% (1,114)Unmarried:
60.8% (1,727)
Marital status - Black or African American population 15 years and over
Males 51.3% Never married28.3% Now married5.3% Separated3.5% Widowed11.6% DivorcedFemales 44.8% Never married21.6% Now married6.6% Separated12.1% Widowed15.0% DivorcedWomen who gave birth in the past 12 months Now married:
28.8% (82)Unmarried:
71.2% (202)
Women who did not give birth in the past 12 months Now married:
24.6% (1,198)Unmarried:
75.4% (3,666)
Marital status - American Indian / Alaska Native population 15 years and over
Males 40.0% Never married26.7% Now married0.0% Separated0.0% Widowed33.3% DivorcedFemales 0.0% Never married60.0% Now married0.0% Separated0.0% Widowed40.0% DivorcedWomen who did not give birth in the past 12 months Now married:
0.0% (0)Unmarried:
100.0% (6)
Marital status - Asian population 15 years and over
Males 36.2% Never married57.6% Now married0.4% Separated5.7% Widowed0.0% DivorcedFemales 36.7% Never married52.0% Now married4.3% Separated2.5% Widowed4.6% DivorcedWomen who gave birth in the past 12 months Now married:
24.3% (9)Unmarried:
75.7% (29)
Women who did not give birth in the past 12 months Now married:
42.9% (68)Unmarried:
57.1% (91)
Marital status - Native Hawaiian / Pacific Islander population 15 years and over
Males 100.0% Never married0.0% Now married0.0% Separated0.0% Widowed0.0% DivorcedFemales 100.0% Never married0.0% Now married0.0% Separated0.0% Widowed0.0% DivorcedWomen who did not give birth in the past 12 months Now married:
0.0% (0)Unmarried:
100.0% (3)
Marital status - Other race population 15 years and over
Males 30.6% Never married21.6% Now married0.0% Separated8.2% Widowed39.6% DivorcedFemales 7.6% Never married53.3% Now married0.0% Separated0.0% Widowed39.1% DivorcedWomen who gave birth in the past 12 months Now married:
100.0% (5)Unmarried:
0.0% (0)
Women who did not give birth in the past 12 months Now married:
32.8% (28)Unmarried:
67.2% (57)
Marital status - Two or more races population 15 years and over
Males 33.5% Never married33.7% Now married0.0% Separated0.0% Widowed32.8% DivorcedFemales 17.8% Never married42.0% Now married3.7% Separated8.1% Widowed28.4% DivorcedWomen who did not give birth in the past 12 months Now married:
57.2% (375)Unmarried:
42.8% (280)
Marital status - White alone, not Hispanic / Latino population 15 years and over
Males 34.5% Never married45.2% Now married1.8% Separated6.4% Widowed12.1% DivorcedFemales 19.9% Never married40.3% Now married3.3% Separated16.8% Widowed19.6% DivorcedWomen who gave birth in the past 12 months Now married:
80.5% (61)Unmarried:
19.5% (15)
Women who did not give birth in the past 12 months Now married:
38.7% (1,106)Unmarried:
61.3% (1,751)
Marital status - Hispanic or Latino population 15 years and over
Males 41.8% Never married40.6% Now married0.0% Separated1.5% Widowed16.0% DivorcedFemales 30.3% Never married39.6% Now married2.1% Separated6.4% Widowed21.5% DivorcedWomen who gave birth in the past 12 months Now married:
10.5% (4)Unmarried:
89.5% (36)
Women who did not give birth in the past 12 months Now married:
55.0% (256)Unmarried:
45.0% (209)
Ancestries in Danville
4,247 14.5% American2,613 8.9% English1,965 6.7% African526 1.8% Irish475 1.6% German253 0.9% European253 0.9% Scotch-Irish241 0.8% British213 0.7% Scottish102 0.3% Italian82 0.3% French56 0.2% Polish47 0.2% Norwegian35 0.1% Pennsylvania German34 0.1% Jamaican29 0.10% Welsh25 0.09% Dutch16 0.05% Scandinavian13 0.04% Nigerian10 0.03% Russian9 0.03% Greek8 0.03% Austrian7 0.02% Canadian6 0.02% Hungarian5 0.02% Czech5 0.02% Swiss4 0.01% French Canadian4 0.01% Northern European4 0.01% Bahamian
Geographical mobility in Danville Same house 1 year ago 15,263 90.0% White (Caucasian)18,755 89.2% Black or African American20 60.9% American Indian / Alaska Native522 83.8% Asian7 95.3% Native Hawaiian / Pacific Islander407 97.7% Other race2,627 85.0% Two or more races15,171 89.7% White alone, not Hispanic / Latino2,021 94.9% Hispanic or LatinoMoved within same county 796 4.7% White / Caucasian1,131 5.4% Black or African American23 69.0% American Indian / Alaska Native10 2.4% Other race161 5.2% Two or more races817 4.8% White alone, not Hispanic / Latino12 0.6% Hispanic or LatinoMoved within same state 587 3.5% White / Caucasian625 3.0% Black or African American5 1.2% Other race141 4.6% Two or more races604 3.6% White alone, not Hispanic / Latino19 0.9% Hispanic or LatinoMoved from different state 302 1.8% White / Caucasian436 2.1% Black or African American62 10.0% Asian158 5.1% Two or more races289 1.7% White alone, not Hispanic / Latino75 3.5% Hispanic or LatinoMoved from abroad 11 0.1% White19 0.1% Black or African American48 7.7% Asian4 0.1% Two or more races13 0.1% White alone, not Hispanic / Latino3 0.1% Hispanic or Latino
Children Nativity (place of birth) in Danville
Children under 6 years - Living with two parents Both parents native 925 99.8% Native2 0.2% Foreign-bornBoth parents foreign-born 12 100.0% NativeOne native, one foreign-born parent 15 100.0% NativeChildren under 6 years - Living with one parent Native parent 1,923 99.7% Native5 0.3% Foreign-bornForeign-born parent 22 100.0% NativeChildren 6 to 17 years - Living with two parents Both parents native 2,180 99.9% Native2 0.1% Foreign-bornBoth parents foreign-born 124 73.8% Native44 26.2% Foreign-bornOne native, one foreign-born parent 75 100.0% NativeChildren 6 to 17 years - Living with one parent Native parent 3,392 98.2% Native62 1.8% Foreign-bornForeign-born parent 87 87.3% Native13 12.7% Foreign-born
Grandparents responsible for own grandchildren in Danville
Grandparents (30 to 59 years) White / Caucasian 60 55.9% Responsible for grandchildren47 44.1% Not responsible for grandchildrenBlack or African American 73 42.3% Responsible for grandchildren100 57.7% Not responsible for grandchildrenAsian 72 100.0% Not responsible for grandchildrenWhite alone, not Hispanic / Latino 61 53.7% Responsible for grandchildren53 46.3% Not responsible for grandchildrenGrandparents (60 years and over) White / Caucasian 124 70.1% Responsible for grandchildren53 29.9% Not responsible for grandchildrenBlack or African American 86 30.6% Responsible for grandchildren195 69.4% Not responsible for grandchildrenAsian 16 100.0% Not responsible for grandchildrenWhite alone, not Hispanic / Latino 126 69.3% Responsible for grandchildren56 30.7% Not responsible for grandchildren