Races in Cutler Bay, Florida (FL) Detailed Stats
Data:
Races - White alone (%)
Races - White alone (% change since 2000)
Races - Black alone (%)
Races - Black alone (% change since 2000)
Races - American Indian alone (%)
Races - American Indian alone (% change since 2000)
Races - Asian alone (%)
Races - Asian alone (% change since 2000)
Races - Hispanic (%)
Races - Hispanic (% change since 2000)
Races - Native Hawaiian and Other Pacific Islander alone (%)
Races - Native Hawaiian and Other Pacific Islander alone (% change since 2000)
Races - Two or more races(%)
Races - Two or more races(% change since 2000)
Races - Other race alone (%)
Races - Other race alone (% change since 2000)
Racial diversity
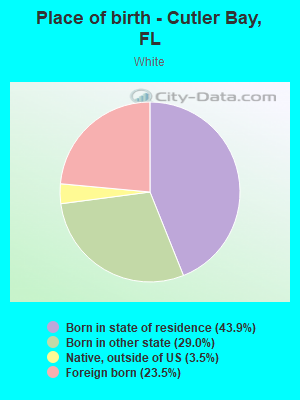
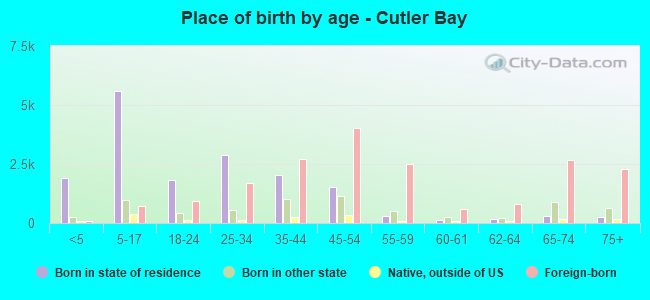
Place of birth - Born in state of residence (%)
Place of birth - Born in state of residence (%) - White
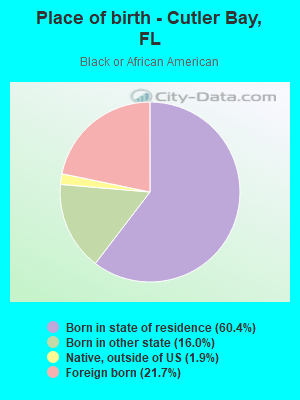
Place of birth - Born in state of residence (%) - Black or African American
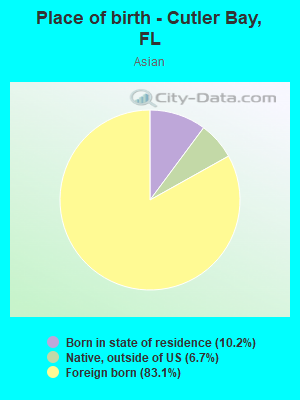
Place of birth - Born in state of residence (%) - Asian
Place of birth - Born in state of residence (%) - Hispanic or Latino
Place of birth - Born in state of residence (%) - American Indian and Alaska Native
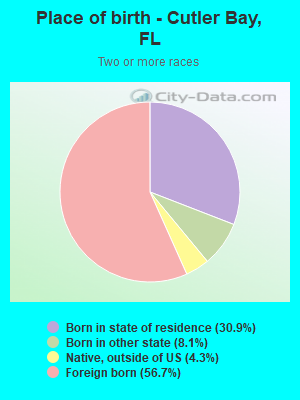
Place of birth - Born in state of residence (%) - Multirace
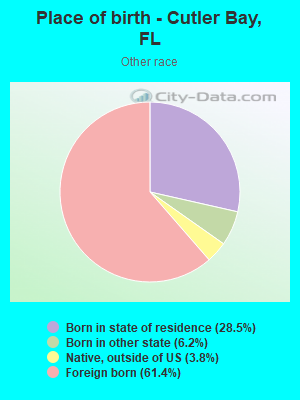
Place of birth - Born in state of residence (%) - Other Race
Place of birth - Born in other state (%)
Place of birth - Born in other state (%) - White
Place of birth - Born in other state (%) - Black or African American
Place of birth - Born in other state (%) - Asian
Place of birth - Born in other state (%) - Hispanic or Latino
Place of birth - Born in other state (%) - American Indian and Alaska Native
Place of birth - Born in other state (%) - Multirace
Place of birth - Born in other state (%) - Other Race
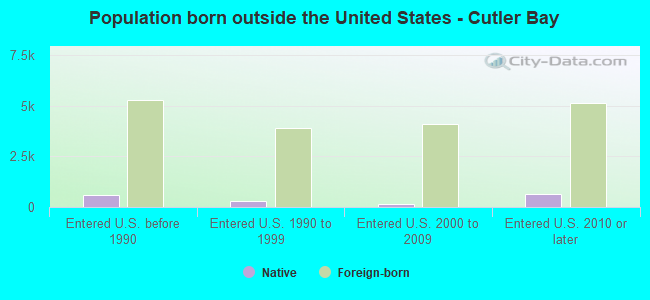
Place of birth - Native, outside of US (%)
Place of birth - Native, outside of US (%) - White
Place of birth - Native, outside of US (%) - Black or African American
Place of birth - Native, outside of US (%) - Asian
Place of birth - Native, outside of US (%) - Hispanic or Latino
Place of birth - Native, outside of US (%) - American Indian and Alaska Native
Place of birth - Native, outside of US (%) - Multirace
Place of birth - Native, outside of US (%) - Other Race
Place of birth - Foreign born (%)
Place of birth - Foreign born (%) - White
Place of birth - Foreign born (%) - Black or African American
Place of birth - Foreign born (%) - Asian
Place of birth - Foreign born (%) - Hispanic or Latino
Place of birth - Foreign born (%) - American Indian and Alaska Native
Place of birth - Foreign born (%) - Multirace
Place of birth - Foreign born (%) - Other Race
Residents speaking English at home (%)
Residents speaking English at home - Born in the United States (%)
Residents speaking English at home - Native, born elsewhere (%)
Residents speaking English at home - Foreign born (%)
Residents speaking Spanish at home (%)
Residents speaking Spanish at home - Born in the United States (%)
Residents speaking Spanish at home - Native, born elsewhere (%)
Residents speaking Spanish at home - Foreign born (%)
Residents speaking other language at home (%)
Residents speaking other language at home - Born in the United States (%)
Residents speaking other language at home - Native, born elsewhere (%)
Residents speaking other language at home - Foreign born (%)
Marital status - Never married (%)
Marital status - Now married (%)
Marital status - Separated (%)
Marital status - Widowed (%)
Marital status - Divorced (%)
Ancestries Reported - Arab (%)
Ancestries Reported - Czech (%)
Ancestries Reported - Danish (%)
Ancestries Reported - Dutch (%)
Ancestries Reported - English (%)
Ancestries Reported - French (%)
Ancestries Reported - French Canadian (%)
Ancestries Reported - German (%)
Ancestries Reported - Greek (%)
Ancestries Reported - Hungarian (%)
Ancestries Reported - Irish (%)
Ancestries Reported - Italian (%)
Ancestries Reported - Lithuanian (%)
Ancestries Reported - Norwegian (%)
Ancestries Reported - Polish (%)
Ancestries Reported - Portuguese (%)
Ancestries Reported - Russian (%)
Ancestries Reported - Scotch-Irish (%)
Ancestries Reported - Scottish (%)
Ancestries Reported - Slovak (%)
Ancestries Reported - Subsaharan African (%)
Ancestries Reported - Swedish (%)
Ancestries Reported - Swiss (%)
Ancestries Reported - Ukrainian (%)
Ancestries Reported - United States (%)
Ancestries Reported - Welsh (%)
Ancestries Reported - West Indian (%)
Ancestries Reported - Other (%)
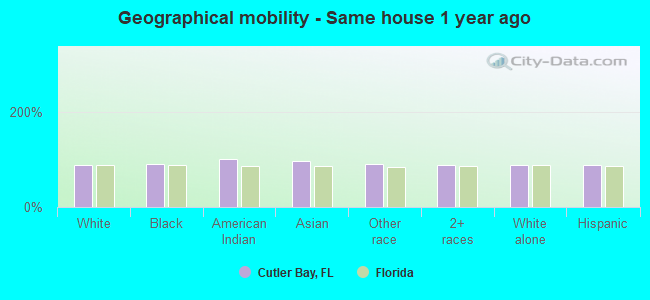
Geographical mobility - Same house 1 year ago (%)
Geographical mobility - Same house 1 year ago (%) - White
Geographical mobility - Same house 1 year ago (%) - Black or African American
Geographical mobility - Same house 1 year ago (%) - Asian
Geographical mobility - Same house 1 year ago (%) - Hispanic or Latino
Geographical mobility - Same house 1 year ago (%) - American Indian and Alaska Native
Geographical mobility - Same house 1 year ago (%) - Multirace
Geographical mobility - Same house 1 year ago (%) - Other Race
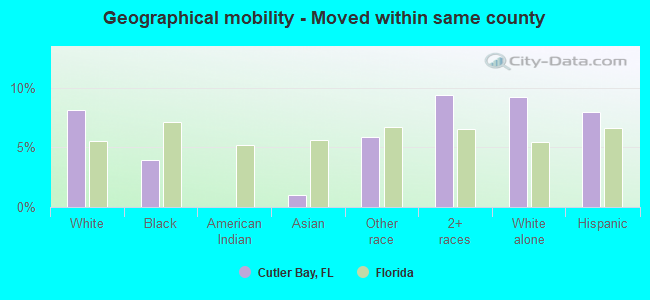
Geographical mobility - Moved within same county (%)
Geographical mobility - Moved within same county (%) - White
Geographical mobility - Moved within same county (%) - Black or African American
Geographical mobility - Moved within same county (%) - Asian
Geographical mobility - Moved within same county (%) - Hispanic or Latino
Geographical mobility - Moved within same county (%) - American Indian and Alaska Native
Geographical mobility - Moved within same county (%) - Multirace
Geographical mobility - Moved within same county (%) - Other Race
Geographical mobility - Moved from different county within same state (%)
Geographical mobility - Moved from different county within same state (%) - White
Geographical mobility - Moved from different county within same state (%) - Black or African American
Geographical mobility - Moved from different county within same state (%) - Asian
Geographical mobility - Moved from different county within same state (%) - Hispanic or Latino
Geographical mobility - Moved from different county within same state (%) - American Indian and Alaska Native
Geographical mobility - Moved from different county within same state (%) - Multirace
Geographical mobility - Moved from different county within same state (%) - Other Race
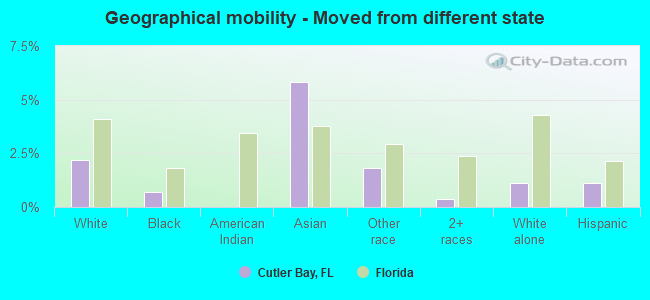
Geographical mobility - Moved from different state (%)
Geographical mobility - Moved from different state (%) - White
Geographical mobility - Moved from different state (%) - Black or African American
Geographical mobility - Moved from different state (%) - Asian
Geographical mobility - Moved from different state (%) - Hispanic or Latino
Geographical mobility - Moved from different state (%) - American Indian and Alaska Native
Geographical mobility - Moved from different state (%) - Multirace
Geographical mobility - Moved from different state (%) - Other Race
Geographical mobility - Moved from abroad (%)
Geographical mobility - Moved from abroad (%) - White
Geographical mobility - Moved from abroad (%) - Black or African American
Geographical mobility - Moved from abroad (%) - Asian
Geographical mobility - Moved from abroad (%) - Hispanic or Latino
Geographical mobility - Moved from abroad (%) - American Indian and Alaska Native
Geographical mobility - Moved from abroad (%) - Multirace
Geographical mobility - Moved from abroad (%) - Other Race
Place of birth for the foreign-born population - Ireland (%)
Place of birth for the foreign-born population - Denmark (%)
Place of birth for the foreign-born population - Norway (%)
Place of birth for the foreign-born population - Sweden (%)
Place of birth for the foreign-born population - United Kingdom (%)
Place of birth for the foreign-born population - England (%)
Place of birth for the foreign-born population - Scotland (%)
Place of birth for the foreign-born population - Other Northern Europe (%)
Place of birth for the foreign-born population - Austria (%)
Place of birth for the foreign-born population - Belgium (%)
Place of birth for the foreign-born population - France (%)
Place of birth for the foreign-born population - Germany (%)
Place of birth for the foreign-born population - Netherlands (%)
Place of birth for the foreign-born population - Switzerland (%)
Place of birth for the foreign-born population - Other Western Europe (%)
Place of birth for the foreign-born population - Greece (%)
Place of birth for the foreign-born population - Italy (%)
Place of birth for the foreign-born population - Portugal (%)
Place of birth for the foreign-born population - Spain (%)
Place of birth for the foreign-born population - Other Southern Europe (%)
Place of birth for the foreign-born population - Albania (%)
Place of birth for the foreign-born population - Belarus (%)
Place of birth for the foreign-born population - Bosnia and Herzegovina (%)
Place of birth for the foreign-born population - Bulgaria (%)
Place of birth for the foreign-born population - Croatia (%)
Place of birth for the foreign-born population - Czechoslovakia (%)
Place of birth for the foreign-born population - Hungary (%)
Place of birth for the foreign-born population - Latvia (%)
Place of birth for the foreign-born population - Lithuania (%)
Place of birth for the foreign-born population - North Macedonia (Macedonia) (%)
Place of birth for the foreign-born population - Moldova (%)
Place of birth for the foreign-born population - Poland (%)
Place of birth for the foreign-born population - Romania (%)
Place of birth for the foreign-born population - Russia (%)
Place of birth for the foreign-born population - Serbia (%)
Place of birth for the foreign-born population - Ukraine (%)
Place of birth for the foreign-born population - Other Eastern Europe (%)
Place of birth for the foreign-born population - China (%)
Place of birth for the foreign-born population - Hong Kong (%)
Place of birth for the foreign-born population - Taiwan (%)
Place of birth for the foreign-born population - Japan (%)
Place of birth for the foreign-born population - Korea (%)
Place of birth for the foreign-born population - Other Eastern Asia (%)
Place of birth for the foreign-born population - Afghanistan (%)
Place of birth for the foreign-born population - Bangladesh (%)
Place of birth for the foreign-born population - India (%)
Place of birth for the foreign-born population - Iran (%)
Place of birth for the foreign-born population - Kazakhstan (%)
Place of birth for the foreign-born population - Nepal (%)
Place of birth for the foreign-born population - Pakistan (%)
Place of birth for the foreign-born population - Sri Lanka (%)
Place of birth for the foreign-born population - Uzbekistan (%)
Place of birth for the foreign-born population - Other South Central Asia (%)
Place of birth for the foreign-born population - Burma (%)
Place of birth for the foreign-born population - Cambodia (%)
Place of birth for the foreign-born population - Indonesia (%)
Place of birth for the foreign-born population - Laos (%)
Place of birth for the foreign-born population - Malaysia (%)
Place of birth for the foreign-born population - Philippines (%)
Place of birth for the foreign-born population - Singapore (%)
Place of birth for the foreign-born population - Thailand (%)
Place of birth for the foreign-born population - Vietnam (%)
Place of birth for the foreign-born population - Other South Eastern Asia (%)
Place of birth for the foreign-born population - Armenia (%)
Place of birth for the foreign-born population - Iraq (%)
Place of birth for the foreign-born population - Israel (%)
Place of birth for the foreign-born population - Jordan (%)
Place of birth for the foreign-born population - Kuwait (%)
Place of birth for the foreign-born population - Lebanon (%)
Place of birth for the foreign-born population - Saudi Arabia (%)
Place of birth for the foreign-born population - Syria (%)
Place of birth for the foreign-born population - Turkey (%)
Place of birth for the foreign-born population - Yemen (%)
Place of birth for the foreign-born population - Other Western Asia (%)
Place of birth for the foreign-born population - Eritrea (%)
Place of birth for the foreign-born population - Ethiopia (%)
Place of birth for the foreign-born population - Kenya (%)
Place of birth for the foreign-born population - Somalia (%)
Place of birth for the foreign-born population - Uganda (%)
Place of birth for the foreign-born population - Zimbabwe (%)
Place of birth for the foreign-born population - Other Eastern Africa (%)
Place of birth for the foreign-born population - Cameroon (%)
Place of birth for the foreign-born population - Congo (%)
Place of birth for the foreign-born population - Democratic Republic of Congo (Zaire) (%)
Place of birth for the foreign-born population - Other Middle Africa (%)
Place of birth for the foreign-born population - Egypt (%)
Place of birth for the foreign-born population - Morocco (%)
Place of birth for the foreign-born population - Sudan (%)
Place of birth for the foreign-born population - Other Northern Africa (%)
Place of birth for the foreign-born population - South Africa (%)
Place of birth for the foreign-born population - Other Southern Africa (%)
Place of birth for the foreign-born population - Cabo Verde (%)
Place of birth for the foreign-born population - Ghana (%)
Place of birth for the foreign-born population - Liberia (%)
Place of birth for the foreign-born population - Nigeria (%)
Place of birth for the foreign-born population - Senegal (%)
Place of birth for the foreign-born population - Sierra Leone (%)
Place of birth for the foreign-born population - Other Western Africa (%)
Place of birth for the foreign-born population - Australia (%)
Place of birth for the foreign-born population - New Zealand (%)
Place of birth for the foreign-born population - Fiji (%)
Place of birth for the foreign-born population - Micronesia (%)
Place of birth for the foreign-born population - Bahamas (%)
Place of birth for the foreign-born population - Barbados (%)
Place of birth for the foreign-born population - Cuba (%)
Place of birth for the foreign-born population - Dominica (%)
Place of birth for the foreign-born population - Dominican Republic (%)
Place of birth for the foreign-born population - Grenada (%)
Place of birth for the foreign-born population - Haiti (%)
Place of birth for the foreign-born population - Jamaica (%)
Place of birth for the foreign-born population - St. Vincent and the Grenadines (%)
Place of birth for the foreign-born population - Trinidad and Tobago (%)
Place of birth for the foreign-born population - West Indies (%)
Place of birth for the foreign-born population - Other Caribbean (%)
Place of birth for the foreign-born population - Belize (%)
Place of birth for the foreign-born population - Costa Rica (%)
Place of birth for the foreign-born population - El Salvador (%)
Place of birth for the foreign-born population - Guatemala (%)
Place of birth for the foreign-born population - Honduras (%)
Place of birth for the foreign-born population - Mexico (%)
Place of birth for the foreign-born population - Nicaragua (%)
Place of birth for the foreign-born population - Panama (%)
Place of birth for the foreign-born population - Other Central America (%)
Place of birth for the foreign-born population - Argentina (%)
Place of birth for the foreign-born population - Bolivia (%)
Place of birth for the foreign-born population - Brazil (%)
Place of birth for the foreign-born population - Chile (%)
Place of birth for the foreign-born population - Colombia (%)
Place of birth for the foreign-born population - Ecuador (%)
Place of birth for the foreign-born population - Guyana (%)
Place of birth for the foreign-born population - Peru (%)
Place of birth for the foreign-born population - Uruguay (%)
Place of birth for the foreign-born population - Venezuela (%)
Place of birth for the foreign-born population - Other South America (%)
Place of birth for the foreign-born population - Canada (%)
Place of birth for the foreign-born population - Other Northern America (%)
Place of birth for the foreign-born population - Other (%)
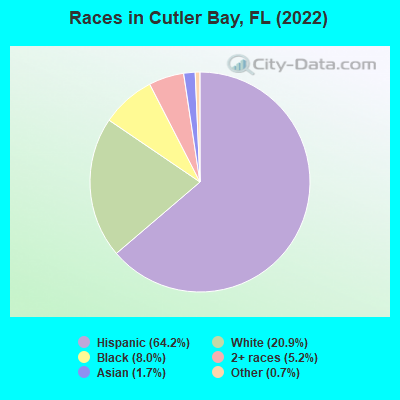
According to 2022 data, the most numerous races in Cutler Bay, FL are White alone (9,284 residents), Hispanic (28,578 residents), and Black alone (3,570 residents). 35.3% of Cutler Bay residents speak English at home.
Race distribution in Cutler Bay 28,578 64.2% Hispanic 9,284 20.9% White alone 3,570 8.0% Black alone 2,326 5.2% Two or more races 772 1.7% Asian alone 331 0.7% Other race alone 26 0.06% American Indian alone
2000 2022
10,458,509 65.4% White alone 2,682,715 16.8% Hispanic 2,264,268 14.2% Black alone 261,693 1.6% Asian alone 236,954 1.5% Two or more races 42,358 0.3% American Indian alone 28,994 0.2% Other race alone 6,887 0.04% Native Hawaiian and Other
11,309,403 50.8% White alone 6,025,039 27.1% Hispanic 3,241,015 14.6% Black alone 861,630 3.9% Two or more races 623,692 2.8% Asian alone 152,054 0.7% Other race alone 22,504 0.1% American Indian alone 9,486 0.04% Native Hawaiian and Other
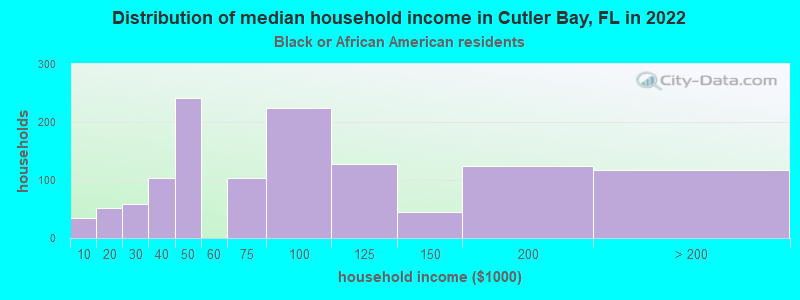
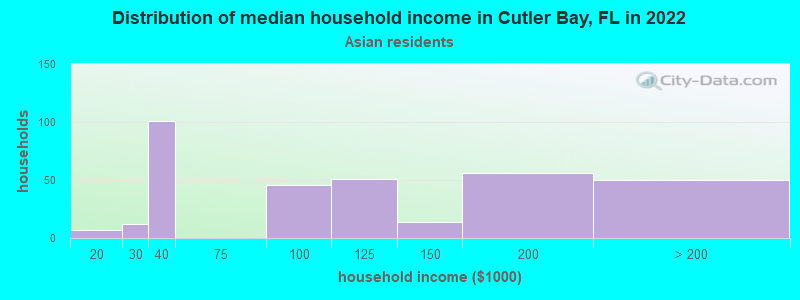
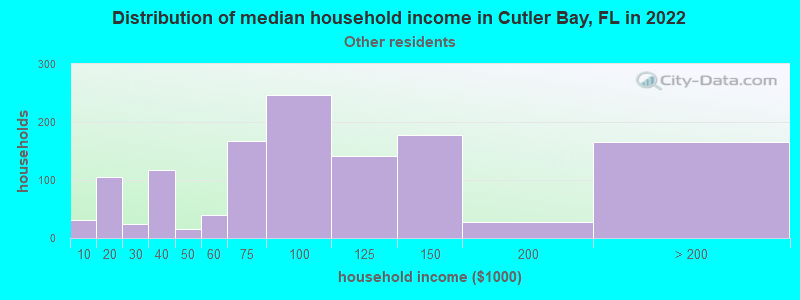
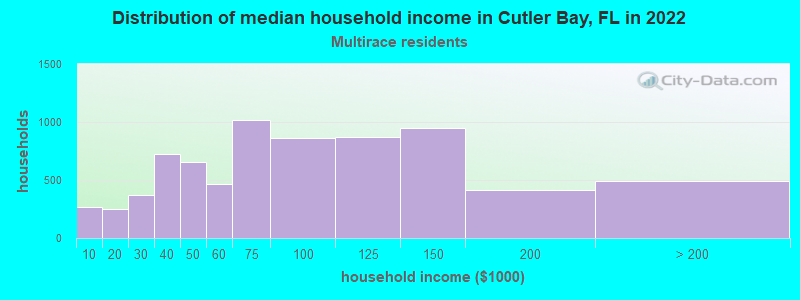
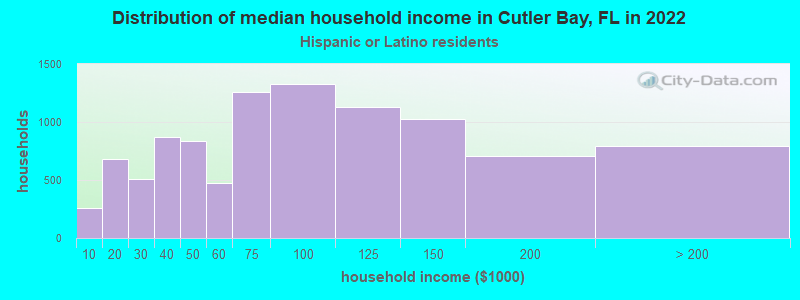
Income and house value in Cutler Bay Median household income in 2022 $94,112 White non-Hispanic householders$71,371 Black householders$116,533 Asian householders$92,544 Some other race householders$74,886 Two or more races householders$76,343 Hispanic or Latino race householders
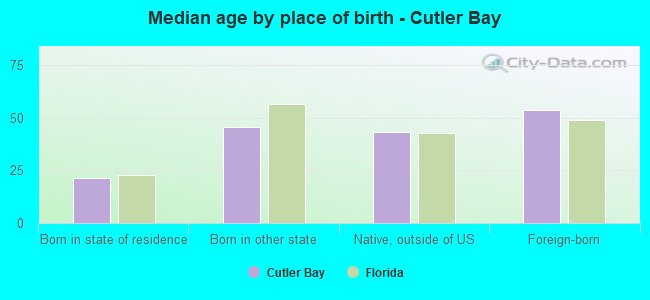
Median age by race in Cutler Bay
36.8 Median age for White residents36.9 36.9 33.0 Median age for Black or African American residents30.5 38.3 43.3 Median age for American Indian / Alaska Native residents-543,352,600.6 37.8 60.7 Median age for Asian residents68.0 54.6 -679,849,340.2 Median age for Native Hawaiian / Pacific Islander residents-858,307,848.3 -443,298,968.6 39.4 Median age for Other race residents39.4 39.5 45.7 Median age for Two or more races residents41.4 47.6 38.7 Median age for White alone residents37.9 39.1 42.7 Median age for Hispanic or Latino residents40.8 44.6
Owner/renter occupied households by race in Cutler Bay
House owners and renters - White residents 3,158 69.3% Owner occupied1,400 30.7% Renter occupiedHouse owners and renters - Black or African American residents 715 58.6% Owner occupied504 41.4% Renter occupiedHouse owners and renters - American Indian / Alaska Native residents 9 100.0% Owner occupiedHouse owners and renters - Asian residents 281 92.5% Owner occupied23 7.5% Renter occupiedHouse owners and renters - Other race residents 687 56.5% Owner occupied528 43.5% Renter occupiedHouse owners and renters - Two or more races residents 4,689 64.1% Owner occupied2,624 35.9% Renter occupiedHouse owners and renters - White alone residents 2,176 73.8% Owner occupied771 26.2% Renter occupiedHouse owners and renters - Hispanic or Latino residents 6,183 62.8% Owner occupied3,661 37.2% Renter occupied
Language usage in Cutler Bay
English speakers - Total 35.3% of residents of Cutler Bay speak English at home.
58.9% of residents speak Spanish at home 15,384 61.9% Speak English very well9,486 38.1% Speak English less than very well5.6% of residents speak other language at home 1,815 76.2% Speak English very well567 23.8% Speak English less than very well
English speakers - Born in the United States 68.3% of residents of Cutler Bay speak English at home.
30.1% of residents speak Spanish at home 1,855 93.7% Speak English very well125 6.3% Speak English less than very well1.1% of residents speak other language at home 75 100.0% Speak English very well
English speakers - Native, born elsewhere 23.1% of residents of Cutler Bay speak English at home.
75.6% of residents speak Spanish at home 1,005 78.8% Speak English very well271 21.2% Speak English less than very well
English speakers - Foreign-born 10.7% of residents of Cutler Bay speak English at home.
79.4% of residents speak Spanish at home 6,294 41.7% Speak English very well8,783 58.3% Speak English less than very well9.9% of residents speak other language at home 1,355 72.0% Speak English very well528 28.0% Speak English less than very well
White (Caucasian) - Speak only English Native:
73.8% (7,401)Foreign-born:
11.9% (397)
White (Caucasian) - Speak another language Native:
32.8% (3,286)Foreign-born:
88.9% (2,971)
Black or African American - Speak only English Native:
89.0% (2,467)Foreign-born:
59.5% (487)
Black or African American - Speak another language Native:
11.0% (306)Foreign-born:
43.7% (357)
American Indian / Alaska Native - Speak another language Native:
100.0% (53)Foreign-born:
98.3% (48)
Asian - Speak only English Native:
58.9% (86)Foreign-born:
23.1% (151)
Asian - Speak another language Native:
41.2% (60)Foreign-born:
76.0% (496)
Other race - Speak only English Native:
16.2% (216)Foreign-born:
8.4% (187)
Other race - Speak another language Native:
83.8% (1,119)Foreign-born:
91.6% (2,040)
Two or more races - Speak only English Native:
35.1% (3,171)Foreign-born:
7.8% (1,011)
Two or more races - Speak another language Native:
64.4% (5,813)Foreign-born:
92.7% (12,057)
White alone - Speak only English Native:
85.1% (6,412)Foreign-born:
22.7% (253)
White alone - Speak another language Native:
15.4% (1,163)Foreign-born:
76.4% (854)
Hispanic or Latino - Speak only English Native:
23.8% (2,748)Foreign-born:
4.7% (747)
Hispanic or Latino - Speak another language Native:
76.5% (8,826)Foreign-born:
95.3% (15,051)
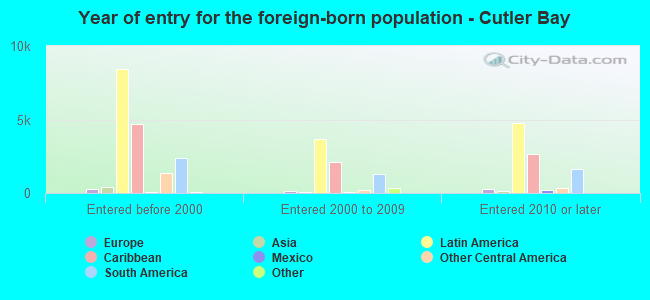
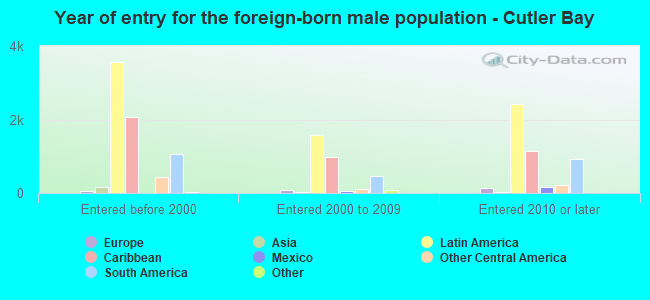
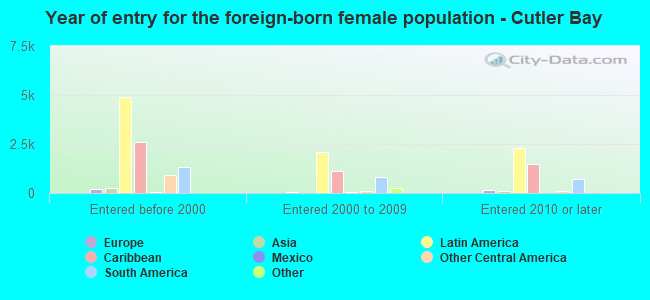
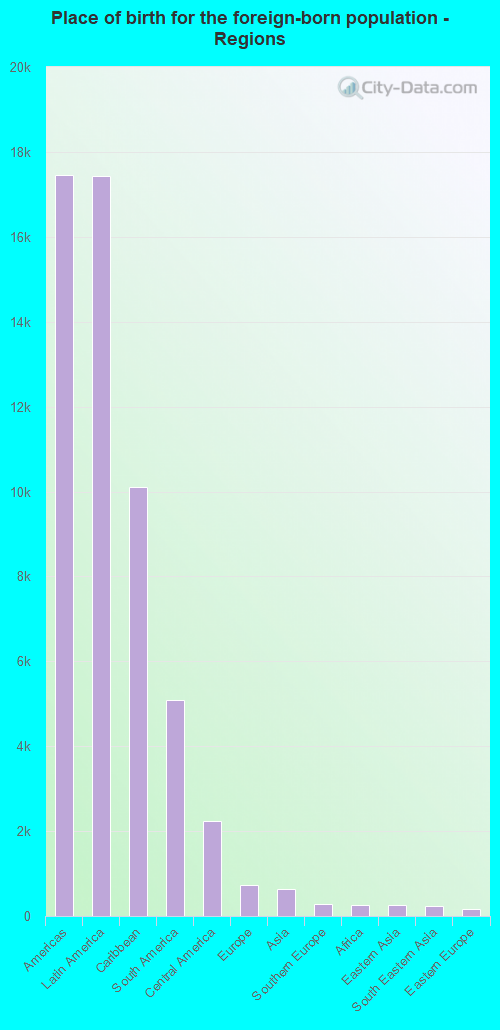
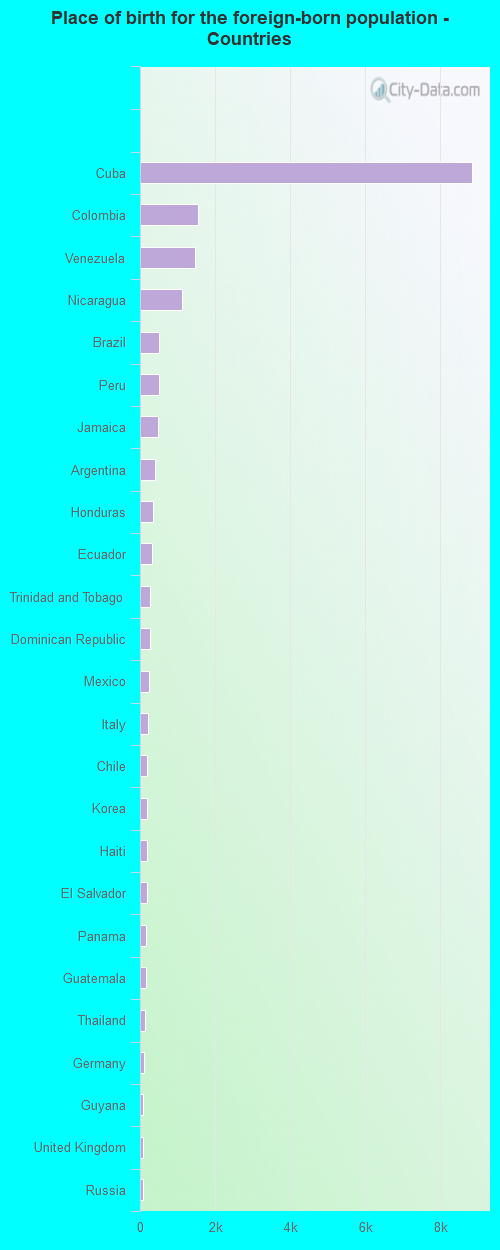
Foreign-born residents in Cutler Bay
Marital status for residents in Cutler Bay Marital status - White (Caucasian) population 15 years and over
Males 38.1% Never married51.6% Now married1.2% Separated1.1% Widowed7.9% DivorcedFemales 30.4% Never married40.9% Now married1.6% Separated10.5% Widowed16.5% DivorcedWomen who gave birth in the past 12 months Now married:
32.2% (21)Unmarried:
67.8% (45)
Women who did not give birth in the past 12 months Now married:
37.7% (1,151)Unmarried:
62.3% (1,904)
Marital status - Black or African American population 15 years and over
Males 34.5% Never married50.5% Now married6.0% Separated2.2% Widowed6.8% DivorcedFemales 40.4% Never married44.0% Now married3.9% Separated6.4% Widowed5.3% DivorcedWomen who gave birth in the past 12 months Now married:
66.1% (38)Unmarried:
33.9% (19)
Women who did not give birth in the past 12 months Now married:
48.5% (425)Unmarried:
51.5% (451)
Marital status - American Indian / Alaska Native population 15 years and over
Males 0.0% Never married100.0% Now married0.0% Separated0.0% Widowed0.0% DivorcedFemales 0.0% Never married100.0% Now married0.0% Separated0.0% Widowed0.0% DivorcedWomen who did not give birth in the past 12 months Now married:
100.0% (86)Unmarried:
0.0% (0)
Marital status - Asian population 15 years and over
Males 11.0% Never married74.0% Now married0.0% Separated4.0% Widowed11.0% DivorcedFemales 9.6% Never married61.2% Now married0.0% Separated8.0% Widowed21.1% DivorcedWomen who did not give birth in the past 12 months Now married:
43.2% (59)Unmarried:
56.8% (78)
Marital status - Other race population 15 years and over
Males 38.2% Never married47.8% Now married6.4% Separated1.9% Widowed5.7% DivorcedFemales 36.7% Never married43.6% Now married1.1% Separated0.9% Widowed17.6% DivorcedWomen who did not give birth in the past 12 months Now married:
39.4% (364)Unmarried:
60.6% (560)
Marital status - Two or more races population 15 years and over
Males 35.6% Never married51.0% Now married2.1% Separated1.4% Widowed10.0% DivorcedFemales 30.2% Never married43.7% Now married2.6% Separated9.8% Widowed13.7% DivorcedWomen who gave birth in the past 12 months Now married:
2.1% (5)Unmarried:
97.9% (223)
Women who did not give birth in the past 12 months Now married:
38.4% (2,022)Unmarried:
61.6% (3,240)
Marital status - White alone, not Hispanic / Latino population 15 years and over
Males 45.1% Never married44.0% Now married0.6% Separated1.8% Widowed8.5% DivorcedFemales 34.8% Never married39.6% Now married0.3% Separated12.1% Widowed13.2% DivorcedWomen who gave birth in the past 12 months Now married:
100.0% (7)Unmarried:
0.0% (0)
Women who did not give birth in the past 12 months Now married:
28.0% (532)Unmarried:
72.0% (1,370)
Marital status - Hispanic or Latino population 15 years and over
Males 32.6% Never married54.6% Now married2.7% Separated1.1% Widowed8.9% DivorcedFemales 28.1% Never married43.4% Now married2.4% Separated9.4% Widowed16.7% DivorcedWomen who gave birth in the past 12 months Now married:
13.6% (34)Unmarried:
86.4% (216)
Women who did not give birth in the past 12 months Now married:
42.5% (2,995)Unmarried:
57.5% (4,052)
Ancestries in Cutler Bay
1,454 5.3% American505 1.8% Italian441 1.6% Jamaican367 1.3% Irish318 1.2% German303 1.1% Brazilian228 0.8% English224 0.8% Haitian201 0.7% Russian199 0.7% Swedish186 0.7% Scottish153 0.6% Polish148 0.5% Eastern European146 0.5% Ethiopian126 0.5% Lebanese119 0.4% Guyanese111 0.4% Nigerian96 0.3% Trinidadian and Tobagonian86 0.3% Turkish79 0.3% European72 0.3% French55 0.2% Iranian47 0.2% Bulgarian39 0.1% British34 0.1% Norwegian26 0.09% Portuguese21 0.08% African19 0.07% Danish19 0.07% Arab15 0.05% Czech13 0.05% Slavic12 0.04% Scotch-Irish12 0.04% Moroccan11 0.04% French Canadian10 0.04% Welsh9 0.03% Dutch8 0.03% Canadian7 0.03% Lithuanian6 0.02% Celtic4 0.01% British West Indian4 0.01% Slovak3 0.01% Greek
Geographical mobility in Cutler Bay Same house 1 year ago 11,387 87.8% White (Caucasian)3,399 90.5% Black or African American111 100.0% American Indian / Alaska Native779 96.6% Asian3,288 90.0% Other race20,208 87.6% Two or more races8,160 88.6% White alone, not Hispanic / Latino25,147 88.2% Hispanic or LatinoMoved within same county 1,059 8.2% White / Caucasian147 3.9% Black or African American8 1.0% Asian214 5.9% Other race2,159 9.4% Two or more races848 9.2% White alone, not Hispanic / Latino2,276 8.0% Hispanic or LatinoMoved within same state 79 0.6% White / Caucasian112 3.0% Black or African American19 0.5% Other race74 0.3% Two or more races1 0.0% White alone, not Hispanic / Latino198 0.7% Hispanic or LatinoMoved from different state 282 2.2% White / Caucasian26 0.7% Black or African American47 5.8% Asian66 1.8% Other race90 0.4% Two or more races102 1.1% White alone, not Hispanic / Latino320 1.1% Hispanic or LatinoMoved from abroad 25 0.2% White79 2.1% Black or African American33 0.9% Other race167 0.7% Two or more races28 0.3% White alone, not Hispanic / Latino146 0.5% Hispanic or Latino
Children Nativity (place of birth) in Cutler Bay
Children under 6 years - Living with two parents Both parents native 575 99.5% Native3 0.5% Foreign-bornBoth parents foreign-born 359 100.0% NativeOne native, one foreign-born parent 517 96.5% Native19 3.5% Foreign-bornChildren under 6 years - Living with one parent Native parent 718 99.4% Native5 0.6% Foreign-bornForeign-born parent 367 78.7% Native100 21.3% Foreign-bornChildren 6 to 17 years - Living with two parents Both parents native 1,586 100.0% NativeBoth parents foreign-born 827 68.8% Native375 31.2% Foreign-bornOne native, one foreign-born parent 832 93.1% Native61 6.9% Foreign-bornChildren 6 to 17 years - Living with one parent Native parent 943 100.0% NativeForeign-born parent 1,865 54.1% Native1,585 45.9% Foreign-born
Grandparents responsible for own grandchildren in Cutler Bay
Grandparents (30 to 59 years) White / Caucasian 20 100.0% Not responsible for grandchildrenBlack or African American 28 100.0% Not responsible for grandchildrenOther race 15 100.0% Not responsible for grandchildrenTwo or more races 185 100.0% Not responsible for grandchildrenWhite alone, not Hispanic / Latino 2 100.0% Not responsible for grandchildrenHispanic or Latino 139 100.0% Not responsible for grandchildrenGrandparents (60 years and over) White / Caucasian 23 11.0% Responsible for grandchildren187 89.0% Not responsible for grandchildrenBlack or African American 29 100.0% Not responsible for grandchildrenOther race 35 100.0% Not responsible for grandchildrenTwo or more races 387 100.0% Not responsible for grandchildrenWhite alone, not Hispanic / Latino 10 100.0% Not responsible for grandchildrenHispanic or Latino 47 9.9% Responsible for grandchildren423 90.1% Not responsible for grandchildren