Races in Crystal, Nevada (NV) Detailed Stats
Ancestries, Foreign-born residents, place of birth
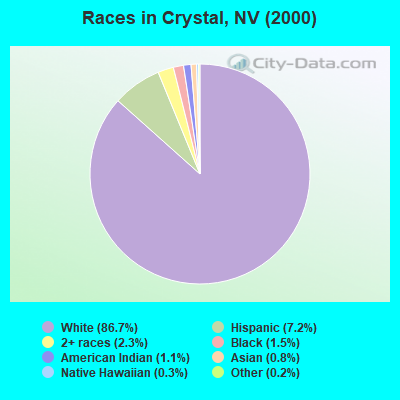
Race distribution in Crystal

- 6,18486.7%White alone
- 5127.2%Hispanic
- 1632.3%Two or more races
- 1071.5%Black alone
- 821.1%American Indian alone
- 560.8%Asian alone
- 200.3%Native Hawaiian and Other
Pacific Islander alone - 110.2%Other race alone
2000
2022
-
- 1,303,00165.2%White alone
- 393,97019.7%Hispanic
- 131,5096.6%Black alone
- 88,5934.4%Asian alone
- 49,2312.5%Two or more races
- 21,3971.1%American Indian alone
- 7,7690.4%Native Hawaiian and Other
Pacific Islander alone - 2,7870.1%Other race alone

-
- 1,410,14544.4%White alone
- 961,35730.3%Hispanic
- 286,4719.0%Black alone
- 281,1498.8%Asian alone
- 182,1515.7%Two or more races
- 20,1020.6%Native Hawaiian and Other
Pacific Islander alone - 18,7810.6%Other race alone
- 17,6160.6%American Indian alone

Income and house value in Crystal
- Median household income in 2022
- $55,743White non-Hispanic householders
- $43,101Black householders
- $83,003American Indian and Alaska Native householders
- $77,229Asian householders
- $105,321Some other race householders
- $63,864Two or more races householders
- $115,297Hispanic or Latino race householders
- Median 2022 house value
- $330,746White Non-Hispanic householders
- $328,755Black or African American householders
- $391,036American Indian or Alaska Native householders
- $319,939Asian householders
- $352,075Some other race householders
- $341,268Two or more races householders
- $331,883Hispanic or Latino householders
Household income for White non-Hispanic householders

Household income for Black householders

Household income for American Indian and Alaska Native householders

Household income for Asian householders

Household income for Native Hawaiian and other Pacific Islander householders

Household income for Two or more races householders

Household income for Hispanic or Latino race householders

Zip code: 89048