Races in Cranford, New Jersey (NJ) Detailed Stats
Ancestries, Foreign-born residents, place of birth

Recent posts about races in Cranford, New Jersey on our local forum with over 2,400,000 registered users:
 | Safety of a house in Cranford? (14 replies) |
| What are you favorite ethnic european restaurants (38 replies) |
| Cranford/Scotch Plains/Kenilworth house hunt (43 replies) |
| Cranford vs Westfield (10 replies) |
| Cranford freight line??? HELP!! Offer on a house? (11 replies) |
| House hunting Westfield/Cranford (10 replies) |
8.7% of Cranford, NJ residents are foreign-born (4.8% born in Europe, 1.8% born in Latin America, 1.7% born in Asia), which is 164.3% less than the foreign-born rate of 23.0% across the entire state of New Jersey.
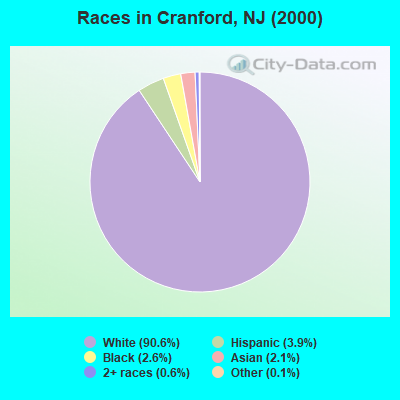
Race distribution in Cranford

- 20,46490.6%White alone
- 8793.9%Hispanic
- 5792.6%Black alone
- 4842.1%Asian alone
- 1380.6%Two or more races
- 240.1%Other race alone
- 50.02%American Indian alone
- 50.02%Native Hawaiian and Other
Pacific Islander alone
2000
2022
-
- 5,557,20966.0%White alone
- 1,117,19113.3%Hispanic
- 1,096,17113.0%Black alone
- 477,0125.7%Asian alone
- 133,6891.6%Two or more races
- 19,5650.2%Other race alone
- 11,3380.1%American Indian alone
- 2,1750.03%Native Hawaiian and Other
Pacific Islander alone

-
- 4,766,47651.5%White alone
- 2,028,47021.9%Hispanic
- 1,111,63212.0%Black alone
- 923,54610.0%Asian alone
- 332,2373.6%Two or more races
- 89,8471.0%Other race alone
- 8,5570.09%American Indian alone
- 9340.01%Native Hawaiian and Other
Pacific Islander alone

Income and house value in Cranford
- Median household income in 2022
- $154,926White non-Hispanic householders
- $80,514Black householders
- $189,930Asian householders
- $124,441Some other race householders
- over $200,000Two or more races householders
- $140,788Hispanic or Latino race householders
- Median 2022 house value
- $634,338White Non-Hispanic householders
- $459,767Black or African American householders
- $711,236Asian householders
- $469,480Some other race householders
- over $1,000,000Two or more races householders
- $572,550Hispanic or Latino householders
Household income for White non-Hispanic householders

Household income for Black householders

Household income for Asian householders

Household income for Two or more races householders

Household income for Hispanic or Latino race householders

Foreign-born residents in Cranford
1,965 residents are foreign born (4.8% Europe, 1.8% Latin America, 1.7% Asia).
| This city: | 8.7% |
| New Jersey: | 17.5% |
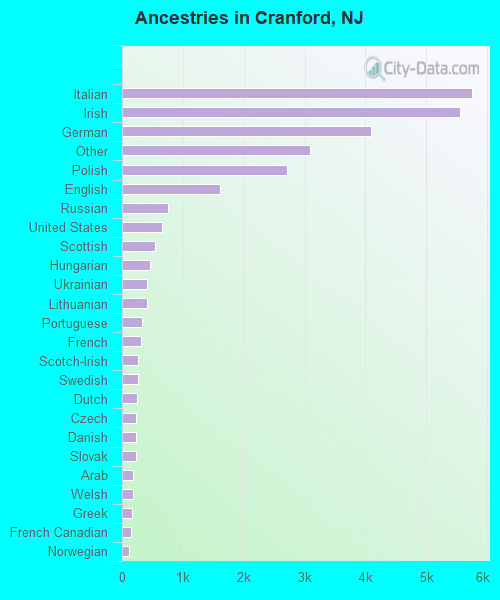
Ancestries in Cranford

- 5,74219.7%Italian
- 5,54919.1%Irish
- 4,09714.1%German
- 3,09110.6%Other
- 2,7059.3%Polish
- 1,6165.6%English
- 7502.6%Russian
- 6622.3%United States
- 5451.9%Scottish
- 4681.6%Hungarian
- 4121.4%Ukrainian
- 4061.4%Lithuanian
- 3261.1%Portuguese
- 3181.1%French
- 2690.9%Scotch-Irish
- 2600.9%Swedish
- 2540.9%Dutch
- 2320.8%Czech
- 2290.8%Danish
- 2230.8%Slovak
- 1860.6%Arab
- 1830.6%Welsh
- 1620.6%Greek
- 1450.5%French Canadian
- 1100.4%Norwegian
- 840.3%Swiss
- 420.1%West Indian
- 300.1%Subsaharan African
Zip codes: 07016.