Races in Covington, Georgia (GA) Detailed Stats
Data:
Races - White alone (%)
Races - White alone (% change since 2000)
Races - Black alone (%)
Races - Black alone (% change since 2000)
Races - American Indian alone (%)
Races - American Indian alone (% change since 2000)
Races - Asian alone (%)
Races - Asian alone (% change since 2000)
Races - Hispanic (%)
Races - Hispanic (% change since 2000)
Races - Native Hawaiian and Other Pacific Islander alone (%)
Races - Native Hawaiian and Other Pacific Islander alone (% change since 2000)
Races - Two or more races(%)
Races - Two or more races(% change since 2000)
Races - Other race alone (%)
Races - Other race alone (% change since 2000)
Racial diversity
Place of birth - Born in state of residence (%)
Place of birth - Born in state of residence (%) - White
Place of birth - Born in state of residence (%) - Black or African American
Place of birth - Born in state of residence (%) - Asian
Place of birth - Born in state of residence (%) - Hispanic or Latino
Place of birth - Born in state of residence (%) - American Indian and Alaska Native
Place of birth - Born in state of residence (%) - Multirace
Place of birth - Born in state of residence (%) - Other Race
Place of birth - Born in other state (%)
Place of birth - Born in other state (%) - White
Place of birth - Born in other state (%) - Black or African American
Place of birth - Born in other state (%) - Asian
Place of birth - Born in other state (%) - Hispanic or Latino
Place of birth - Born in other state (%) - American Indian and Alaska Native
Place of birth - Born in other state (%) - Multirace
Place of birth - Born in other state (%) - Other Race
Place of birth - Native, outside of US (%)
Place of birth - Native, outside of US (%) - White
Place of birth - Native, outside of US (%) - Black or African American
Place of birth - Native, outside of US (%) - Asian
Place of birth - Native, outside of US (%) - Hispanic or Latino
Place of birth - Native, outside of US (%) - American Indian and Alaska Native
Place of birth - Native, outside of US (%) - Multirace
Place of birth - Native, outside of US (%) - Other Race
Place of birth - Foreign born (%)
Place of birth - Foreign born (%) - White
Place of birth - Foreign born (%) - Black or African American
Place of birth - Foreign born (%) - Asian
Place of birth - Foreign born (%) - Hispanic or Latino
Place of birth - Foreign born (%) - American Indian and Alaska Native
Place of birth - Foreign born (%) - Multirace
Place of birth - Foreign born (%) - Other Race
Residents speaking English at home (%)
Residents speaking English at home - Born in the United States (%)
Residents speaking English at home - Native, born elsewhere (%)
Residents speaking English at home - Foreign born (%)
Residents speaking Spanish at home (%)
Residents speaking Spanish at home - Born in the United States (%)
Residents speaking Spanish at home - Native, born elsewhere (%)
Residents speaking Spanish at home - Foreign born (%)
Residents speaking other language at home (%)
Residents speaking other language at home - Born in the United States (%)
Residents speaking other language at home - Native, born elsewhere (%)
Residents speaking other language at home - Foreign born (%)
Marital status - Never married (%)
Marital status - Now married (%)
Marital status - Separated (%)
Marital status - Widowed (%)
Marital status - Divorced (%)
Ancestries Reported - Arab (%)
Ancestries Reported - Czech (%)
Ancestries Reported - Danish (%)
Ancestries Reported - Dutch (%)
Ancestries Reported - English (%)
Ancestries Reported - French (%)
Ancestries Reported - French Canadian (%)
Ancestries Reported - German (%)
Ancestries Reported - Greek (%)
Ancestries Reported - Hungarian (%)
Ancestries Reported - Irish (%)
Ancestries Reported - Italian (%)
Ancestries Reported - Lithuanian (%)
Ancestries Reported - Norwegian (%)
Ancestries Reported - Polish (%)
Ancestries Reported - Portuguese (%)
Ancestries Reported - Russian (%)
Ancestries Reported - Scotch-Irish (%)
Ancestries Reported - Scottish (%)
Ancestries Reported - Slovak (%)
Ancestries Reported - Subsaharan African (%)
Ancestries Reported - Swedish (%)
Ancestries Reported - Swiss (%)
Ancestries Reported - Ukrainian (%)
Ancestries Reported - United States (%)
Ancestries Reported - Welsh (%)
Ancestries Reported - West Indian (%)
Ancestries Reported - Other (%)
Geographical mobility - Same house 1 year ago (%)
Geographical mobility - Same house 1 year ago (%) - White
Geographical mobility - Same house 1 year ago (%) - Black or African American
Geographical mobility - Same house 1 year ago (%) - Asian
Geographical mobility - Same house 1 year ago (%) - Hispanic or Latino
Geographical mobility - Same house 1 year ago (%) - American Indian and Alaska Native
Geographical mobility - Same house 1 year ago (%) - Multirace
Geographical mobility - Same house 1 year ago (%) - Other Race
Geographical mobility - Moved within same county (%)
Geographical mobility - Moved within same county (%) - White
Geographical mobility - Moved within same county (%) - Black or African American
Geographical mobility - Moved within same county (%) - Asian
Geographical mobility - Moved within same county (%) - Hispanic or Latino
Geographical mobility - Moved within same county (%) - American Indian and Alaska Native
Geographical mobility - Moved within same county (%) - Multirace
Geographical mobility - Moved within same county (%) - Other Race
Geographical mobility - Moved from different county within same state (%)
Geographical mobility - Moved from different county within same state (%) - White
Geographical mobility - Moved from different county within same state (%) - Black or African American
Geographical mobility - Moved from different county within same state (%) - Asian
Geographical mobility - Moved from different county within same state (%) - Hispanic or Latino
Geographical mobility - Moved from different county within same state (%) - American Indian and Alaska Native
Geographical mobility - Moved from different county within same state (%) - Multirace
Geographical mobility - Moved from different county within same state (%) - Other Race
Geographical mobility - Moved from different state (%)
Geographical mobility - Moved from different state (%) - White
Geographical mobility - Moved from different state (%) - Black or African American
Geographical mobility - Moved from different state (%) - Asian
Geographical mobility - Moved from different state (%) - Hispanic or Latino
Geographical mobility - Moved from different state (%) - American Indian and Alaska Native
Geographical mobility - Moved from different state (%) - Multirace
Geographical mobility - Moved from different state (%) - Other Race
Geographical mobility - Moved from abroad (%)
Geographical mobility - Moved from abroad (%) - White
Geographical mobility - Moved from abroad (%) - Black or African American
Geographical mobility - Moved from abroad (%) - Asian
Geographical mobility - Moved from abroad (%) - Hispanic or Latino
Geographical mobility - Moved from abroad (%) - American Indian and Alaska Native
Geographical mobility - Moved from abroad (%) - Multirace
Geographical mobility - Moved from abroad (%) - Other Race
Place of birth for the foreign-born population - Ireland (%)
Place of birth for the foreign-born population - Denmark (%)
Place of birth for the foreign-born population - Norway (%)
Place of birth for the foreign-born population - Sweden (%)
Place of birth for the foreign-born population - United Kingdom (%)
Place of birth for the foreign-born population - England (%)
Place of birth for the foreign-born population - Scotland (%)
Place of birth for the foreign-born population - Other Northern Europe (%)
Place of birth for the foreign-born population - Austria (%)
Place of birth for the foreign-born population - Belgium (%)
Place of birth for the foreign-born population - France (%)
Place of birth for the foreign-born population - Germany (%)
Place of birth for the foreign-born population - Netherlands (%)
Place of birth for the foreign-born population - Switzerland (%)
Place of birth for the foreign-born population - Other Western Europe (%)
Place of birth for the foreign-born population - Greece (%)
Place of birth for the foreign-born population - Italy (%)
Place of birth for the foreign-born population - Portugal (%)
Place of birth for the foreign-born population - Spain (%)
Place of birth for the foreign-born population - Other Southern Europe (%)
Place of birth for the foreign-born population - Albania (%)
Place of birth for the foreign-born population - Belarus (%)
Place of birth for the foreign-born population - Bosnia and Herzegovina (%)
Place of birth for the foreign-born population - Bulgaria (%)
Place of birth for the foreign-born population - Croatia (%)
Place of birth for the foreign-born population - Czechoslovakia (%)
Place of birth for the foreign-born population - Hungary (%)
Place of birth for the foreign-born population - Latvia (%)
Place of birth for the foreign-born population - Lithuania (%)
Place of birth for the foreign-born population - North Macedonia (Macedonia) (%)
Place of birth for the foreign-born population - Moldova (%)
Place of birth for the foreign-born population - Poland (%)
Place of birth for the foreign-born population - Romania (%)
Place of birth for the foreign-born population - Russia (%)
Place of birth for the foreign-born population - Serbia (%)
Place of birth for the foreign-born population - Ukraine (%)
Place of birth for the foreign-born population - Other Eastern Europe (%)
Place of birth for the foreign-born population - China (%)
Place of birth for the foreign-born population - Hong Kong (%)
Place of birth for the foreign-born population - Taiwan (%)
Place of birth for the foreign-born population - Japan (%)
Place of birth for the foreign-born population - Korea (%)
Place of birth for the foreign-born population - Other Eastern Asia (%)
Place of birth for the foreign-born population - Afghanistan (%)
Place of birth for the foreign-born population - Bangladesh (%)
Place of birth for the foreign-born population - India (%)
Place of birth for the foreign-born population - Iran (%)
Place of birth for the foreign-born population - Kazakhstan (%)
Place of birth for the foreign-born population - Nepal (%)
Place of birth for the foreign-born population - Pakistan (%)
Place of birth for the foreign-born population - Sri Lanka (%)
Place of birth for the foreign-born population - Uzbekistan (%)
Place of birth for the foreign-born population - Other South Central Asia (%)
Place of birth for the foreign-born population - Burma (%)
Place of birth for the foreign-born population - Cambodia (%)
Place of birth for the foreign-born population - Indonesia (%)
Place of birth for the foreign-born population - Laos (%)
Place of birth for the foreign-born population - Malaysia (%)
Place of birth for the foreign-born population - Philippines (%)
Place of birth for the foreign-born population - Singapore (%)
Place of birth for the foreign-born population - Thailand (%)
Place of birth for the foreign-born population - Vietnam (%)
Place of birth for the foreign-born population - Other South Eastern Asia (%)
Place of birth for the foreign-born population - Armenia (%)
Place of birth for the foreign-born population - Iraq (%)
Place of birth for the foreign-born population - Israel (%)
Place of birth for the foreign-born population - Jordan (%)
Place of birth for the foreign-born population - Kuwait (%)
Place of birth for the foreign-born population - Lebanon (%)
Place of birth for the foreign-born population - Saudi Arabia (%)
Place of birth for the foreign-born population - Syria (%)
Place of birth for the foreign-born population - Turkey (%)
Place of birth for the foreign-born population - Yemen (%)
Place of birth for the foreign-born population - Other Western Asia (%)
Place of birth for the foreign-born population - Eritrea (%)
Place of birth for the foreign-born population - Ethiopia (%)
Place of birth for the foreign-born population - Kenya (%)
Place of birth for the foreign-born population - Somalia (%)
Place of birth for the foreign-born population - Uganda (%)
Place of birth for the foreign-born population - Zimbabwe (%)
Place of birth for the foreign-born population - Other Eastern Africa (%)
Place of birth for the foreign-born population - Cameroon (%)
Place of birth for the foreign-born population - Congo (%)
Place of birth for the foreign-born population - Democratic Republic of Congo (Zaire) (%)
Place of birth for the foreign-born population - Other Middle Africa (%)
Place of birth for the foreign-born population - Egypt (%)
Place of birth for the foreign-born population - Morocco (%)
Place of birth for the foreign-born population - Sudan (%)
Place of birth for the foreign-born population - Other Northern Africa (%)
Place of birth for the foreign-born population - South Africa (%)
Place of birth for the foreign-born population - Other Southern Africa (%)
Place of birth for the foreign-born population - Cabo Verde (%)
Place of birth for the foreign-born population - Ghana (%)
Place of birth for the foreign-born population - Liberia (%)
Place of birth for the foreign-born population - Nigeria (%)
Place of birth for the foreign-born population - Senegal (%)
Place of birth for the foreign-born population - Sierra Leone (%)
Place of birth for the foreign-born population - Other Western Africa (%)
Place of birth for the foreign-born population - Australia (%)
Place of birth for the foreign-born population - New Zealand (%)
Place of birth for the foreign-born population - Fiji (%)
Place of birth for the foreign-born population - Micronesia (%)
Place of birth for the foreign-born population - Bahamas (%)
Place of birth for the foreign-born population - Barbados (%)
Place of birth for the foreign-born population - Cuba (%)
Place of birth for the foreign-born population - Dominica (%)
Place of birth for the foreign-born population - Dominican Republic (%)
Place of birth for the foreign-born population - Grenada (%)
Place of birth for the foreign-born population - Haiti (%)
Place of birth for the foreign-born population - Jamaica (%)
Place of birth for the foreign-born population - St. Vincent and the Grenadines (%)
Place of birth for the foreign-born population - Trinidad and Tobago (%)
Place of birth for the foreign-born population - West Indies (%)
Place of birth for the foreign-born population - Other Caribbean (%)
Place of birth for the foreign-born population - Belize (%)
Place of birth for the foreign-born population - Costa Rica (%)
Place of birth for the foreign-born population - El Salvador (%)
Place of birth for the foreign-born population - Guatemala (%)
Place of birth for the foreign-born population - Honduras (%)
Place of birth for the foreign-born population - Mexico (%)
Place of birth for the foreign-born population - Nicaragua (%)
Place of birth for the foreign-born population - Panama (%)
Place of birth for the foreign-born population - Other Central America (%)
Place of birth for the foreign-born population - Argentina (%)
Place of birth for the foreign-born population - Bolivia (%)
Place of birth for the foreign-born population - Brazil (%)
Place of birth for the foreign-born population - Chile (%)
Place of birth for the foreign-born population - Colombia (%)
Place of birth for the foreign-born population - Ecuador (%)
Place of birth for the foreign-born population - Guyana (%)
Place of birth for the foreign-born population - Peru (%)
Place of birth for the foreign-born population - Uruguay (%)
Place of birth for the foreign-born population - Venezuela (%)
Place of birth for the foreign-born population - Other South America (%)
Place of birth for the foreign-born population - Canada (%)
Place of birth for the foreign-born population - Other Northern America (%)
Place of birth for the foreign-born population - Other (%)
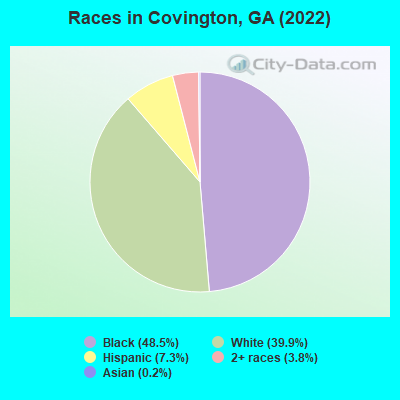
According to 2022 data, the most numerous races in Covington, GA are White alone (5,757 residents), Black alone (6,998 residents), and Hispanic (1,058 residents). 92.0% of Covington residents speak English at home. 4.5% of Covington, GA residents are foreign-born (3.2% born in Latin America, 1.1% born in Europe), which is 122.9% less than the foreign-born rate of 10.0% across the entire state of Georgia.
Race distribution in Covington
2000 2022
5,128,661 62.6% White alone 2,331,465 28.5% Black alone 435,227 5.3% Hispanic 171,513 2.1% Asian alone 87,364 1.1% Two or more races 17,670 0.2% American Indian alone 11,275 0.1% Other race alone 3,278 0.04% Native Hawaiian and Other
5,415,657 49.6% White alone 3,349,240 30.7% Black alone 1,132,604 10.4% Hispanic 479,156 4.4% Asian alone 462,923 4.2% Two or more races 54,416 0.5% Other race alone 11,923 0.1% American Indian alone 6,957 0.06% Native Hawaiian and Other
Income and house value in Covington Median household income in 2022 $71,734 White non-Hispanic householders$37,026 Black householders$143,868 Some other race householders$30,485 Two or more races householders$102,161 Hispanic or Latino race householdersMedian 2022 house value $342,673 White Non-Hispanic householders$249,454 Black or African American householders $512,704 Asian householders$167,794 Two or more races householders$455,281 Hispanic or Latino householders
Median age by race in Covington
44.9 Median age for White residents42.7 48.3 35.3 Median age for Black or African American residents29.9 36.4 -666,666,666.0 Median age for American Indian / Alaska Native residents-666,666,666.0 -666,666,666.0 -971,014,491.8 Median age for Asian residents-696,491,227.4 -637,254,901.3 -666,666,666.0 Median age for Native Hawaiian / Pacific Islander residents-666,666,666.0 -666,666,666.0 38.0 Median age for Other race residents24.4 42.3 35.4 Median age for Two or more races residents18.9 36.6 47.3 Median age for White alone residents43.0 48.2 32.7 Median age for Hispanic or Latino residents22.5 47.3
Owner/renter occupied households by race in Covington
House owners and renters - White residents 1,514 62.7% Owner occupied903 37.3% Renter occupiedHouse owners and renters - Black or African American residents 936 40.8% Owner occupied1,360 59.2% Renter occupiedHouse owners and renters - Asian residents 26 100.0% Renter occupiedHouse owners and renters - Other race residents 14 12.6% Owner occupied96 87.4% Renter occupiedHouse owners and renters - Two or more races residents 71 26.2% Owner occupied200 73.8% Renter occupiedHouse owners and renters - White alone residents 1,502 62.6% Owner occupied897 37.4% Renter occupiedHouse owners and renters - Hispanic or Latino residents 92 30.8% Owner occupied208 69.2% Renter occupied
Language usage in Covington
English speakers - Total 92.0% of residents of Covington speak English at home.
8.0% of residents speak Spanish at home 865 78.2% Speak English very well241 21.8% Speak English less than very well0.9% of residents speak other language at home 38 31.4% Speak English very well83 68.6% Speak English less than very well
English speakers - Born in the United States 92.5% of residents of Covington speak English at home.
11.0% of residents speak Spanish at home 401 100.0% Speak English very well1.3% of residents speak other language at home 18 36.7% Speak English very well31 63.3% Speak English less than very well
English speakers - Native, born elsewhere 86.6% of residents of Covington speak English at home.
6.1% of residents speak Spanish at home 29 100.0% Speak English less than very well6.3% of residents speak other language at home 30 100.0% Speak English very well
English speakers - Foreign-born 57.7% of residents of Covington speak English at home.
34.0% of residents speak Spanish at home 57 23.7% Speak English very well184 76.3% Speak English less than very well10.0% of residents speak other language at home 5 7.0% Speak English very well66 93.0% Speak English less than very well
White (Caucasian) - Speak only English Native:
98.7% (5,184)Foreign-born:
87.1% (123)
White (Caucasian) - Speak another language Native:
1.8% (94)Foreign-born:
31.2% (44)
Black or African American - Speak only English Native:
99.3% (6,450)Foreign-born:
68.3% (149)
Black or African American - Speak another language Native:
0.5% (35)Foreign-born:
30.7% (67)
Other race - Speak another language Native:
100.0% (623)Foreign-born:
100.0% (217)
Two or more races - Speak only English Native:
87.8% (581)Foreign-born:
28.6% (17)
Two or more races - Speak another language Native:
12.5% (83)Foreign-born:
72.1% (43)
White alone - Speak only English Native:
99.1% (5,206)Foreign-born:
100.0% (135)
Hispanic or Latino - Speak only English Native:
15.2% (109)Foreign-born:
13.4% (43)
Hispanic or Latino - Speak another language Native:
92.7% (664)Foreign-born:
89.8% (292)
Foreign-born residents in Covington 661 residents are foreign born (3.2% Latin America , 1.1% Europe ).
This city:
4.5%Georgia:
10.4%
Marital status for residents in Covington Marital status - White (Caucasian) population 15 years and over
Males 30.2% Never married51.1% Now married0.0% Separated2.6% Widowed16.1% DivorcedFemales 18.2% Never married43.8% Now married0.2% Separated14.2% Widowed23.5% DivorcedWomen who gave birth in the past 12 months Now married:
37.3% (64)Unmarried:
62.7% (108)
Women who did not give birth in the past 12 months Now married:
56.1% (497)Unmarried:
43.9% (389)
Marital status - Black or African American population 15 years and over
Males 57.3% Never married31.9% Now married3.8% Separated1.0% Widowed6.1% DivorcedFemales 51.5% Never married23.9% Now married3.1% Separated9.6% Widowed11.9% DivorcedWomen who gave birth in the past 12 months Now married:
0.0% (0)Unmarried:
100.0% (41)
Women who did not give birth in the past 12 months Now married:
28.6% (571)Unmarried:
71.4% (1,424)
Marital status - Other race population 15 years and over
Males 66.3% Never married28.8% Now married0.0% Separated4.8% Widowed0.0% DivorcedFemales 30.4% Never married33.9% Now married35.7% Separated0.0% Widowed0.0% DivorcedWomen who did not give birth in the past 12 months Now married:
69.6% (207)Unmarried:
30.4% (91)
Marital status - Two or more races population 15 years and over
Males 72.6% Never married20.0% Now married0.0% Separated0.0% Widowed7.4% DivorcedFemales 37.1% Never married42.2% Now married0.0% Separated0.0% Widowed20.6% DivorcedWomen who did not give birth in the past 12 months Now married:
35.3% (117)Unmarried:
64.7% (215)
Marital status - White alone, not Hispanic / Latino population 15 years and over
Males 28.5% Never married52.3% Now married0.0% Separated2.7% Widowed16.4% DivorcedFemales 17.4% Never married43.9% Now married0.3% Separated13.8% Widowed24.6% DivorcedWomen who gave birth in the past 12 months Now married:
37.3% (67)Unmarried:
62.7% (113)
Women who did not give birth in the past 12 months Now married:
56.2% (475)Unmarried:
43.8% (371)
Marital status - Hispanic or Latino population 15 years and over
Males 69.4% Never married27.6% Now married0.0% Separated3.0% Widowed0.0% DivorcedFemales 32.9% Never married45.8% Now married16.3% Separated5.0% Widowed0.0% DivorcedWomen who did not give birth in the past 12 months Now married:
61.0% (280)Unmarried:
39.0% (179)
Ancestries in Covington
1,373 15.9% American727 8.4% English376 4.3% European164 1.9% Irish156 1.8% German93 1.1% Jamaican65 0.8% Scotch-Irish62 0.7% African51 0.6% Danish46 0.5% Scottish42 0.5% Polish36 0.4% British27 0.3% Trinidadian and Tobagonian26 0.3% West Indian21 0.2% Welsh19 0.2% Belizean18 0.2% Swedish18 0.2% Barbadian15 0.2% Ukrainian7 0.08% French6 0.07% French Canadian6 0.07% Italian5 0.06% Lithuanian3 0.03% Bulgarian1 0.01% Ugandan
Children Nativity (place of birth) in Covington
Children under 6 years - Living with two parents Both parents native 349 100.0% NativeOne native, one foreign-born parent 25 100.0% NativeChildren under 6 years - Living with one parent Native parent 568 100.0% Native
Children 6 to 17 years - Living with two parents Both parents native 637 100.0% NativeBoth parents foreign-born 25 100.0% NativeOne native, one foreign-born parent 173 100.0% NativeChildren 6 to 17 years - Living with one parent Native parent 1,464 100.0% Native
Grandparents responsible for own grandchildren in Covington
Grandparents (30 to 59 years) White / Caucasian 28 70.7% Responsible for grandchildren12 29.3% Not responsible for grandchildrenBlack or African American 23 32.5% Responsible for grandchildren48 67.5% Not responsible for grandchildrenWhite alone, not Hispanic / Latino 16 72.2% Responsible for grandchildren6 27.8% Not responsible for grandchildrenHispanic or Latino 22 65.0% Responsible for grandchildren12 35.0% Not responsible for grandchildrenGrandparents (60 years and over) White / Caucasian 32 25.6% Responsible for grandchildren92 74.4% Not responsible for grandchildrenBlack or African American 53 100.0% Responsible for grandchildrenWhite alone, not Hispanic / Latino 32 23.6% Responsible for grandchildren103 76.4% Not responsible for grandchildren