Races in Cooper City, Florida (FL) Detailed Stats
Data:
Races - White alone (%)
Races - White alone (% change since 2000)
Races - Black alone (%)
Races - Black alone (% change since 2000)
Races - American Indian alone (%)
Races - American Indian alone (% change since 2000)
Races - Asian alone (%)
Races - Asian alone (% change since 2000)
Races - Hispanic (%)
Races - Hispanic (% change since 2000)
Races - Native Hawaiian and Other Pacific Islander alone (%)
Races - Native Hawaiian and Other Pacific Islander alone (% change since 2000)
Races - Two or more races(%)
Races - Two or more races(% change since 2000)
Races - Other race alone (%)
Races - Other race alone (% change since 2000)
Racial diversity
Place of birth - Born in state of residence (%)
Place of birth - Born in state of residence (%) - White
Place of birth - Born in state of residence (%) - Black or African American
Place of birth - Born in state of residence (%) - Asian
Place of birth - Born in state of residence (%) - Hispanic or Latino
Place of birth - Born in state of residence (%) - American Indian and Alaska Native
Place of birth - Born in state of residence (%) - Multirace
Place of birth - Born in state of residence (%) - Other Race
Place of birth - Born in other state (%)
Place of birth - Born in other state (%) - White
Place of birth - Born in other state (%) - Black or African American
Place of birth - Born in other state (%) - Asian
Place of birth - Born in other state (%) - Hispanic or Latino
Place of birth - Born in other state (%) - American Indian and Alaska Native
Place of birth - Born in other state (%) - Multirace
Place of birth - Born in other state (%) - Other Race
Place of birth - Native, outside of US (%)
Place of birth - Native, outside of US (%) - White
Place of birth - Native, outside of US (%) - Black or African American
Place of birth - Native, outside of US (%) - Asian
Place of birth - Native, outside of US (%) - Hispanic or Latino
Place of birth - Native, outside of US (%) - American Indian and Alaska Native
Place of birth - Native, outside of US (%) - Multirace
Place of birth - Native, outside of US (%) - Other Race
Place of birth - Foreign born (%)
Place of birth - Foreign born (%) - White
Place of birth - Foreign born (%) - Black or African American
Place of birth - Foreign born (%) - Asian
Place of birth - Foreign born (%) - Hispanic or Latino
Place of birth - Foreign born (%) - American Indian and Alaska Native
Place of birth - Foreign born (%) - Multirace
Place of birth - Foreign born (%) - Other Race
Residents speaking English at home (%)
Residents speaking English at home - Born in the United States (%)
Residents speaking English at home - Native, born elsewhere (%)
Residents speaking English at home - Foreign born (%)
Residents speaking Spanish at home (%)
Residents speaking Spanish at home - Born in the United States (%)
Residents speaking Spanish at home - Native, born elsewhere (%)
Residents speaking Spanish at home - Foreign born (%)
Residents speaking other language at home (%)
Residents speaking other language at home - Born in the United States (%)
Residents speaking other language at home - Native, born elsewhere (%)
Residents speaking other language at home - Foreign born (%)
Marital status - Never married (%)
Marital status - Now married (%)
Marital status - Separated (%)
Marital status - Widowed (%)
Marital status - Divorced (%)
Ancestries Reported - Arab (%)
Ancestries Reported - Czech (%)
Ancestries Reported - Danish (%)
Ancestries Reported - Dutch (%)
Ancestries Reported - English (%)
Ancestries Reported - French (%)
Ancestries Reported - French Canadian (%)
Ancestries Reported - German (%)
Ancestries Reported - Greek (%)
Ancestries Reported - Hungarian (%)
Ancestries Reported - Irish (%)
Ancestries Reported - Italian (%)
Ancestries Reported - Lithuanian (%)
Ancestries Reported - Norwegian (%)
Ancestries Reported - Polish (%)
Ancestries Reported - Portuguese (%)
Ancestries Reported - Russian (%)
Ancestries Reported - Scotch-Irish (%)
Ancestries Reported - Scottish (%)
Ancestries Reported - Slovak (%)
Ancestries Reported - Subsaharan African (%)
Ancestries Reported - Swedish (%)
Ancestries Reported - Swiss (%)
Ancestries Reported - Ukrainian (%)
Ancestries Reported - United States (%)
Ancestries Reported - Welsh (%)
Ancestries Reported - West Indian (%)
Ancestries Reported - Other (%)
Geographical mobility - Same house 1 year ago (%)
Geographical mobility - Same house 1 year ago (%) - White
Geographical mobility - Same house 1 year ago (%) - Black or African American
Geographical mobility - Same house 1 year ago (%) - Asian
Geographical mobility - Same house 1 year ago (%) - Hispanic or Latino
Geographical mobility - Same house 1 year ago (%) - American Indian and Alaska Native
Geographical mobility - Same house 1 year ago (%) - Multirace
Geographical mobility - Same house 1 year ago (%) - Other Race
Geographical mobility - Moved within same county (%)
Geographical mobility - Moved within same county (%) - White
Geographical mobility - Moved within same county (%) - Black or African American
Geographical mobility - Moved within same county (%) - Asian
Geographical mobility - Moved within same county (%) - Hispanic or Latino
Geographical mobility - Moved within same county (%) - American Indian and Alaska Native
Geographical mobility - Moved within same county (%) - Multirace
Geographical mobility - Moved within same county (%) - Other Race
Geographical mobility - Moved from different county within same state (%)
Geographical mobility - Moved from different county within same state (%) - White
Geographical mobility - Moved from different county within same state (%) - Black or African American
Geographical mobility - Moved from different county within same state (%) - Asian
Geographical mobility - Moved from different county within same state (%) - Hispanic or Latino
Geographical mobility - Moved from different county within same state (%) - American Indian and Alaska Native
Geographical mobility - Moved from different county within same state (%) - Multirace
Geographical mobility - Moved from different county within same state (%) - Other Race
Geographical mobility - Moved from different state (%)
Geographical mobility - Moved from different state (%) - White
Geographical mobility - Moved from different state (%) - Black or African American
Geographical mobility - Moved from different state (%) - Asian
Geographical mobility - Moved from different state (%) - Hispanic or Latino
Geographical mobility - Moved from different state (%) - American Indian and Alaska Native
Geographical mobility - Moved from different state (%) - Multirace
Geographical mobility - Moved from different state (%) - Other Race
Geographical mobility - Moved from abroad (%)
Geographical mobility - Moved from abroad (%) - White
Geographical mobility - Moved from abroad (%) - Black or African American
Geographical mobility - Moved from abroad (%) - Asian
Geographical mobility - Moved from abroad (%) - Hispanic or Latino
Geographical mobility - Moved from abroad (%) - American Indian and Alaska Native
Geographical mobility - Moved from abroad (%) - Multirace
Geographical mobility - Moved from abroad (%) - Other Race
Place of birth for the foreign-born population - Ireland (%)
Place of birth for the foreign-born population - Denmark (%)
Place of birth for the foreign-born population - Norway (%)
Place of birth for the foreign-born population - Sweden (%)
Place of birth for the foreign-born population - United Kingdom (%)
Place of birth for the foreign-born population - England (%)
Place of birth for the foreign-born population - Scotland (%)
Place of birth for the foreign-born population - Other Northern Europe (%)
Place of birth for the foreign-born population - Austria (%)
Place of birth for the foreign-born population - Belgium (%)
Place of birth for the foreign-born population - France (%)
Place of birth for the foreign-born population - Germany (%)
Place of birth for the foreign-born population - Netherlands (%)
Place of birth for the foreign-born population - Switzerland (%)
Place of birth for the foreign-born population - Other Western Europe (%)
Place of birth for the foreign-born population - Greece (%)
Place of birth for the foreign-born population - Italy (%)
Place of birth for the foreign-born population - Portugal (%)
Place of birth for the foreign-born population - Spain (%)
Place of birth for the foreign-born population - Other Southern Europe (%)
Place of birth for the foreign-born population - Albania (%)
Place of birth for the foreign-born population - Belarus (%)
Place of birth for the foreign-born population - Bosnia and Herzegovina (%)
Place of birth for the foreign-born population - Bulgaria (%)
Place of birth for the foreign-born population - Croatia (%)
Place of birth for the foreign-born population - Czechoslovakia (%)
Place of birth for the foreign-born population - Hungary (%)
Place of birth for the foreign-born population - Latvia (%)
Place of birth for the foreign-born population - Lithuania (%)
Place of birth for the foreign-born population - North Macedonia (Macedonia) (%)
Place of birth for the foreign-born population - Moldova (%)
Place of birth for the foreign-born population - Poland (%)
Place of birth for the foreign-born population - Romania (%)
Place of birth for the foreign-born population - Russia (%)
Place of birth for the foreign-born population - Serbia (%)
Place of birth for the foreign-born population - Ukraine (%)
Place of birth for the foreign-born population - Other Eastern Europe (%)
Place of birth for the foreign-born population - China (%)
Place of birth for the foreign-born population - Hong Kong (%)
Place of birth for the foreign-born population - Taiwan (%)
Place of birth for the foreign-born population - Japan (%)
Place of birth for the foreign-born population - Korea (%)
Place of birth for the foreign-born population - Other Eastern Asia (%)
Place of birth for the foreign-born population - Afghanistan (%)
Place of birth for the foreign-born population - Bangladesh (%)
Place of birth for the foreign-born population - India (%)
Place of birth for the foreign-born population - Iran (%)
Place of birth for the foreign-born population - Kazakhstan (%)
Place of birth for the foreign-born population - Nepal (%)
Place of birth for the foreign-born population - Pakistan (%)
Place of birth for the foreign-born population - Sri Lanka (%)
Place of birth for the foreign-born population - Uzbekistan (%)
Place of birth for the foreign-born population - Other South Central Asia (%)
Place of birth for the foreign-born population - Burma (%)
Place of birth for the foreign-born population - Cambodia (%)
Place of birth for the foreign-born population - Indonesia (%)
Place of birth for the foreign-born population - Laos (%)
Place of birth for the foreign-born population - Malaysia (%)
Place of birth for the foreign-born population - Philippines (%)
Place of birth for the foreign-born population - Singapore (%)
Place of birth for the foreign-born population - Thailand (%)
Place of birth for the foreign-born population - Vietnam (%)
Place of birth for the foreign-born population - Other South Eastern Asia (%)
Place of birth for the foreign-born population - Armenia (%)
Place of birth for the foreign-born population - Iraq (%)
Place of birth for the foreign-born population - Israel (%)
Place of birth for the foreign-born population - Jordan (%)
Place of birth for the foreign-born population - Kuwait (%)
Place of birth for the foreign-born population - Lebanon (%)
Place of birth for the foreign-born population - Saudi Arabia (%)
Place of birth for the foreign-born population - Syria (%)
Place of birth for the foreign-born population - Turkey (%)
Place of birth for the foreign-born population - Yemen (%)
Place of birth for the foreign-born population - Other Western Asia (%)
Place of birth for the foreign-born population - Eritrea (%)
Place of birth for the foreign-born population - Ethiopia (%)
Place of birth for the foreign-born population - Kenya (%)
Place of birth for the foreign-born population - Somalia (%)
Place of birth for the foreign-born population - Uganda (%)
Place of birth for the foreign-born population - Zimbabwe (%)
Place of birth for the foreign-born population - Other Eastern Africa (%)
Place of birth for the foreign-born population - Cameroon (%)
Place of birth for the foreign-born population - Congo (%)
Place of birth for the foreign-born population - Democratic Republic of Congo (Zaire) (%)
Place of birth for the foreign-born population - Other Middle Africa (%)
Place of birth for the foreign-born population - Egypt (%)
Place of birth for the foreign-born population - Morocco (%)
Place of birth for the foreign-born population - Sudan (%)
Place of birth for the foreign-born population - Other Northern Africa (%)
Place of birth for the foreign-born population - South Africa (%)
Place of birth for the foreign-born population - Other Southern Africa (%)
Place of birth for the foreign-born population - Cabo Verde (%)
Place of birth for the foreign-born population - Ghana (%)
Place of birth for the foreign-born population - Liberia (%)
Place of birth for the foreign-born population - Nigeria (%)
Place of birth for the foreign-born population - Senegal (%)
Place of birth for the foreign-born population - Sierra Leone (%)
Place of birth for the foreign-born population - Other Western Africa (%)
Place of birth for the foreign-born population - Australia (%)
Place of birth for the foreign-born population - New Zealand (%)
Place of birth for the foreign-born population - Fiji (%)
Place of birth for the foreign-born population - Micronesia (%)
Place of birth for the foreign-born population - Bahamas (%)
Place of birth for the foreign-born population - Barbados (%)
Place of birth for the foreign-born population - Cuba (%)
Place of birth for the foreign-born population - Dominica (%)
Place of birth for the foreign-born population - Dominican Republic (%)
Place of birth for the foreign-born population - Grenada (%)
Place of birth for the foreign-born population - Haiti (%)
Place of birth for the foreign-born population - Jamaica (%)
Place of birth for the foreign-born population - St. Vincent and the Grenadines (%)
Place of birth for the foreign-born population - Trinidad and Tobago (%)
Place of birth for the foreign-born population - West Indies (%)
Place of birth for the foreign-born population - Other Caribbean (%)
Place of birth for the foreign-born population - Belize (%)
Place of birth for the foreign-born population - Costa Rica (%)
Place of birth for the foreign-born population - El Salvador (%)
Place of birth for the foreign-born population - Guatemala (%)
Place of birth for the foreign-born population - Honduras (%)
Place of birth for the foreign-born population - Mexico (%)
Place of birth for the foreign-born population - Nicaragua (%)
Place of birth for the foreign-born population - Panama (%)
Place of birth for the foreign-born population - Other Central America (%)
Place of birth for the foreign-born population - Argentina (%)
Place of birth for the foreign-born population - Bolivia (%)
Place of birth for the foreign-born population - Brazil (%)
Place of birth for the foreign-born population - Chile (%)
Place of birth for the foreign-born population - Colombia (%)
Place of birth for the foreign-born population - Ecuador (%)
Place of birth for the foreign-born population - Guyana (%)
Place of birth for the foreign-born population - Peru (%)
Place of birth for the foreign-born population - Uruguay (%)
Place of birth for the foreign-born population - Venezuela (%)
Place of birth for the foreign-born population - Other South America (%)
Place of birth for the foreign-born population - Canada (%)
Place of birth for the foreign-born population - Other Northern America (%)
Place of birth for the foreign-born population - Other (%)
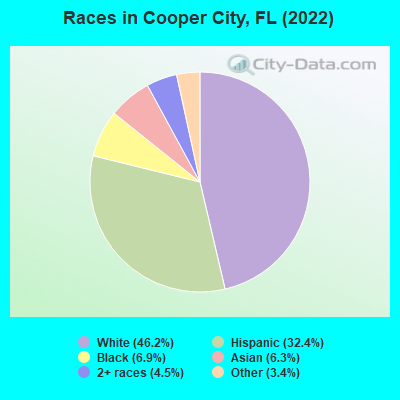
According to 2022 data, the most numerous races in Cooper City, FL are White alone (15,785 residents), Hispanic (11,065 residents), and Black alone (2,355 residents). 61.4% of Cooper City residents speak English at home. 27.3% of Cooper City, FL residents are foreign-born (16.8% born in Latin America, 5.9% born in Asia), which is 23.2% greater than the foreign-born rate of 21.0% across the entire state of Florida.
Race distribution in Cooper City
2000 2022
10,458,509 65.4% White alone 2,682,715 16.8% Hispanic 2,264,268 14.2% Black alone 261,693 1.6% Asian alone 236,954 1.5% Two or more races 42,358 0.3% American Indian alone 28,994 0.2% Other race alone 6,887 0.04% Native Hawaiian and Other
11,309,403 50.8% White alone 6,025,039 27.1% Hispanic 3,241,015 14.6% Black alone 861,630 3.9% Two or more races 623,692 2.8% Asian alone 152,054 0.7% Other race alone 22,504 0.1% American Indian alone 9,486 0.04% Native Hawaiian and Other
Income and house value in Cooper City Median household income in 2022 $126,502 White non-Hispanic householders$113,479 Black householdersover $200,000 American Indian and Alaska Native householders$112,774 Asian householders$122,779 Some other race householders$159,058 Two or more races householders$113,077 Hispanic or Latino race householdersMedian 2022 house value $555,952 White Non-Hispanic householders$524,827 Black or African American householders $560,603 Asian householders$484,401 Some other race householders$484,759 Two or more races householders$532,340 Hispanic or Latino householders
Median age by race in Cooper City
43.3 Median age for White residents43.6 42.9 34.2 Median age for Black or African American residents33.4 34.5 51.9 Median age for American Indian / Alaska Native residents-518,333,332.8 -735,362,996.9 40.0 Median age for Asian residents39.7 39.9 -437,357,630.5 Median age for Native Hawaiian / Pacific Islander residents-454,756,380.1 -666,666,666.0 46.3 Median age for Other race residents51.0 37.2 32.5 Median age for Two or more races residents30.4 37.7 43.1 Median age for White alone residents43.4 42.9 37.7 Median age for Hispanic or Latino residents37.9 37.6
Owner/renter occupied households by race in Cooper City
House owners and renters - White residents 6,060 87.4% Owner occupied875 12.6% Renter occupiedHouse owners and renters - Black or African American residents 508 68.6% Owner occupied233 31.4% Renter occupiedHouse owners and renters - American Indian / Alaska Native residents 42 100.0% Owner occupiedHouse owners and renters - Asian residents 608 96.4% Owner occupied22 3.6% Renter occupiedHouse owners and renters - Other race residents 497 86.0% Owner occupied81 14.0% Renter occupiedHouse owners and renters - Two or more races residents 1,563 79.4% Owner occupied405 20.6% Renter occupiedHouse owners and renters - White alone residents 5,403 90.4% Owner occupied575 9.6% Renter occupiedHouse owners and renters - Hispanic or Latino residents 2,615 78.1% Owner occupied732 21.9% Renter occupied
Language usage in Cooper City
English speakers - Total 61.4% of residents of Cooper City speak English at home.
25.6% of residents speak Spanish at home 6,426 77.4% Speak English very well1,876 22.6% Speak English less than very well12.3% of residents speak other language at home 2,698 67.8% Speak English very well1,284 32.2% Speak English less than very well
English speakers - Born in the United States 81.2% of residents of Cooper City speak English at home.
11.8% of residents speak Spanish at home 1,040 95.2% Speak English very well52 4.8% Speak English less than very well7.8% of residents speak other language at home 708 97.4% Speak English very well19 2.6% Speak English less than very well
English speakers - Native, born elsewhere 18.8% of residents of Cooper City speak English at home.
63.5% of residents speak Spanish at home 269 69.3% Speak English very well119 30.7% Speak English less than very well14.9% of residents speak other language at home 91 100.0% Speak English very well
English speakers - Foreign-born 22.9% of residents of Cooper City speak English at home.
45.9% of residents speak Spanish at home 2,699 63.5% Speak English very well1,551 36.5% Speak English less than very well30.9% of residents speak other language at home 1,684 58.8% Speak English very well1,178 41.2% Speak English less than very well
White (Caucasian) - Speak only English Native:
87.3% (13,286)Foreign-born:
18.8% (424)
White (Caucasian) - Speak another language Native:
13.2% (2,008)Foreign-born:
80.9% (1,829)
Black or African American - Speak only English Native:
95.4% (1,545)Foreign-born:
85.3% (673)
Black or African American - Speak another language Native:
5.2% (84)Foreign-born:
11.1% (88)
Asian - Speak only English Native:
46.2% (266)Foreign-born:
12.9% (200)
Asian - Speak another language Native:
55.1% (317)Foreign-born:
87.7% (1,355)
Other race - Speak only English Native:
45.4% (371)Foreign-born:
60.4% (701)
Other race - Speak another language Native:
55.4% (453)Foreign-born:
41.3% (479)
Two or more races - Speak only English Native:
47.7% (1,913)Foreign-born:
11.0% (373)
Two or more races - Speak another language Native:
52.3% (2,098)Foreign-born:
88.6% (3,002)
White alone - Speak only English Native:
92.8% (12,607)Foreign-born:
20.5% (312)
White alone - Speak another language Native:
7.2% (979)Foreign-born:
78.7% (1,200)
Hispanic or Latino - Speak only English Native:
37.0% (2,066)Foreign-born:
8.2% (366)
Hispanic or Latino - Speak another language Native:
63.0% (3,518)Foreign-born:
92.0% (4,120)
Foreign-born residents in Cooper City 9,335 residents are foreign born (16.8% Latin America , 5.9% Asia ).
This city:
27.3%Florida:
21.1%
Marital status for residents in Cooper City Marital status - White (Caucasian) population 15 years and over
Males 27.3% Never married62.3% Now married0.8% Separated1.0% Widowed8.5% DivorcedFemales 22.4% Never married53.9% Now married2.1% Separated6.7% Widowed14.9% DivorcedWomen who gave birth in the past 12 months Now married:
57.8% (71)Unmarried:
42.2% (52)
Women who did not give birth in the past 12 months Now married:
50.3% (1,784)Unmarried:
49.7% (1,761)
Marital status - Black or African American population 15 years and over
Males 36.8% Never married57.1% Now married5.0% Separated0.0% Widowed1.0% DivorcedFemales 45.1% Never married41.0% Now married1.1% Separated2.2% Widowed10.6% DivorcedWomen who gave birth in the past 12 months Now married:
100.0% (75)Unmarried:
0.0% (0)
Women who did not give birth in the past 12 months Now married:
25.9% (167)Unmarried:
74.1% (477)
Marital status - American Indian / Alaska Native population 15 years and over
Males 0.0% Never married44.0% Now married0.0% Separated0.0% Widowed56.0% DivorcedFemales 100.0% Never married0.0% Now married0.0% Separated0.0% Widowed0.0% DivorcedMarital status - Asian population 15 years and over
Males 15.6% Never married72.1% Now married1.1% Separated3.7% Widowed7.6% DivorcedFemales 22.9% Never married69.3% Now married1.0% Separated4.6% Widowed2.2% DivorcedWomen who gave birth in the past 12 months Now married:
100.0% (18)Unmarried:
0.0% (0)
Women who did not give birth in the past 12 months Now married:
67.5% (427)Unmarried:
32.5% (206)
Marital status - Other race population 15 years and over
Males 33.7% Never married52.6% Now married0.0% Separated0.0% Widowed13.7% DivorcedFemales 23.4% Never married68.0% Now married0.0% Separated3.5% Widowed5.1% DivorcedWomen who did not give birth in the past 12 months Now married:
58.8% (309)Unmarried:
41.2% (217)
Marital status - Two or more races population 15 years and over
Males 38.5% Never married55.1% Now married0.0% Separated2.8% Widowed3.6% DivorcedFemales 34.0% Never married50.1% Now married0.1% Separated2.9% Widowed12.8% DivorcedWomen who gave birth in the past 12 months Now married:
100.0% (26)Unmarried:
0.0% (0)
Women who did not give birth in the past 12 months Now married:
42.5% (882)Unmarried:
57.5% (1,192)
Marital status - White alone, not Hispanic / Latino population 15 years and over
Males 26.2% Never married62.9% Now married0.7% Separated1.1% Widowed9.0% DivorcedFemales 23.2% Never married54.0% Now married1.4% Separated7.7% Widowed13.7% DivorcedWomen who gave birth in the past 12 months Now married:
71.6% (86)Unmarried:
28.4% (34)
Women who did not give birth in the past 12 months Now married:
47.0% (1,448)Unmarried:
53.0% (1,636)
Marital status - Hispanic or Latino population 15 years and over
Males 32.7% Never married60.1% Now married0.7% Separated1.6% Widowed4.9% DivorcedFemales 21.2% Never married58.5% Now married2.7% Separated3.9% Widowed13.7% DivorcedWomen who gave birth in the past 12 months Now married:
34.7% (17)Unmarried:
65.3% (33)
Women who did not give birth in the past 12 months Now married:
59.0% (1,479)Unmarried:
41.0% (1,030)
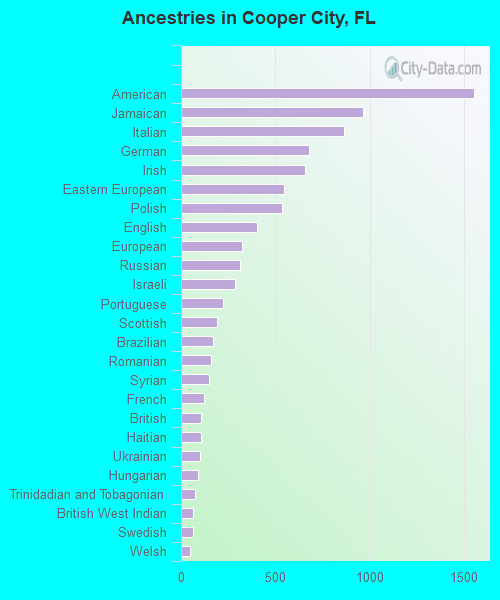
Ancestries in Cooper City
1,555 8.2% American963 5.1% Jamaican864 4.6% Italian677 3.6% German658 3.5% Irish547 2.9% Eastern European533 2.8% Polish404 2.1% English324 1.7% European313 1.7% Russian284 1.5% Israeli221 1.2% Portuguese192 1.0% Scottish172 0.9% Brazilian159 0.8% Romanian151 0.8% Syrian123 0.6% French108 0.6% British106 0.6% Haitian103 0.5% Ukrainian91 0.5% Hungarian73 0.4% Trinidadian and Tobagonian65 0.3% British West Indian63 0.3% Swedish49 0.3% Welsh48 0.3% Greek41 0.2% French Canadian40 0.2% Canadian39 0.2% Dutch31 0.2% Scotch-Irish28 0.1% Turkish24 0.1% Lithuanian23 0.1% Yugoslavian20 0.1% Belgian18 0.10% Iranian18 0.10% Albanian17 0.09% Palestinian16 0.08% Guyanese15 0.08% Norwegian13 0.07% Armenian13 0.07% Moroccan13 0.07% Bulgarian12 0.06% Scandinavian12 0.06% Serbian12 0.06% South African11 0.06% Czech10 0.05% Czechoslovakian9 0.05% Austrian8 0.04% Danish8 0.04% Pennsylvania German7 0.04% Finnish7 0.04% Northern European
Geographical mobility in Cooper City Same house 1 year ago 16,187 91.1% White (Caucasian)2,230 91.3% Black or African American35 63.1% American Indian / Alaska Native1,929 88.7% Asian1,885 93.3% Other race7,444 93.4% Two or more races14,339 91.3% White alone, not Hispanic / Latino9,876 90.8% Hispanic or LatinoMoved within same county 760 4.3% White / Caucasian138 5.7% Black or African American17 30.0% American Indian / Alaska Native163 7.5% Asian120 5.9% Other race39 0.5% Two or more races733 4.7% White alone, not Hispanic / Latino394 3.6% Hispanic or LatinoMoved within same state 284 1.6% White / Caucasian21 1.1% Other race273 3.4% Two or more races92 0.6% White alone, not Hispanic / Latino411 3.8% Hispanic or LatinoMoved from different state 468 2.6% White / Caucasian48 2.0% Black or African American62 2.8% Asian192 2.4% Two or more races482 3.1% White alone, not Hispanic / Latino89 0.8% Hispanic or LatinoMoved from abroad 130 0.7% White39 1.6% Black or African American59 0.4% White alone, not Hispanic / Latino109 1.0% Hispanic or Latino
Children Nativity (place of birth) in Cooper City
Children under 6 years - Living with two parents Both parents native 1,049 99.8% Native2 0.2% Foreign-bornBoth parents foreign-born 313 93.8% Native21 6.2% Foreign-bornOne native, one foreign-born parent 529 100.0% NativeChildren under 6 years - Living with one parent Native parent 252 99.2% Native2 0.8% Foreign-bornForeign-born parent 64 52.6% Native58 47.4% Foreign-bornChildren 6 to 17 years - Living with two parents Both parents native 2,038 99.6% Native7 0.4% Foreign-bornBoth parents foreign-born 1,005 72.8% Native376 27.2% Foreign-bornOne native, one foreign-born parent 1,057 100.0% NativeChildren 6 to 17 years - Living with one parent Native parent 697 100.0% NativeForeign-born parent 611 59.5% Native415 40.5% Foreign-born
Grandparents responsible for own grandchildren in Cooper City
Grandparents (30 to 59 years) Black or African American 30 68.6% Responsible for grandchildren14 31.4% Not responsible for grandchildrenAsian 29 80.0% Responsible for grandchildren7 20.0% Not responsible for grandchildrenTwo or more races 135 74.3% Responsible for grandchildren47 25.7% Not responsible for grandchildrenHispanic or Latino 120 81.2% Responsible for grandchildren28 18.8% Not responsible for grandchildrenGrandparents (60 years and over) Black or African American 40 69.9% Responsible for grandchildren17 30.1% Not responsible for grandchildrenAsian 65 100.0% Not responsible for grandchildrenTwo or more races 114 100.0% Not responsible for grandchildrenHispanic or Latino 10 5.9% Responsible for grandchildren154 94.1% Not responsible for grandchildren